Economic Cycle
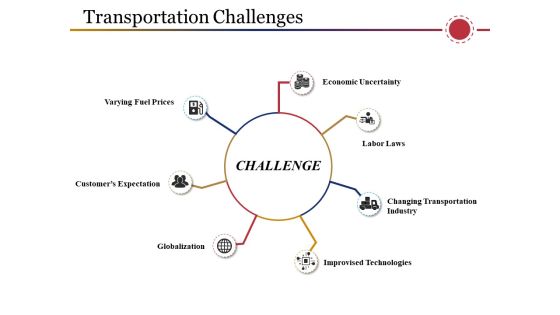
Transportation Challenges Ppt PowerPoint Presentation Show Clipart
This is a transportation challenges ppt powerpoint presentation show clipart. This is a seven stage process. The stages in this process are varying fuel prices, globalization, improvised technologies labor laws, economic uncertainty.
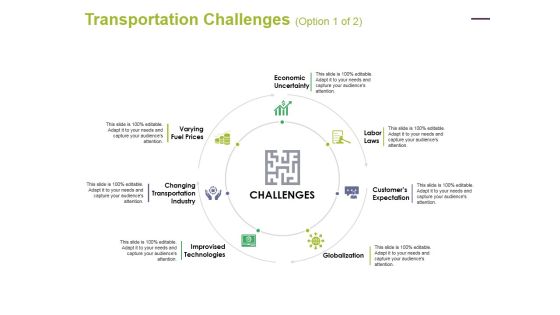
Transportation Challenges Template 2 Ppt PowerPoint Presentation Inspiration Introduction
This is a transportation challenges template 2 ppt powerpoint presentation inspiration introduction. This is a seven stage process. The stages in this process are economic uncertainty, labor laws, customers expectation, globalization, improvised technologies, changing transportation, industry, varying fuel prices.

Business Environment Dimensions Ppt PowerPoint Presentation Gallery Master Slide
This is a business environment dimensions ppt powerpoint presentation gallery master slide. This is a five stage process. The stages in this process are economic environment, political environment, business environment, social environment, legal environment.

Business Environment Dimensions Ppt PowerPoint Presentation Portfolio Show
This is a business environment dimensions ppt powerpoint presentation portfolio show. This is a five stage process. The stages in this process are technological environment, social environment, economic environment, political environment, legal environment.
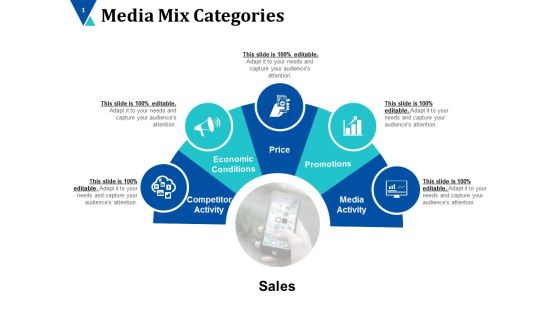
Media Mix Categories Ppt PowerPoint Presentation Infographics Introduction
This is a media mix categories ppt powerpoint presentation infographics introduction. This is a five stage process. The stages in this process are competitor activity, economic conditions, price, promotions, media activity.

Business Objectives Ppt PowerPoint Presentation Graphics
This is a business objectives ppt powerpoint presentation graphics. This is a five stage process. The stages in this process are economic objectives, social objectives, organic objectives, human objectives, national objectives.
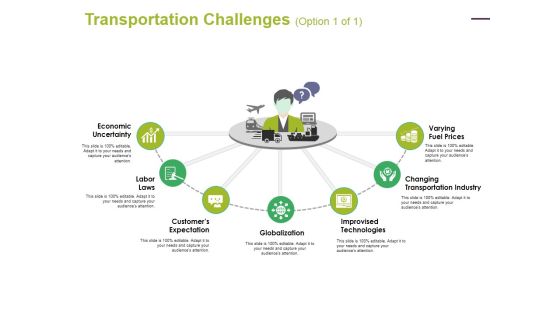
Transportation Challenges Template 1 Ppt PowerPoint Presentation Styles Master Slide
This is a transportation challenges template 1 ppt powerpoint presentation styles master slide. This is a seven stage process. The stages in this process are economic uncertainty, labor laws, customers expectation, globalization, improvised technologies.

Ppt Components Of Circular Process Layout PowerPoint Templates
PPT components of circular process layout PowerPoint Templates-You can use this circular flow diagram as basic economic model which describes the flow of money and products throughout the economy in a very simplified way. Use this graphics as key element in streamlining your economic plans-PPT components of circular process layout PowerPoint Templates-Arrow, Chart, Circular, Color, Colorful, Connect, Connection, Design, Diagram, Finance, Graphic, Group, Growth, Icon, Illustration, Marketing, Pieces, Process, Recycle, Recycling, Round, Set, Strategy, Symbol, Wheel
Business Finance Strategy Development Gears Strategic Management
Analyze Ailments On Our Business Cycle Diagram Gears Misc Strategic Management Powerpoint Templates. Bring Out The Thinking Doctor In You. Dock Your Thoughts With Our Business Cycle Diagram Gears Misc Strategic Management Powerpoint Templates. They Will L

Vendor Compliance Monitoring Dashboard Template PDF
Following slide shows vendor compliance monitoring dashboard. It covers KPIs namely top supplier by partner status, average procurement cycle time and average procurement cycle. Deliver an awe-inspiring pitch with this creative vendor compliance monitoring dashboard template pdf. bundle. Topics like rate of contract compliance by supplier category, procurement cycle time, procurement cycle, top suppliers by partner status can be discussed with this completely editable template. It is available for immediate download depending on the needs and requirements of the user.

Five Key Funding Factors To Make Decisions Ppt PowerPoint Presentation File Visuals PDF
This slide focuses on five factors that affect the investment decisions such as interest rates, economic growth, confidence, availability of finance, government policies, state of technology , etc. that helps investors to make informed decisions. Persuade your audience using this Five Key Funding Factors To Make Decisions Ppt PowerPoint Presentation File Visuals PDF. This PPT design covers five stages, thus making it a great tool to use. It also caters to a variety of topics including Economic Growth, Interest Rates, Government Policies, Availability Of Finance. Download this PPT design now to present a convincing pitch that not only emphasizes the topic but also showcases your presentation skills.
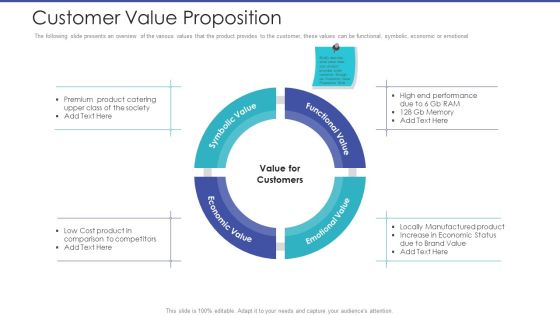
Tactical Planning For Marketing And Commercial Advancement Customer Value Proposition Diagrams PDF
The following slide presents an overview of the various values that the product provides to the customer, these values can be functional, symbolic, economic or emotional. Presenting tactical planning for marketing and commercial advancement customer value proposition diagrams pdf to provide visual cues and insights. Share and navigate important information on four stages that need your due attention. This template can be used to pitch topics like symbolic value, economic value, emotional value, functional value. In addtion, this PPT design contains high resolution images, graphics, etc, that are easily editable and available for immediate download.

Business Model Environment Evaluation With Market Demonstration PDF
This slide focuses on the business model environment analysis which includes key trends, market forces, macro-economic forces and industry forces with regulatory patterns, business stakeholders, economic infrastructure, market issues, revenue attractiveness, etc. Persuade your audience using this Business Model Environment Evaluation With Market Demonstration PDF. This PPT design covers four stages, thus making it a great tool to use. It also caters to a variety of topics including Technology Changes, Socioeconomic Trends, Market Segments. Download this PPT design now to present a convincing pitch that not only emphasizes the topic but also showcases your presentation skills.
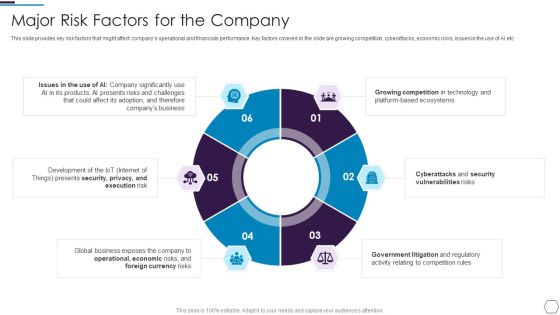
Information Technology Firm Report Example Major Risk Factors For The Company Template PDF
This slide provides key risk factors that might affect companys operational and financials performance. Key factors covered in the slide are growing competition, cyberattacks, economic risks, issues in the use of AI etc.Presenting Information Technology Firm Report Example Major Risk Factors For The Company Template PDF to provide visual cues and insights. Share and navigate important information on six stages that need your due attention. This template can be used to pitch topics like Growing Competition, Cyberattacks Vulnerabilities, Operational Economic In addtion, this PPT design contains high resolution images, graphics, etc, that are easily editable and available for immediate download.
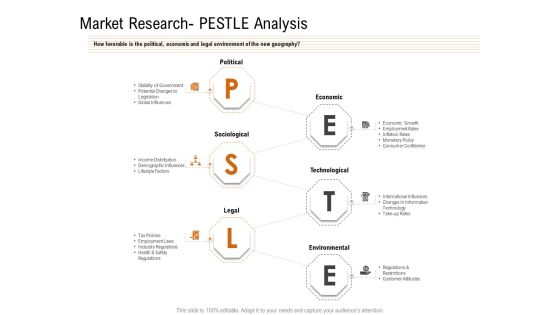
Opportunities And Threats For Penetrating In New Market Segments Market Research PESTLE Analysis Download PDF
How favorable is the political, economic and legal environment of the new geography. This is a opportunities and threats for penetrating in new market segments market research pestle analysis download pdf template with various stages. Focus and dispense information on six stages using this creative set, that comes with editable features. It contains large content boxes to add your information on topics like political, economic, sociological, technological, legal. You can also showcase facts, figures, and other relevant content using this PPT layout. Grab it now.

Performance Analysis Of New Product Development Identifying The Value Our Product Provides Download PDF
Purpose of the following slide is to displays the value proposition of the product. These various propositions are the functional value, emotional value, economic value and symbolic value. Presenting performance analysis of new product development identifying the value our product provides download pdf to provide visual cues and insights. Share and navigate important information on four stages that need your due attention. This template can be used to pitch topics like symbolic value, economic value, emotional value, functional value. In addtion, this PPT design contains high resolution images, graphics, etc, that are easily editable and available for immediate download.

Elements Of Legal Compliance Tactics Or Effective Regulation Mockup PDF
The following slide highlights legal compliance strategy important elements for forest sector management. It includes elements such as remedial actions, economic and political feasibility, knowledge base, improve underlying causes of illegality and stakeholder participation etc. Presenting Elements Of Legal Compliance Tactics Or Effective Regulation Mockup PDF to dispense important information. This template comprises yyyyyyyyyyyyyyyyyyyyyy stages. It also presents valuable insights into the topics including Economic Political Feasibility, Remedial Actions, Stakeholder Participation. This is a completely customizable PowerPoint theme that can be put to use immediately. So, download it and address the topic impactfully.

Environmental Marketing Focus On Three Pillars Of Sustainable Marketing Guidelines PDF
This slide covers three pillars of sustainable marketing which are environmental, social and economic impact of company operations. Environmental aspect includes green initiatives, social aspect includes health and safety of people and economic aspect includes employment generation. There are so many reasons you need a Environmental Marketing Focus On Three Pillars Of Sustainable Marketing Guidelines PDF. The first reason is you cannot spend time making everything from scratch, Thus, Slidegeeks has made presentation templates for you too. You can easily download these templates from our website easily.

Unconstrained Investment Selection Process Chart Diagram
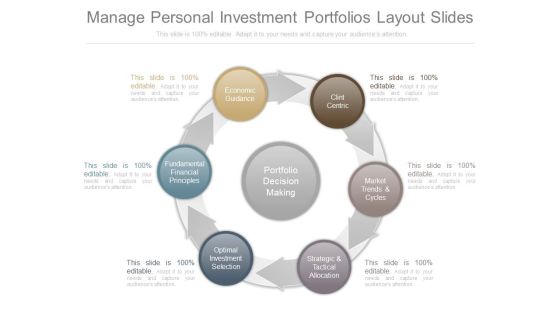
This is a unconstrained investment selection process chart diagram. This is a six stage process. The stages in this process are portfolio decision making, fundamental financial principles, client centric, economic guidance, optimal investment selection, strategic and tactical, allocation, market trends and cycles.
Manage Personal Investment Portfolios Layout Slides
This is a manage personal investment portfolios layout slides. This is a six stage process. The stages in this process are market trends and cycles, strategic and tactical allocation, optimal investment selection, fundamental financial principles, economic guidance, clint centric, portfolio decision making.

Capital Investment Options Vendor Compliance Kpi Dashboard Designs PDF
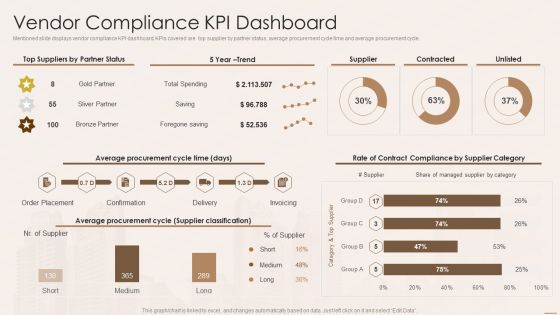
Mentioned slide displays vendor compliance KPI dashboard. KPIs covered are top supplier by partner status, average procurement cycle time and average procurement cycle. Deliver an awe inspiring pitch with this creative Capital Investment Options Vendor Compliance Kpi Dashboard Designs PDF bundle. Topics like Average Procurement, Cycle Time, Confirmation, Order Placement can be discussed with this completely editable template. It is available for immediate download depending on the needs and requirements of the user.
Real Estate Developers Funding Alternatives Vendor Compliance Kpi Dashboard Infographics PDF
Mentioned slide displays vendor compliance KPI dashboard. KPIs covered are top supplier by partner status, average procurement cycle time and average procurement cycle. Deliver and pitch your topic in the best possible manner with this Real Estate Developers Funding Alternatives Vendor Compliance Kpi Dashboard Infographics PDF. Use them to share invaluable insights on Average Procurement Cycle, Supplier Classification and impress your audience. This template can be altered and modified as per your expectations. So, grab it now.

Effective Initiation Of Information Technology Project Supplier Compliance Dashboard Topics PDF
This slide portrays supplier compliance monitoring dashboard. It covers KPIs namely top supplier by partner status, average procurement cycle time and average procurement cycle. Deliver an awe inspiring pitch with this creative effective initiation of information technology project supplier compliance dashboard topics pdf bundle. Topics like order placement, confirmation, delivery, invoicing, average procurement cycle time can be discussed with this completely editable template. It is available for immediate download depending on the needs and requirements of the user.
Stakeholder Engagement And Management Supplier Compliance Kpis Dashboard Pictures PDF
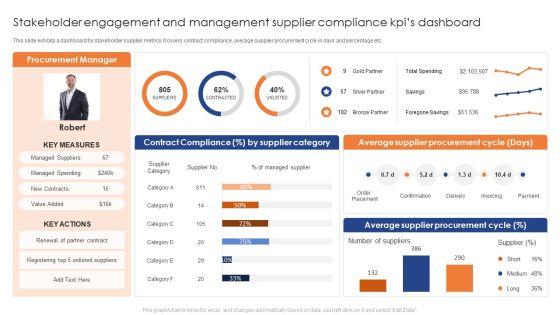
This slide exhibits a dashboard for stakeholder supplier metrics. It covers contract compliance, average supplier procurement cycle in days and percentage etc. Showcasing this set of slides titled Stakeholder Engagement And Management Supplier Compliance Kpis Dashboard Pictures PDF. The topics addressed in these templates are Average Supplier Procurement Cycle, Average Supplier Procurement Cycle . All the content presented in this PPT design is completely editable. Download it and make adjustments in color, background, font etc. as per your unique business setting.

PowerPoint Layouts Company Circular Flow Ppt Presentation
PowerPoint Layouts Company Circular Flow PPT Presentation-Flowchart is a simple mapping tool that shows the sequence of actions within a process. Flowchart is widely used in business, education and economic presentations to help the audience visualize the content better, or to find flaws in a process.-PowerPoint Layouts Company Circular Flow PPT Presentation
PowerPoint Designs Circular Flow Chart Ppt Design
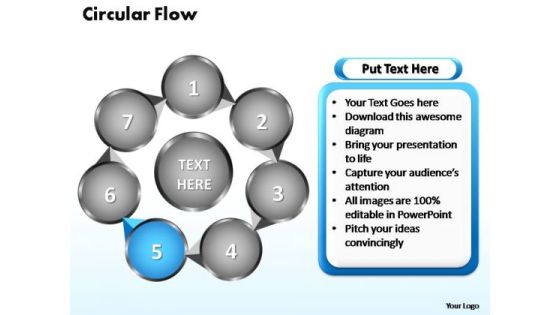
PowerPoint Designs Circular Flow Chart PPT Design-Flowchart is a simple mapping tool that shows the sequence of actions within a process. Flowchart is widely used in business, education and economic presentations to help the audience visualize the content better, or to find flaws in a process.-PowerPoint Designs Circular Flow Chart PPT Design
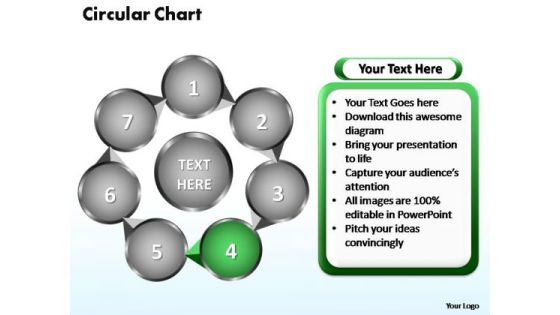
PowerPoint Designs Circular Flow Chart Ppt Designs
PowerPoint Designs Circular Flow Chart PPT Designs-Flowchart is a simple mapping tool that shows the sequence of actions within a process. Flowchart is widely used in business, education and economic presentations to help the audience visualize the content better, or to find flaws in a process.-PowerPoint Designs Circular Flow Chart PPT Designs

PowerPoint Designs Circular Flow Chart Ppt Slide
PowerPoint Designs Circular Flow Chart PPT Slide-Flowchart is a simple mapping tool that shows the sequence of actions within a process. Flowchart is widely used in business, education and economic presentations to help the audience visualize the content better, or to find flaws in a process.-PowerPoint Designs Circular Flow Chart PPT Slide
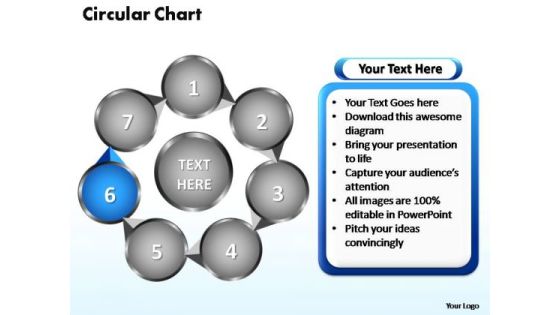
PowerPoint Designs Circular Flow Chart Ppt Slides
PowerPoint Designs Circular Flow Chart PPT Slides-Flowchart is a simple mapping tool that shows the sequence of actions within a process. Flowchart is widely used in business, education and economic presentations to help the audience visualize the content better, or to find flaws in a process.-PowerPoint Designs Circular Flow Chart PPT Slides
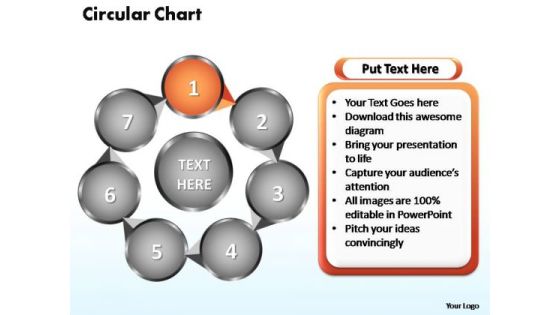
PowerPoint Designs Circular Flow Chart Ppt Template
PowerPoint Designs Circular Flow Chart PPT Template-Flowchart is a simple mapping tool that shows the sequence of actions within a process. Flowchart is widely used in business, education and economic presentations to help the audience visualize the content better, or to find flaws in a process.-PowerPoint Designs Circular Flow Chart PPT Template
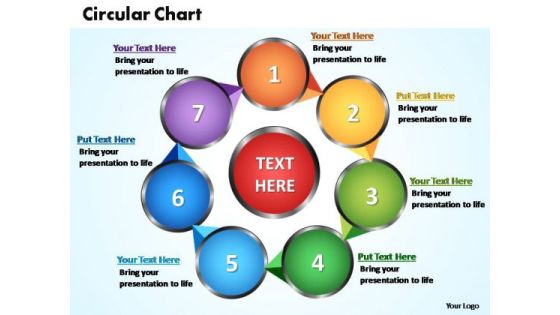
PowerPoint Designs Circular Flow Chart Ppt Templates
PowerPoint Designs Circular Flow Chart PPT Templates-Flowchart is a simple mapping tool that shows the sequence of actions within a process. Flowchart is widely used in business, education and economic presentations to help the audience visualize the content better, or to find flaws in a process.-PowerPoint Designs Circular Flow Chart PPT Templates
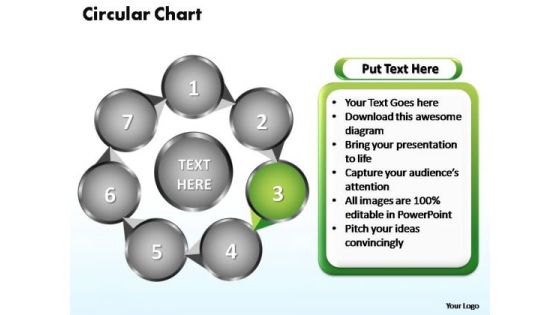
PowerPoint Designs Circular Flow Chart Ppt Theme
PowerPoint Designs Circular Flow Chart PPT Theme-Flowchart is a simple mapping tool that shows the sequence of actions within a process. Flowchart is widely used in business, education and economic presentations to help the audience visualize the content better, or to find flaws in a process.-PowerPoint Designs Circular Flow Chart PPT Theme
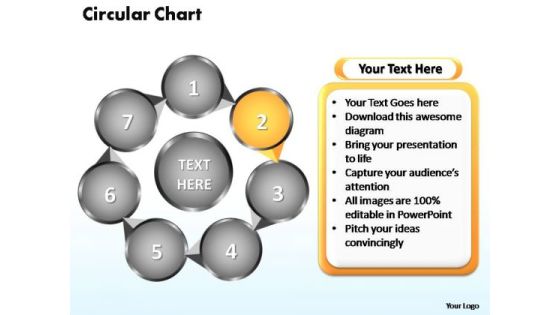
PowerPoint Designs Circular Flow Chart Ppt Themes
PowerPoint Designs Circular Flow Chart PPT Themes-Flowchart is a simple mapping tool that shows the sequence of actions within a process. Flowchart is widely used in business, education and economic presentations to help the audience visualize the content better, or to find flaws in a process.-PowerPoint Designs Circular Flow Chart PPT Themes
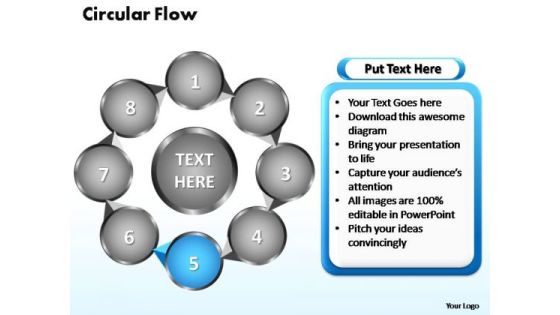
PowerPoint Slides Circular Flow Chart Ppt Design
PowerPoint Slides Circular Flow Chart PPT Design-Flowchart is a simple mapping tool that shows the sequence of actions within a process. Flowchart is widely used in business, education and economic presentations to help the audience visualize the content better, or to find flaws in a process.-PowerPoint Slides Circular Flow Chart PPT Design
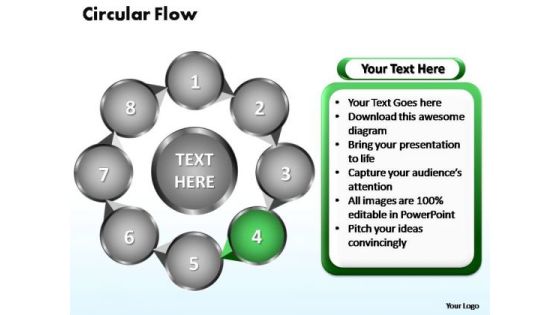
PowerPoint Slides Circular Flow Chart Ppt Designs
PowerPoint Slides Circular Flow Chart PPT Designs-Flowchart is a simple mapping tool that shows the sequence of actions within a process. Flowchart is widely used in business, education and economic presentations to help the audience visualize the content better, or to find flaws in a process.-PowerPoint Slides Circular Flow Chart PPT Designs
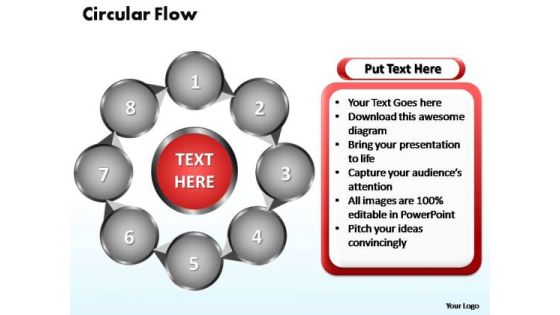
PowerPoint Slides Circular Flow Chart Ppt Layout
PowerPoint Slides Circular Flow Chart PPT Layout-Flowchart is a simple mapping tool that shows the sequence of actions within a process. Flowchart is widely used in business, education and economic presentations to help the audience visualize the content better, or to find flaws in a process.-PowerPoint Slides Circular Flow Chart PPT Layout

PowerPoint Slides Circular Flow Chart Ppt Layouts
PowerPoint Slides Circular Flow Chart PPT Layouts-Flowchart is a simple mapping tool that shows the sequence of actions within a process. Flowchart is widely used in business, education and economic presentations to help the audience visualize the content better, or to find flaws in a process.-PowerPoint Slides Circular Flow Chart PPT Layouts

PowerPoint Slides Circular Flow Chart Ppt Slide
PowerPoint Slides Circular Flow Chart PPT Slide-Flowchart is a simple mapping tool that shows the sequence of actions within a process. Flowchart is widely used in business, education and economic presentations to help the audience visualize the content better, or to find flaws in a process.-PowerPoint Slides Circular Flow Chart PPT Slide

PowerPoint Slides Circular Flow Chart Ppt Slides
PowerPoint Slides Circular Flow Chart PPT Slides-Flowchart is a simple mapping tool that shows the sequence of actions within a process. Flowchart is widely used in business, education and economic presentations to help the audience visualize the content better, or to find flaws in a process.-PowerPoint Slides Circular Flow Chart PPT Slides

PowerPoint Slides Circular Flow Chart Ppt Template
PowerPoint Slides Circular Flow Chart PPT Template-Flowchart is a simple mapping tool that shows the sequence of actions within a process. Flowchart is widely used in business, education and economic presentations to help the audience visualize the content better, or to find flaws in a process.-PowerPoint Slides Circular Flow Chart PPT Template
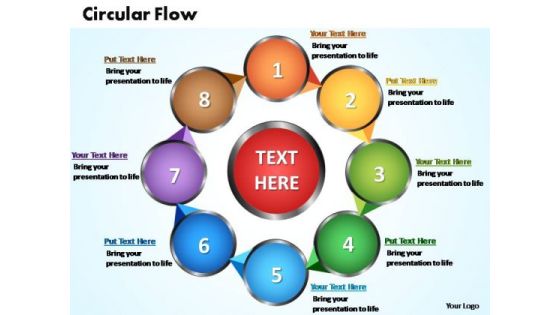
PowerPoint Slides Circular Flow Chart Ppt Templates
PowerPoint Slides Circular Flow Chart PPT Templates-Flowchart is a simple mapping tool that shows the sequence of actions within a process. Flowchart is widely used in business, education and economic presentations to help the audience visualize the content better, or to find flaws in a process.-PowerPoint Slides Circular Flow Chart PPT Templates
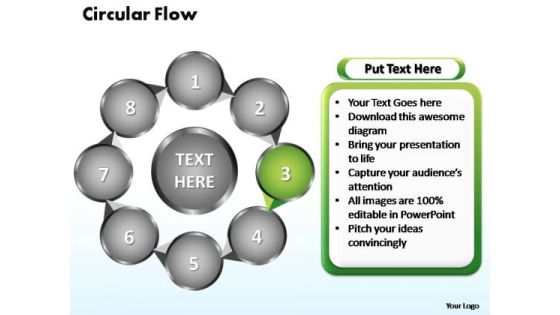
PowerPoint Slides Circular Flow Chart Ppt Theme
PowerPoint Slides Circular Flow Chart PPT Theme-Flowchart is a simple mapping tool that shows the sequence of actions within a process. Flowchart is widely used in business, education and economic presentations to help the audience visualize the content better, or to find flaws in a process.-PowerPoint Slides Circular Flow Chart PPT Theme
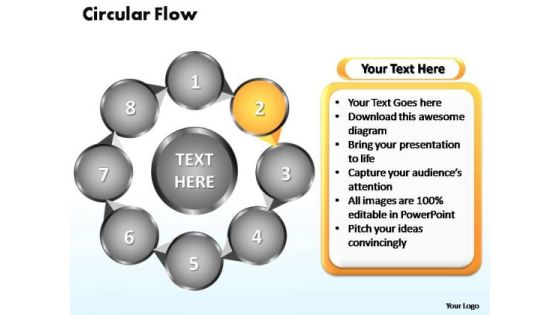
PowerPoint Slides Circular Flow Chart Ppt Themes
PowerPoint Slides Circular Flow Chart PPT Themes-Flowchart is a simple mapping tool that shows the sequence of actions within a process. Flowchart is widely used in business, education and economic presentations to help the audience visualize the content better, or to find flaws in a process.-PowerPoint Slides Circular Flow Chart PPT Themes

PowerPoint Themes Circular Flow Chart Ppt Design
PowerPoint Themes Circular Flow Chart PPT Design-Flowchart is a simple mapping tool that shows the sequence of actions within a process. Flowchart is widely used in business, education and economic presentations to help the audience visualize the content better, or to find flaws in a process.-PowerPoint Themes Circular Flow Chart PPT Design

PowerPoint Themes Circular Flow Chart Ppt Designs
PowerPoint Themes Circular Flow Chart PPT Designs-Flowchart is a simple mapping tool that shows the sequence of actions within a process. Flowchart is widely used in business, education and economic presentations to help the audience visualize the content better, or to find flaws in a process.-PowerPoint Themes Circular Flow Chart PPT Designs
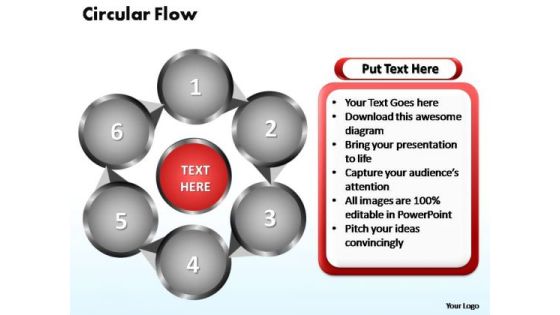
PowerPoint Themes Circular Flow Chart Ppt Layouts
PowerPoint Themes Circular Flow Chart PPT Layouts-Flowchart is a simple mapping tool that shows the sequence of actions within a process. Flowchart is widely used in business, education and economic presentations to help the audience visualize the content better, or to find flaws in a process.-PowerPoint Themes Circular Flow Chart PPT Layouts
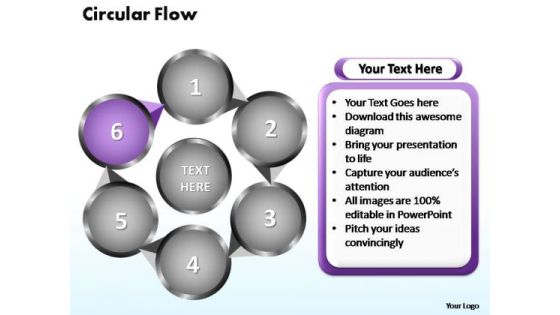
PowerPoint Themes Circular Flow Chart Ppt Slide
PowerPoint Themes Circular Flow Chart PPT Slide-Flowchart is a simple mapping tool that shows the sequence of actions within a process. Flowchart is widely used in business, education and economic presentations to help the audience visualize the content better, or to find flaws in a process.-PowerPoint Themes Circular Flow Chart PPT Slide

PowerPoint Themes Circular Flow Chart Ppt Slides
PowerPoint Themes Circular Flow Chart PPT Slides-Flowchart is a simple mapping tool that shows the sequence of actions within a process. Flowchart is widely used in business, education and economic presentations to help the audience visualize the content better, or to find flaws in a process.-PowerPoint Themes Circular Flow Chart PPT Slides

PowerPoint Themes Circular Flow Chart Ppt Template
PowerPoint Themes Circular Flow Chart PPT Template-Flowchart is a simple mapping tool that shows the sequence of actions within a process. Flowchart is widely used in business, education and economic presentations to help the audience visualize the content better, or to find flaws in a process.-PowerPoint Themes Circular Flow Chart PPT Template
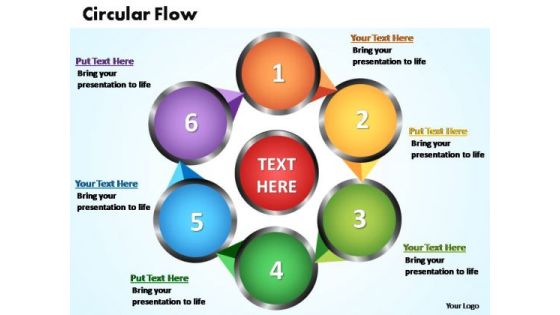
PowerPoint Themes Circular Flow Chart Ppt Templates
PowerPoint Themes Circular Flow Chart PPT Templates-Flowchart is a simple mapping tool that shows the sequence of actions within a process. Flowchart is widely used in business, education and economic presentations to help the audience visualize the content better, or to find flaws in a process.-PowerPoint Themes Circular Flow Chart PPT Templates

PowerPoint Themes Circular Flow Chart Ppt Theme
PowerPoint Themes Circular Flow Chart PPT Theme-Flowchart is a simple mapping tool that shows the sequence of actions within a process. Flowchart is widely used in business, education and economic presentations to help the audience visualize the content better, or to find flaws in a process.-PowerPoint Themes Circular Flow Chart PPT Theme

Potential Sources Of Investment Risk Powerpoint Show
This is a potential sources of investment risk powerpoint show. This is a six stage process. The stages in this process are compound growth, tax deferred growth, guarantees on capital or returns, inflation, risk, general economic factors, factors affecting investment risk.

Bank Service Credit Card Financial Care Vector Icon Ppt PowerPoint Presentation Gallery Themes
Presenting this set of slides with name bank service credit card financial care vector icon ppt powerpoint presentation gallery themes. This is a one stage process. The stages in this process are financial service, economic planning, financial institution. This is a completely editable PowerPoint presentation and is available for immediate download. Download now and impress your audience.
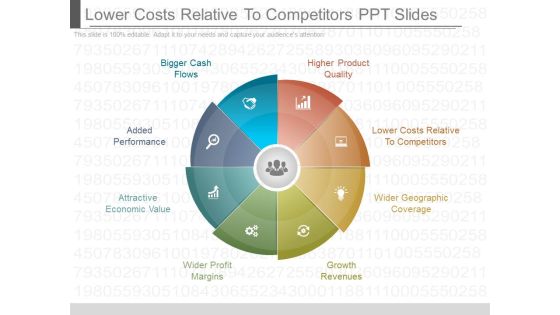
Lower Costs Relative To Competitors Ppt Slides
This is a lower costs relative to competitors ppt slides. This is a eight stage process. The stages in this process are bigger cash flows, added performance, attractive economic value, wider profit margins, growth revenues, wider geographic coverage, lower costs relative to competitors, higher product quality.

Banking Services Saving Accounts Business Loans Ppt PowerPoint Presentation Styles Design Inspiration
Presenting this set of slides with name banking services saving accounts business loans ppt powerpoint presentation styles design inspiration. This is a four stage process. The stages in this process are financial service, economic planning, financial institution. This is a completely editable PowerPoint presentation and is available for immediate download. Download now and impress your audience.
E Commerce E Environment Ppt PowerPoint Presentation Icon Graphic Tips PDF
Presenting this set of slides with name e commerce e environment ppt powerpoint presentation icon graphic tips pdf. This is a eight stage process. The stages in this process are work economic forces, technology, legal, regulation, communities, customers, clients, partners, competitors. This is a completely editable PowerPoint presentation and is available for immediate download. Download now and impress your audience.

Business Research Study Design Powerpoint Slides
This is a business research study design powerpoint slides. This is a six stage process. The stages in this process are customer base management and development, financial and economic analysis in communities, government based planning and development analysis, market segmentation and analysis, scientific research study design and analysis, real estate development and analysis.
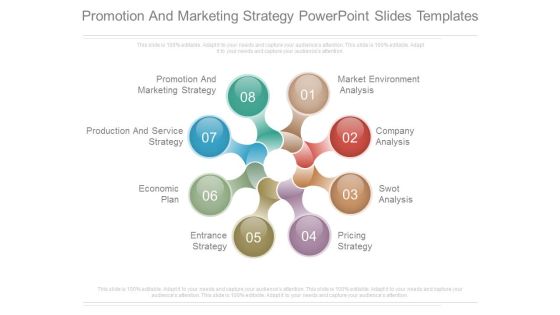
Promotion And Marketing Strategy Powerpoint Slides Templates
This is a promotion and marketing strategy powerpoint slides templates. This is a eight stage process. The stages in this process are promotion and marketing strategy, company analysis, swot analysis, pricing strategy, entrance strategy, economic plan, production and service strategy, promotion and marketing strategy.

Distribution Value Chain Analysis Ppt Powerpoint Templates
This is distribution value chain analysis ppt powerpoint templates. This is a eight stage process. The stages in this process are distribution value chain analysis, competitive analysis, market sizing and, dynamics, economic impact analysis, product value analysis, plan project, cash flow model, business modeling quantitative market analysis.

Community And Social Services Presentation Powerpoint
This is a community and social services presentation powerpoint. This is a six stage process. The stages in this process are knowledge creation and management, direct service for service, general science and innovation, community and social services, economic development, workforce management.
 Home
Home