Diversification
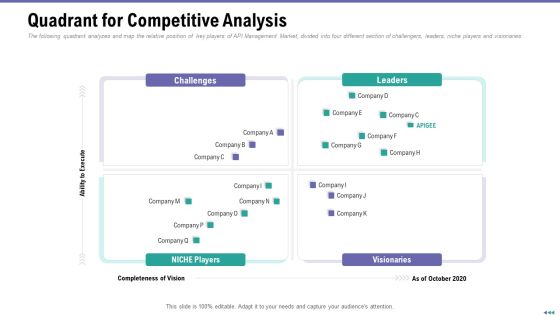
Market Viewpoint Application Programming Interface Governance Quadrant For Competitive Analysis Clipart PDF
The following quadrant analyzes and map the relative position of key players of API Management Market, divided into four different section of challengers, leaders, niche players and visionaries. Presenting market viewpoint application programming interface governance quadrant for competitive analysis clipart pdf to provide visual cues and insights. Share and navigate important information on four stages that need your due attention. This template can be used to pitch topics like challenges, leaders, visionaries, niche players. In addtion, this PPT design contains high resolution images, graphics, etc, that are easily editable and available for immediate download.

API Ecosystem Quadrant For Competitive Analysis Graphics PDF
The following quadrant analyzes and map the relative position of key players of API Management Market, divided into four different section of challengers, leaders, niche players and visionaries. This is a api ecosystem quadrant for competitive analysis graphics pdf template with various stages. Focus and dispense information on four stages using this creative set, that comes with editable features. It contains large content boxes to add your information on topics like quadrant for competitive analysis. You can also showcase facts, figures, and other relevant content using this PPT layout. Grab it now.

Project Management Under Supervision Project Completion Status With Start And Finish Dates Sample PDF
This slide shows the project completion summary with the percentage of variance in hours and budget allocated. Deliver an awe inspiring pitch with this creative project management under supervision project completion status with start and finish dates sample pdf bundle. Topics like baseline, variance, actual, budget can be discussed with this completely editable template. It is available for immediate download depending on the needs and requirements of the user.

Quality Assurance Model For Agile IT Setting Performance Standards For Project Quality Diagrams PDF
Mentioned slide displays information on the performance standards set by the firm in order to maintain its project quality. Deliver an awe inspiring pitch with this creative quality assurance model for agile it setting performance standards for project quality diagrams pdf bundle. Topics like defect removal efficiency, cost variance, schedule variance, customer satisfaction index can be discussed with this completely editable template. It is available for immediate download depending on the needs and requirements of the user.

BCWP Calculation In Project Management Background PDF
The following slide highlights the earned value calculation in project management illustrating key headings which includes metrics, formula, equation, calculation and inference.Pitch your topic with ease and precision using this BCWP Calculation In Project Management Background PDF This layout presents information on Schedule Variance, Cost Variance, Performance Index It is also available for immediate download and adjustment. So, changes can be made in the color, design, graphics or any other component to create a unique layout.
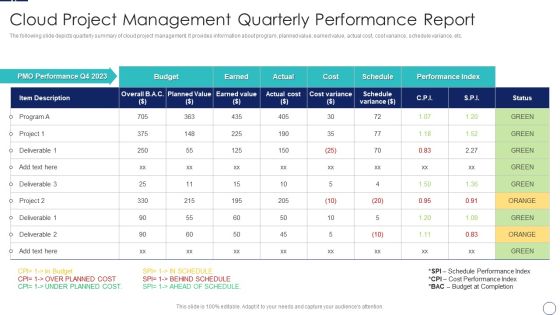
How To Implement Cloud Collaboration Cloud Project Management Quarterly Performance Report Template PDF
The following slide depicts quarterly summary of cloud project management. It provides information about program, planned value, earned value, actual cost, cost variance, schedule variance, etc. Deliver an awe inspiring pitch with this creative How To Implement Cloud Collaboration Cloud Project Management Quarterly Performance Report Template PDF bundle. Topics like PMO Performance, Planned Value, Earned Value can be discussed with this completely editable template. It is available for immediate download depending on the needs and requirements of the user.

Content Freelance Marketing Engagement Metrics Elements PDF
The following slide highlights the content freelance marketing engagement metrics illustrating metrics which includes shares, benchmark, target, result and variance to measure the result and variance with target. Showcasing this set of slides titled Content Freelance Marketing Engagement Metrics Elements PDF. The topics addressed in these templates are Metrics, Survey Completion Rate, Bounce Rate. All the content presented in this PPT design is completely editable. Download it and make adjustments in color, background, font etc. as per your unique business setting.

Scrum Kpis Sprint Performance Dashboard Ppt Portfolio Example Introduction PDF
This slide illustrates graphical representation of sprint performance in scrum framework. It includes KPIs like team velocity, past trends of velocity and variance in sprints etc. Showcasing this set of slides titled Scrum Kpis Sprint Performance Dashboard Ppt Portfolio Example Introduction PDF. The topics addressed in these templates are Team Velocity, Past Trends Velocity, Variance Sprint. All the content presented in this PPT design is completely editable. Download it and make adjustments in color, background, font etc. as per your unique business setting.

Portfolio Wealth Management Gap Analysis Highlighting Need Of Portfolio Portrait PDF
This slide represents gap analysis showcasing need for portfolio and investment management. It includes operational efficiency, time spend on project scheduling, budget variance etc. Deliver an awe inspiring pitch with this creative Portfolio Wealth Management Gap Analysis Highlighting Need Of Portfolio Portrait PDF bundle. Topics like Operational Efficiency, Budget Variance, Delivered Business Value can be discussed with this completely editable template. It is available for immediate download depending on the needs and requirements of the user.

Gap Analysis Highlighting Need Of Portfolio Management Designs PDF
This slide represents gap analysis showcasing need for portfolio and investment management. It includes operational efficiency, time spend on project scheduling, budget variance etc. Deliver an awe inspiring pitch with this creative Gap Analysis Highlighting Need Of Portfolio Management Designs PDF bundle. Topics like Operational Efficiency, Budget Variance, Customer Satisfaction can be discussed with this completely editable template. It is available for immediate download depending on the needs and requirements of the user.

Diversified Profitable Portfolio Gap Analysis Highlighting Need Of Portfolio Management Designs PDF
This slide represents gap analysis showcasing need for portfolio and investment management. It includes operational efficiency, time spend on project scheduling, budget variance etc. Deliver and pitch your topic in the best possible manner with this Diversified Profitable Portfolio Gap Analysis Highlighting Need Of Portfolio Management Designs PDF. Use them to share invaluable insights on Budget Variance, Customer Satisfaction, Delivered Business Value and impress your audience. This template can be altered and modified as per your expectations. So, grab it now.

Impact Of Portfolio Management Post Implementation Summary PDF
This slide represents impact of portfolio management post implementation. It covers operational efficiency, time spend for project scheduling, budget variance etc. Deliver an awe inspiring pitch with this creative Impact Of Portfolio Management Post Implementation Summary PDF bundle. Topics like Operational Efficiency, Customer Satisfaction, Budget Variance can be discussed with this completely editable template. It is available for immediate download depending on the needs and requirements of the user.

Kpis To Measure B2B Promotional Communication Results Graphics PDF
This slide signifies the key performance indicator to evaluate business to business marketing communication results. It covers information about metrics, key description, forecast, actual, variance and strategies. Showcasing this set of slides titled Kpis To Measure B2B Promotional Communication Results Graphics PDF. The topics addressed in these templates are Key Description, Forecast, Actual, Variance. All the content presented in this PPT design is completely editable. Download it and make adjustments in color, background, font etc. as per your unique business setting.

Earned Value Management Project Analysis Report Ppt Ideas Elements PDF
This slide represents earned value management project report showcasing budget cost, planned value, actual cost, earned value, schedule variance, cost variance etc. Showcasing this set of slides titled Earned Value Management Project Analysis Report Ppt Ideas Elements PDF. The topics addressed in these templates are Setting Scope, Higher Level Planning, Organizing Workshops. All the content presented in this PPT design is completely editable. Download it and make adjustments in color, background, font etc. as per your unique business setting.

Project Monitoring Plan For Construction Costs Ppt Styles Elements PDF
This slide illustrates project controls plan for construction costs. It provides information about category and items, projected, actual, variance, party responsible, status, paid, due, etc. Pitch your topic with ease and precision using this Project Monitoring Plan For Construction Costs Ppt Styles Elements PDF. This layout presents information on Actual Subtotal, Variance, Current Paid. It is also available for immediate download and adjustment. So, changes can be made in the color, design, graphics or any other component to create a unique layout.

Various Project Budget Forecast Of IT Company Ppt Styles Ideas PDF
This slide represents the cost estimation table of various IT projects. It shows details like project name, budget, forecast, variance and status of portfolio changes. Pitch your topic with ease and precision using this Various Project Budget Forecast Of IT Company Ppt Styles Ideas PDF. This layout presents information on Budget, Forecast, Variance, Project. It is also available for immediate download and adjustment. So, changes can be made in the color, design, graphics or any other component to create a unique layout.

Financial KPI Dashboard With Liquidity Ratio Analysis And Current Assets Breakdown Ideas PDF
This showcases KPI dashboard the can help organization to evaluate the financial performance and analyze the liquidity ratios. Its key components are vendor payment error rate, budget variance and cash conversion cycle. Showcasing this set of slides titled. The topics addressed in these templates are Quick Status, Workning Capital, Budget Variance. All the content presented in this PPT design is completely editable. Download it and make adjustments in color, background, font etc. as per your unique business setting.

Key Business Metrics To Track Ecommerce User On Boarding Success Pictures PDF
This slide signifies the key organisation metric to measure ecommerce onboading plan. It covers information about kpis, key description, projection, actual and variance. Pitch your topic with ease and precision using this Key Business Metrics To Track Ecommerce User On Boarding Success Pictures PDF. This layout presents information on Key Description, Projection, Variance. It is also available for immediate download and adjustment. So, changes can be made in the color, design, graphics or any other component to create a unique layout.

Various Types Of Market Segmentation Geographic Ppt PowerPoint Presentation File Pictures PDF
The following slide showcases geographic segmentation which can be used to divided the market based on location. The division can be done on the basis of country, region, city, and population density. Welcome to our selection of the Various Types Of Market Segmentation Geographic Ppt PowerPoint Presentation File Pictures PDF. These are designed to help you showcase your creativity and bring your sphere to life. Planning and Innovation are essential for any business that is just starting out. This collection contains the designs that you need for your everyday presentations. All of our PowerPoints are 100 percent editable, so you can customize them to suit your needs. This multi purpose template can be used in various situations. Grab these presentation templates today.

Construction Quality Assurance Matrix And Stakeholders Responsibilities Information PDF
This slide covers matrix to assess quality of construction project. It includes elements such as quality assurance testing, construction division consisting of director, manager, site manager along with design managers, design team, environmental team, quality manager, etc. Showcasing this set of slides titled Construction Quality Assurance Matrix And Stakeholders Responsibilities Information PDF. The topics addressed in these templates are Quality Assurance Testing, Construction Division, Services Divisions. All the content presented in this PPT design is completely editable. Download it and make adjustments in color, background, font etc. as per your unique business setting.

3d Circular Layout Diagram 5 Stages Network Marketing Business Plan PowerPoint Slides
We present our 3d circular layout diagram 5 stages network marketing business plan PowerPoint Slides.Download and present our Process and Flows PowerPoint Templates because You should Bet on your luck with our PowerPoint Templates and Slides. Be assured that you will hit the jackpot. Present our Flow Charts PowerPoint Templates because You can safely bank on our PowerPoint Templates and Slides. They will provide a growth factor to your valuable thoughts. Download and present our Ring Charts PowerPoint Templates because Our PowerPoint Templates and Slides will let your team Walk through your plans. See their energy levels rise as you show them the way. Present our Marketing PowerPoint Templates because Our PowerPoint Templates and Slides help you meet the demand of the Market. Just browse and pick the slides that appeal to your intuitive senses. Download our Success PowerPoint Templates because you can Add colour to your speech with our PowerPoint Templates and Slides. Your presentation will leave your audience speechless.Use these PowerPoint slides for presentations relating to Account, accounting, analyzing, business, calculate, chart, circle, concept, data, diagram, display, division, economy, five, finance, financial, graph, graphic, growth, illustration, information, market, marketing, part, partition, percentage, performance, pie, piece, planning, portion,presentation, profit, progress, report, round, sales, shape, slice, statistic, stock, success, survey, symbol, wealth. The prominent colors used in the PowerPoint template are Purple, Green lime, Blue light.

3d Circular Network Diagram 6 Stages Clothing Store Business Plan PowerPoint Templates
We present our 3d circular network diagram 6 stages clothing store business plan PowerPoint templates.Use our Flow Charts PowerPoint Templates because Our PowerPoint Templates and Slides will let you meet your Deadlines. Download and present our Process and Flows PowerPoint Templates because Our PowerPoint Templates and Slides will let you Hit the right notes. Watch your audience start singing to your tune. Use our Marketing PowerPoint Templates because It can Conjure up grand ideas with our magical PowerPoint Templates and Slides. Leave everyone awestruck by the end of your presentation. Download and present our Ring Charts PowerPoint Templates because Our PowerPoint Templates and Slides will let you meet your Deadlines. Download and present our Shapes PowerPoint Templates because You can Connect the dots. Fan expectations as the whole picture emerges.Use these PowerPoint slides for presentations relating to Account, accounting, analyzing, business, calculate, chart, circle, concept, data, diagram, display, division, economy, editable, finance, financial, graph, graphic, growth, illustration, information, market, marketing, part, partition, pie, piece, planning, portion,presentation, profit, progress, report, round, sales, shape, slice, statistic, stock, success, survey, symbol, wealth. The prominent colors used in the PowerPoint template are Pink, Red, Green lime.

Project Cost Budget Management Allocation Annual Plan Slides PDF
In this slide we have showcased project budget allocation plan for 3 activities for a complete year. We have divided the budget in 4 quarters Q1, Q2,Q3, Q4.Showcasing this set of slides titled project cost budget management allocation annual plan slides pdf. The topics addressed in these templates are project cost budget management allocation annual plan. All the content presented in this PPT design is completely editable. Download it and make adjustments in color, background, font etc. as per your unique business setting.
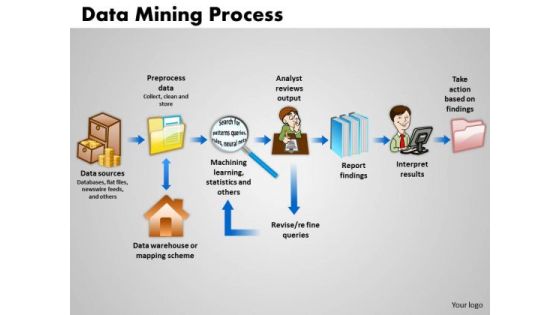
Business Arrows PowerPoint Templates Success Data Mining Process Ppt Slides
Business Arrows PowerPoint Templates Success data mining process PPT Slides-This data mining PowerPoint template can be used for example in presentations where you need to explain data mining algorithms-Business Arrows PowerPoint Templates Success data mining process PPT Slides-This template can be used for presentations relating to Analysis, Anomaly, Artificial, Break, Clean, Computer, Cut, Data, Database, Decision, Detection, Discovery, Divide, Explore, Extract, Hammer, Helmet, Human, Index, Intelligence, Kdd, knowledge, Learning, Light, Mallet, Management, Mining, Model, Movement, Pattern, Predictive, Process, Records, Recycle, Repair, Safety, Science
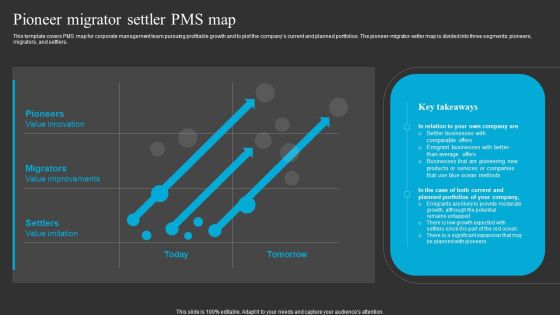
Pioneer Migrator Settler Pms Map Ppt Slides Layout Ideas PDF
This template covers PMS map for corporate management team pursuing profitable growth and to plot the companys current and planned portfolios. The pioneer-migrator-setter map is divided into three segments pioneers, migrators, and settlers. There are so many reasons you need a Pioneer Migrator Settler Pms Map Ppt Slides Layout Ideas PDF. The first reason is you can not spend time making everything from scratch, Thus, Slidegeeks has made presentation templates for you too. You can easily download these templates from our website easily.

Risk Based Methodology Consequences Table For Probability And Impact Introduction PDF
This slide covers predetermined status of the QRM process, after consideration of the specific consequences for the process undergoing risk assessment. In this consequences are split according to the probability and impact scores.Find highly impressive Risk Based Methodology Consequences Table For Probability And Impact Introduction PDF on Slidegeeks to deliver a meaningful presentation. You can save an ample amount of time using these presentation templates. No need to worry to prepare everything from scratch because Slidegeeks experts have already done a huge research and work for you. You need to download Risk Based Methodology Consequences Table For Probability And Impact Introduction PDF for your upcoming presentation. All the presentation templates are 100 percent editable and you can change the color and personalize the content accordingly. Download now

Quality Assessment Consequences Table For Probability And Impact Ideas PDF
This slide covers predetermined status of the QRM process, after consideration of the specific consequences for the process undergoing risk assessment. In this consequences are split according to the probability and impact scores Crafting an eye catching presentation has never been more straightforward. Let your presentation shine with this tasteful yet straightforward Quality Assessment Consequences Table For Probability And Impact Ideas PDF template. It offers a minimalistic and classy look that is great for making a statement. The colors have been employed intelligently to add a bit of playfulness while still remaining professional. Construct the ideal Quality Assessment Consequences Table For Probability And Impact Ideas PDF that effortlessly grabs the attention of your audience. Begin now and be certain to wow your customers.

How To Reach Your Target Audience PowerPoint Templates
Concept of target division for teams has been displayed in this 3d diagram. To display this concept we have used graphic of target boards design pie chart and team. Use this business diagram to build quality presentation for your viewers.

Field Of Marketing Structure Diagram Ppt Powerpoint Ideas
This is a field of marketing structure diagram ppt powerpoint ideas. This is a five stage process. The stages in this process are country sales, product division, product div.
Success Formula With Lean Management Ppt Powerpoint Slides
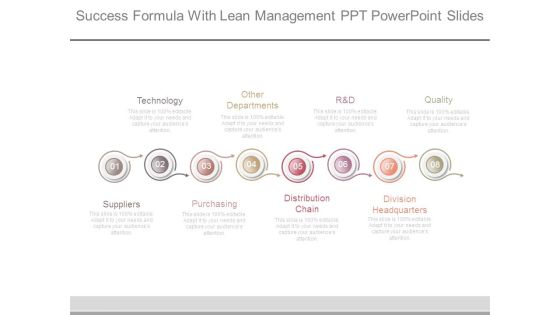
This is a success formula with lean management ppt powerpoint slides. This is a eight stage process. The stages in this process are technology, other departments, r and d, quality, suppliers, purchasing, distribution chain, division headquarters.
Policy Deployment Cascading Matrix Diagram Ppt Model
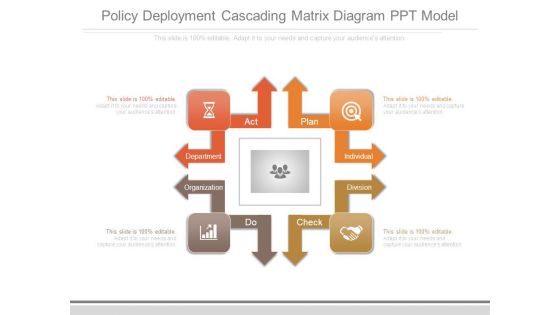
This is a policy deployment cascading matrix diagram ppt model. This is a four stage process. The stages in this process are department, organization, do, check, division, individual, plan, act.
Mechanics Finance Progress Diagram Powerpoint Slide Templates Download
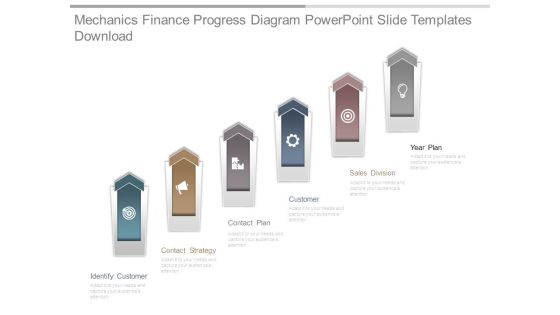
This is a mechanics finance progress diagram powerpoint slide templates download. This is a six stage process. The stages in this process are identify customer, contact strategy, contact plan, customer, sales division, year plan.

Seismic Analysis Ppt Layout Presentation Graphics
This is a seismic analysis ppt layout presentation graphics. This is a four stage process. The stages in this process are statistical forecast, current seismicity stage, seismic zonation, division of seismic period.

Concept Of Revenue Management Ppt Powerpoint Images
This is a concept of revenue management ppt powerpoint images. This is a five stage process. The stages in this process are revenue by division, chart title, total revenue completed target, product, consulting, trading.

Launch Team Structure And Rules Ppt PowerPoint Presentation Portfolio
This is a launch team structure and rules ppt powerpoint presentation portfolio. This is a two stage process. The stages in this process are division chief, manager, communication and brand, product marketing.

Hr Dashboard Ppt PowerPoint Presentation Shapes
This is a hr dashboard ppt powerpoint presentation shapes. This is a four stage process. The stages in this process are total employees, key metrics, employee churn, open positions by divisions.
Hr Dashboard Template 2 Ppt PowerPoint Presentation Microsoft
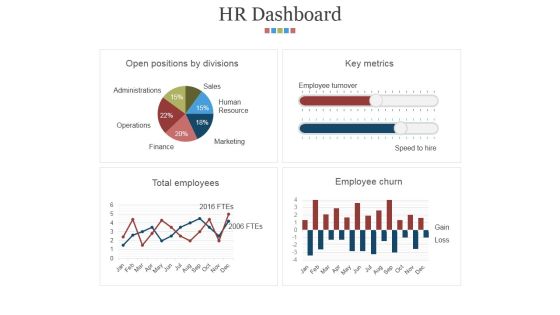
This is a hr dashboard template 2 ppt powerpoint presentation microsoft. This is a four stage process. The stages in this process are open positions by divisions, key metrics, total employees, employee churn.
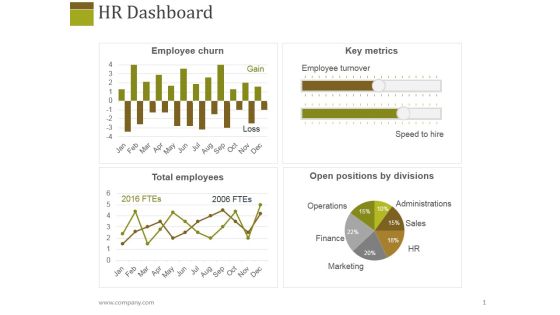
Hr Dashboard Template 1 Ppt PowerPoint Presentation Layouts Slideshow
This is a hr dashboard template 1 ppt powerpoint presentation layouts slideshow. This is a four stage process. The stages in this process are employee churn, key metrics, total employees, open positions by divisions.
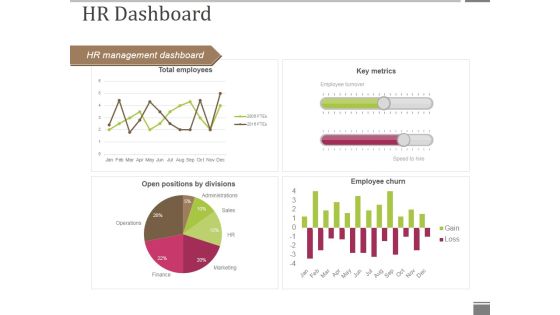
Hr Dashboard Template 1 Ppt PowerPoint Presentation Infographic Template Format Ideas
This is a hr dashboard template 1 ppt powerpoint presentation infographic template format ideas. This is a four stage process. The stages in this process are hr management dashboard, key metrics, employee churn, open positions by divisions, total employees.

Task Distribution Ppt PowerPoint Presentation Design Ideas
This is a task distribution ppt powerpoint presentation design ideas. This is a eight stage process. The stages in this process are outside service providers, research and development, product, divisions, percentage.
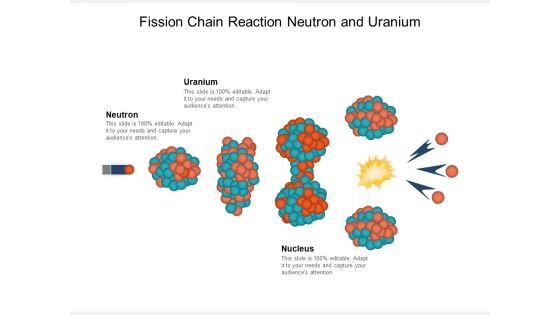
Fission Chain Reaction Neutron And Uranium Ppt PowerPoint Presentation Inspiration Show
This is a fission chain reaction neutron and uranium ppt powerpoint presentation inspiration show. This is a three stage process. The stages in this process are division, fission, parting.

Nuclear Fission And Nuclear Fusion Reactions Ppt PowerPoint Presentation Pictures Gridlines
This is a nuclear fission and nuclear fusion reactions ppt powerpoint presentation pictures gridlines. This is a two stage process. The stages in this process are division, fission, parting.

Nuclear Fission Chain Reaction Neutron And Fission Product Ppt PowerPoint Presentation Layouts Visuals
This is a nuclear fission chain reaction neutron and fission product ppt powerpoint presentation layouts visuals. This is a seven stage process. The stages in this process are division, fission, parting.

Schematic Nuclear Fission Chain Reaction Ppt PowerPoint Presentation Portfolio Slide Portrait
This is a schematic nuclear fission chain reaction ppt powerpoint presentation portfolio slide portrait. This is a five stage process. The stages in this process are division, fission, parting.

Pie Chart Infographic Diagram Powerpoint Templates
This Power Point template has been designed with pie chart infographic. This business slide is useful to present financial ratio analysis. Use this diagram to make business presentation. Illustrate these thoughts with this slide.

Circular Infographic Of Financial Measurement Steps Powerpoint Template
Use this diagram for display of financial measurement steps. This PPT slide contains diagram of circular infographic. This PowerPoint Template has been designed to portray your concepts in visual manner.
Four Steps Business Circle With Icons Powerpoint Template
Develop competitive advantage with our above template which contains four steps circle diagram with icons. This diagram may use to depict strategic management process. This slide provides an effective way of displaying information.
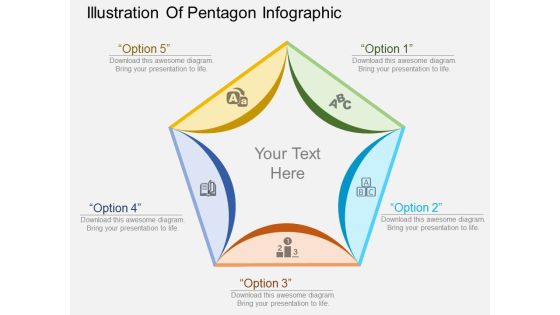
Illustration Of Pentagon Infographic Powerpoint Template
Our above business slide contains pentagon infographic. This PowerPoint template can be used to display the relationship and analysis. Capture the attention of your audience with this slide.

Circle Of Six Business Options Powerpoint Templates
This PowerPoint template has been designed with circle of six business options. This circular infographic contains the concept of target achievement. Add this slide to your presentation and impress your audiences.
Pentagon Inside Circle With Icons Powerpoint Templates
This business slide displays pentagon graphics with icons. This diagram is useful for planning process. This PPT slide helps in cross-functional planning and fully examine potential competitive strategies

Six Steps Circular Chart For Workflow Powerpoint Slides
This business slide contains circular infographic design. This diagram provides schematic representation of any information. Visual effect this slide helps in maintaining the flow of the discussion and provides more clarity to the subject.

Circle Infographics For Visual Representation Powerpoint Template
This business slide provides background for four option display. Display the options, business steps or workflow using this diagram as a tool. You can present your opinions using this impressive slide.
Flow Of Six Circular Icons Powerpoint Template
Our PowerPoint template has been designed with circular infographic diagram. This business diagram may be used to display process flow. Grab centre stage with this slide and attract the attention of your audience.
Six Staged Business Chart With Icons Powerpoint Template
Our professionally designed business diagram is as an effective tool for communicating ideas and planning. It contains circular business chart with icons. Convey your views with this diagram slide. It will amplify the strength of your logic.
Pie Chart With Seven Business Icons Powerpoint Templates
Our compelling template consists with a design of pie chart with seven business icons. This slide has been professionally designed to exhibit financial ratio analysis. This template offers an excellent background to build impressive presentation.

Circular Diagram For Management Development Process Powerpoint Template
This PowerPoint template has been designed with hexagonal circular diagram. Download this slide design for management development processes. Enlighten others on the process with this innovative PowerPoint template.

Circle With Team And Business Icons Powerpoint Slides
This PowerPoint template contains four steps circular diagram with business icons. It also contains team icon in center. You may download this PPT slide to display team strategy and planning steps.

Circular Diagram Of Planning Process Powerpoint Slides
This PowerPoint slide contains graphics of circular diagram. This slide contains four steps with icons in circular flow. Enlighten your viewers on the process with this innovative graphic.

Circular Diagram With Three Sides Powerpoint Slides
This PowerPoint slide has been designed with graphics of circular diagram. This slide contains four steps with icons in circular flow. Enlighten your viewers on the process with this innovative graphic.

Circular Infographic Design For Process Flow Powerpoint Slides
This PowerPoint slide has been designed with graphics of circular diagram. This slide contains four steps with icons in circular flow. Enlighten your viewers on the process with this innovative graphic.

 Home
Home