AI PPT Maker
Templates
PPT Bundles
Design Services
Business PPTs
Business Plan
Management
Strategy
Introduction PPT
Roadmap
Self Introduction
Timelines
Process
Marketing
Agenda
Technology
Medical
Startup Business Plan
Cyber Security
Dashboards
SWOT
Proposals
Education
Pitch Deck
Digital Marketing
KPIs
Project Management
Product Management
Artificial Intelligence
Target Market
Communication
Supply Chain
Google Slides
Research Services
 One Pagers
All Categories
-
Home
- Customer Favorites
- Design Flow
Design Flow

PowerPoint Backgrounds Process Vision Ppt Themes
PowerPoint Backgrounds Process Vision PPT Themes-Explore the various directions and layers existing in your in your plans and processes. Unravel the desired and essential elements of your overall strategy. Explain the relevance of the different layers and stages and directions in getting down to your core competence, ability and desired result.-Achievement, Analysis, Background, Brainstorm, Brand, Business, Chart, Commerce, Communication, Conceptual, Diagram, Executive, Financial, Formula, Goal, Guide, Idea, Innovation, Management, Market, Marketing,
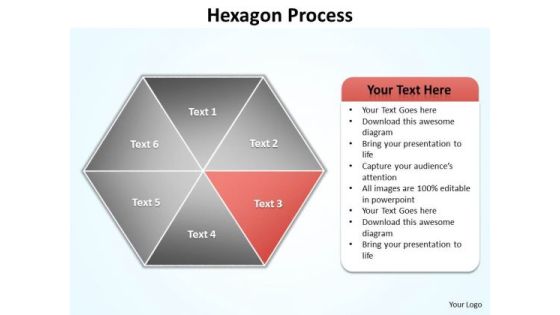
Ppt Orange Factor Regular Hexagon Diagram Editable PowerPoint Templates
PPT orange factor regular hexagon diagram editable PowerPoint templates-Use this graphics to organize major factors like business methods, relevant inputs, business association and networking, quality services that will ascertain the height of achievement and can lead to success.-PPT orange factor regular hexagon diagram editable PowerPoint templates-attached, backgrounds, blue, cell, color, component, connect, connection, diagram, elements, geometric, graphic, group, hexagon, honeycomb, icon, illustration, intricacy, lines, link, map, mesh, model, network, science, shape, shiny, strategy, structure, symbol, teamwork, technology
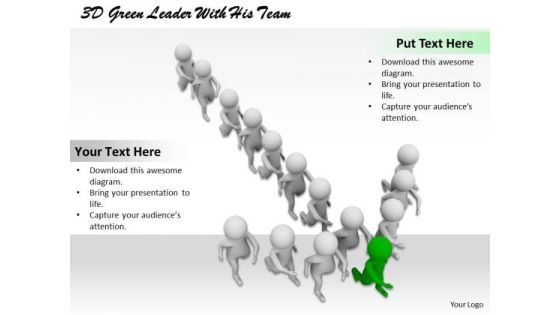
Business Integration Strategy 3d Green Leader With His Team Character Models
Document Your Views On Our Business Integration Strategy 3d Green Leader With His Team Character Models Powerpoint Templates. They Will Create A Strong Impression. Plan Your Documentary Shot By Shot. Break Them Down On Our leadership Powerpoint Templates.
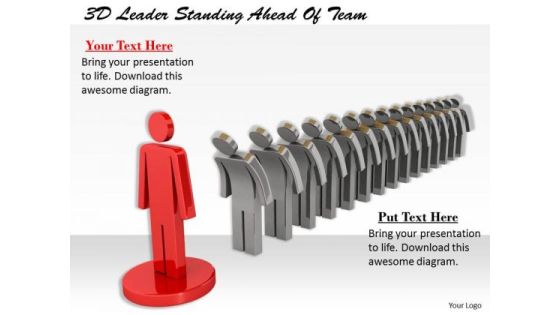
Business Strategy Consultant 3d Leader Standing Ahead Of Team Character Modeling
Dominate Proceedings With Your Ideas. Our Business Strategy Consultant 3d Leader Standing Ahead Of Team Character Modeling Powerpoint Templates Will Empower Your Thoughts. Our people Powerpoint Templates Have A Domino Effect. Your Ideas Will Generate One After Another.

Stock Photo Business Strategy Model 3d Graphic Of House With Red Roof Images
Delight Them With Our Stock Photo Business Strategy Model 3d Graphic Of House With Red Roof Images Powerpoint Templates. Your Audience Will Be Ecstatic. Our business Powerpoint Templates Are Created Cost Effective. They Understand The Need For Economy.

Business Diagram Kaizen Event Process PowerPoint Ppt Presentation
This business slide displays framework of kaizen event process. It contains graphics of arrow with five points depicting plan process, train process walk, root cause analysis, improve process and sustain process. Download this diagram as a tool for business presentations.

Business Diagram Key Performance Indicators Customer Service PowerPoint Ppt Presentation
Our above diagram provides framework of key performance indicators for customer service. It contains circular diagram in four segments depicting concepts of delivery problems, customer care training. Download this diagram to make professional presentations on customer service.

Ppt Pink Factor Hexagon Cause And Effect Diagram PowerPoint Template Editable Templates
PPT pink factor hexagon cause and effect diagram PowerPoint template editable Templates-The Diagram offers an excellent background to build up the various stages of your business process. This PowerPoint Process Chart shows the seven Different Layers which are to be followed in any business. This Business Diagram can be used in Marketing, Banking, and Management etc. -PPT pink factor hexagon cause and effect diagram PowerPoint template editable Templates-attached, backgrounds, blue, cell, color, component, connect, connection, diagram, elements, geometric, graphic, group, hexagon, honeycomb, icon, illustration, intricacy, lines, link, map, mesh, model, network, science, shape, shiny, strategy, structure, symbol, teamwork, technology

Business Diagram Root Cause Failure PowerPoint Ppt Presentation
This diagram provides framework for root cause failure. It contains fish bone diagram. The purpose of root cause analysis is to strike at the root of a problem by finding and resolving its root causes. This template helps you to grab the attention of your listener.
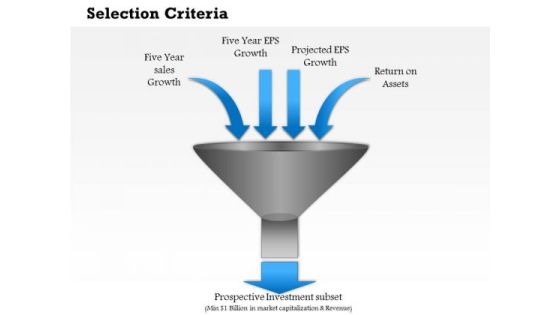
Business Diagram Selection Criteria PowerPoint Ppt Presentation
This slide displays framework for selection criteria. This diagram contains funnel diagram with four inward arrows representing five year sales growth, five year EPS growth, projected EPS growth and return on assets. You can use this funnel diagram in business and sales related presentations.

Ppt Consecutive Hexagonal Text Boxes PowerPoint Background 4 State Diagram Templates
PPT consecutive hexagonal text boxes powerpoint background 4 state diagram Templates-Develop competitive advantage with our above template which contains a diagram of four hexagons. This PowerPoint diagram slide shows four parts in an idea. You can use it to depict a list. You can edit the colors of hexagons. -PPT consecutive hexagonal text boxes powerpoint background 4 state diagram Templates-3d, Appointment, Box, Calendar, Cell, Cellular, Color, Diary, Due, Engagement, Event, Everyday, Figure, Grid, Hexagon, Letters, Memo, Message, Note, Order, Organizer, Schedule, Seasonal, Second, Structure, Symbol, System, Text

Construction Engineering And Industrial Facility Management Contract And Workflow Management Ideas PDF
Presenting construction engineering and industrial facility management contract and workflow management ideas pdf to provide visual cues and insights. Share and navigate important information on three stages that need your due attention. This template can be used to pitch topics like key components of contract management, contract lifecycle management, workflow management process flow. In addtion, this PPT design contains high resolution images, graphics, etc, that are easily editable and available for immediate download.

Circular Gear Process Infographics Diagram Powerpoint Template
This business slide contains circular infographic design. This diagram may be used for developing a marketing strategy. Visual effect this slide helps in maintaining the flow of the discussion and provides more clarity to the subject.
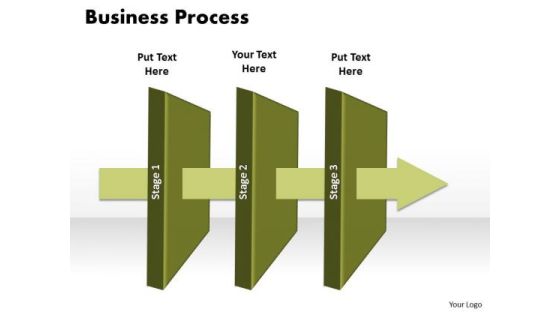
Ppt 3 State Diagram Business PowerPoint Presentation Linear Process Templates
PPT 3 state diagram business powerpoint presentation linear process Templates-Use this PowerPoint Diagram to represent the layers of Linear Process model Graphically. It shows the three stages in an animated manner through an Arrow. You can change color, size and orientation of any icon to your liking.-PPT 3 state diagram business powerpoint presentation linear process Templates-3d, Air, Arrow, Art, Business, Chart, Clip, Clipart, Cooling, Diagram, Drip, Drop, Dry, Energy, Eps10, Evaporate, Evaporating, Evaporation, Graphic, Heat, Icon, Illustration, Isolated, Isometric, Layers, Material, Moisture, Process
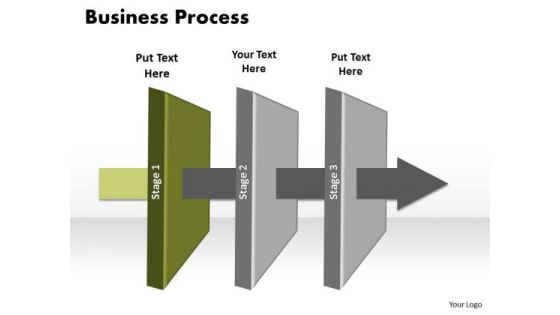
Ppt Layer 1 Business Linear Forging Process PowerPoint Slides Templates
PPT layer 1 business linear forging process powerpoint slides Templates-Use this PowerPoint Diagram to represent the layers of Linear Process model Graphically. It shows the first stage in an animated manner through an Arrow. You can change color, size and orientation of any icon to your liking.-PPT layer 1 business linear forging process powerpoint slides Templates-3d, Air, Arrow, Art, Business, Chart, Clip, Clipart, Cooling, Diagram, Drip, Drop, Dry, Energy, Eps10, Evaporate, Evaporating, Evaporation, Graphic, Heat, Icon, Illustration, Isolated, Isometric, Layers, Material, Moisture, Process
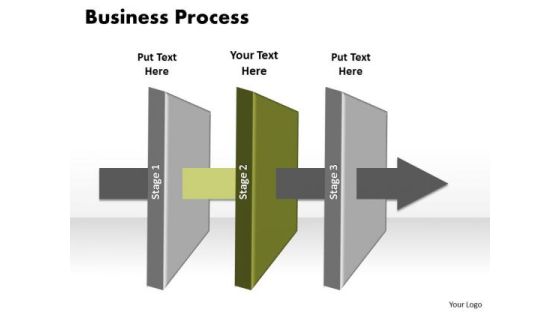
Ppt Layer 2 World Business Sample Presentation PowerPoint Linear Process Templates
PPT layer 2 world business sample presentation powerpoint linear process Templates-Use this PowerPoint Diagram to represent the layers of Linear Process model Graphically. It shows the second stage in an animated manner through an Arrow. You can change color, size and orientation of any icon to your liking.-PPT layer 2 world business sample presentation powerpoint linear process Templates-3d, Air, Arrow, Art, Business, Chart, Clip, Clipart, Cooling, Diagram, Drip, Drop, Dry, Energy, Eps10, Evaporate, Evaporating, Evaporation, Graphic, Heat, Icon, Illustration, Isolated, Isometric, Layers, Material, Moisture, Process
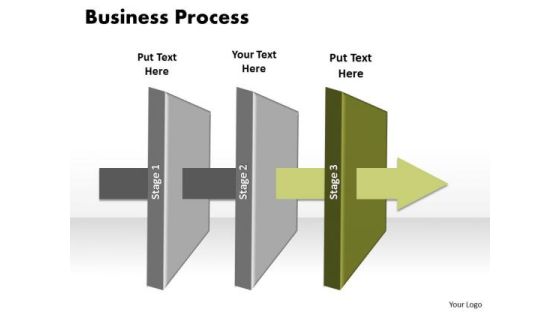
Ppt Layer 3 Free Business PowerPoint Slide Text Linear Process Templates
PPT layer 3 free business powerpoint slide text linear process Templates-Use this PowerPoint Diagram to represent the layers of Linear Process model Graphically. It shows the third stage in an animated manner through an Arrow. You can change color, size and orientation of any icon to your liking.-PPT layer 3 free business powerpoint slide text linear process Templates-3d, Air, Arrow, Art, Business, Chart, Clip, Clipart, Cooling, Diagram, Drip, Drop, Dry, Energy, Eps10, Evaporate, Evaporating, Evaporation, Graphic, Heat, Icon, Illustration, Isolated, Isometric, Layers, Material, Moisture, Process

Ppt 6 Factors Hexagon Angles Free Fishbone Diagram PowerPoint Template Editable Templates
PPT 6 factors hexagon angles free fishbone diagram PowerPoint template editable Templates-Visually support your Microsoft office PPT Presentation with our above Diagram illustrating six factors combined in the form of Hexagon. This image identifies the concept of Inter-related issues to be explained together. Adjust the above image in your PPT presentations to visually support your content in your Business PPT slideshows -PPT 6 factors hexagon angles free fishbone diagram PowerPoint template editable Templates-attached, backgrounds, blue, cell, color, component, connect, connection, diagram, elements, geometric, graphic, group, hexagon, honeycomb, icon, illustration, intricacy, lines, link, map, mesh, model, network, science, shape, shiny, strategy, structure, symbol, teamwork, technology
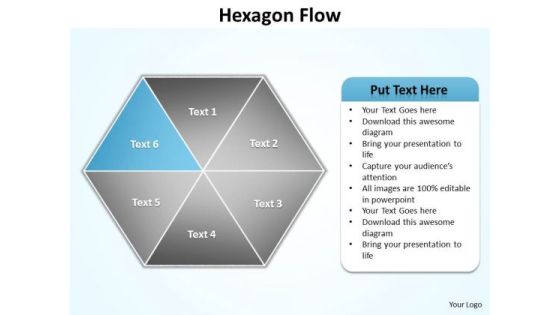
Ppt Blue Factor Hexagon Angles Spider Diagram PowerPoint Template Editable Templates
PPT blue factor hexagon angles spider diagram PowerPoint template editable Templates-You can easily collaborate this PowerPoint diagram with colleagues to create detailed process diagrams and use them as a key element in streamlining your processes. Use this graphical approach to represent global business issues such as financial data, stock market Exchange, increase in sales, corporate presentations and more. -PPT blue factor hexagon angles spider diagram PowerPoint template editable Templates-attached, backgrounds, blue, cell, color, component, connect, connection, diagram, elements, geometric, graphic, group, hexagon, honeycomb, icon, illustration, intricacy, lines, link, map, mesh, model, network, science, shape, shiny, strategy, structure, symbol, teamwork, technology

Ppt Green Factor Area Of Hexagon Network Diagram PowerPoint Template Editable Templates
PPT green factor area of hexagon network diagram PowerPoint template editable Templates-Adjust the above image into your Presentations to visually support your contents for Business slideshows. This Diagram Imitates the concept of Hexagonal Process using the green factor .Create captivating presentations to deliver comparative and weighted arguments.-PPT green factor area of hexagon network diagram PowerPoint template editable Templates-attached, backgrounds, blue, cell, color, component, connect, connection, diagram, elements, geometric, graphic, group, hexagon, honeycomb, icon, illustration, intricacy, lines, link, map, mesh, model, network, science, shape, shiny, strategy, structure, symbol, teamwork, technology
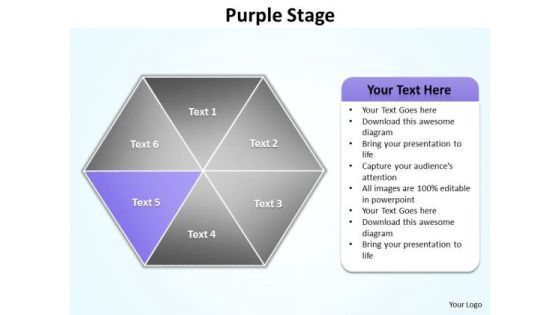
Ppt Purple Factor Hexagon Diagram PowerPoint Free Editable Maps Templates
PPT purple factor hexagon diagram PowerPoint free editable maps Templates-Use this Astonishing PowerPoint Diagram to abstract the different phases of a single Hexagonal procedure. It symbolizes forever and ever, interminable, looped, no end of, no end to, on a treadmill, perpetual, prolonged, regular etc. It explains its Purple Component.-PPT purple factor hexagon diagram PowerPoint free editable maps Templates-attached, backgrounds, blue, cell, color, component, connect, connection, diagram, elements, geometric, graphic, group, hexagon, honeycomb, icon, illustration, intricacy, lines, link, map, mesh, model, network, science, shape, shiny, strategy, structure, symbol, teamwork, technology

Industry Analysis Of Real Estate And Construction Sector Real Estate Performance Parameters Inspiration PDF
Presenting industry analysis of real estate and construction sector real estate performance parameters inspiration pdf to provide visual cues and insights. Share and navigate important information on five stages that need your due attention. This template can be used to pitch topics like costs, budget, economic, cash flow. In addtion, this PPT design contains high resolution images, graphics, etc, that are easily editable and available for immediate download.

Circle Infographics For Financial Analysis Powerpoint Template
This business slide contains circular infographic design. This diagram may be used to depict financial process analysis. Visual effect this slide helps in maintaining the flow of the discussion and provides more clarity to the subject.

Construction Management Services And Action Plan Contract And Workflow Management Portrait PDF
Presenting construction management services and action plan contract and workflow management portrait pdf to provide visual cues and insights. Share and navigate important information on three stages that need your due attention. This template can be used to pitch topics like key components of contract management, contract lifecycle management, workflow management process flow. In addtion, this PPT design contains high resolution images, graphics, etc, that are easily editable and available for immediate download.
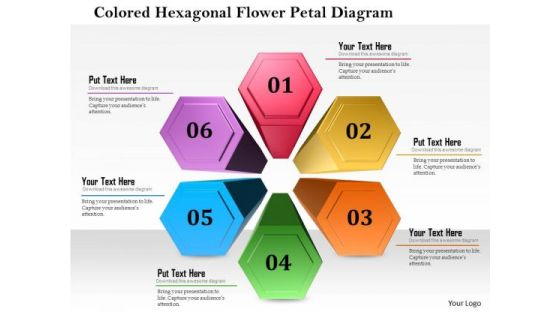
Business Diagram Colored Hexagon Flower Petal Diagram Presentation Template
This business diagram displays colored hexagon flower petal design. This Power Point slide can be used for data representation. Use this PPT slide to show flow of activities in circular manner. Get professional with this exclusive business slide.

Colorful Infographics For Corporate Financing Powerpoint Template
This business slide contains five steps circular infographic design. This diagram provides schematic representation of any information. Visual effect this slide helps in maintaining the flow of the discussion and provides more clarity to the subject.

Circular Alphabetic Steps For Educational Strategy Powerpoint Slides
This business slide contains circular infographic design. This diagram provides schematic representation of any information. Visual effect this slide helps in maintaining the flow of the discussion and provides more clarity to the subject.

Circular Banners With Business Icons Powerpoint Slides
This business slide contains circular infographic design. This diagram provides schematic representation of any information. Visual effect this slide helps in maintaining the flow of the discussion and provides more clarity to the subject.

Circular Petal Chart With Icons Powerpoint Slides
This business slide contains circular infographic design. This diagram provides schematic representation of any information. Visual effect this slide helps in maintaining the flow of the discussion and provides more clarity to the subject.

Eight Steps Circle Infographic Chart Powerpoint Slides
This business slide contains circular infographic design. This diagram provides schematic representation of any information. Visual effect this slide helps in maintaining the flow of the discussion and provides more clarity to the subject.
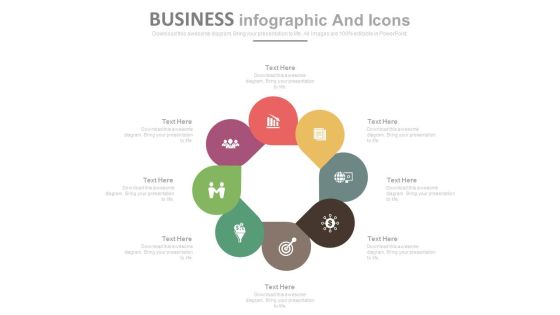
Eight Steps Circular Business Infographics Powerpoint Slides
This business slide contains circular infographic design. This diagram provides schematic representation of any information. Visual effect this slide helps in maintaining the flow of the discussion and provides more clarity to the subject.

Six Steps Circular Chart For Workflow Powerpoint Slides
This business slide contains circular infographic design. This diagram provides schematic representation of any information. Visual effect this slide helps in maintaining the flow of the discussion and provides more clarity to the subject.

Six Steps Circular Puzzle Timeline Chart Powerpoint Slides
This business slide contains circular infographic design. This diagram provides schematic representation of any information. Visual effect this slide helps in maintaining the flow of the discussion and provides more clarity to the subject.

Circle Infographics Developing A Marketing Strategy Powerpoint Template
This business slide contains circular infographic design. This diagram may be used for developing a marketing strategy. Visual effect this slide helps in maintaining the flow of the discussion and provides more clarity to the subject.

Real Estate Property Management System Real Estate Performance Parameters Ppt Summary Objects PDF
Presenting real estate property management system real estate performance parameters ppt summary objects pdf to provide visual cues and insights. Share and navigate important information on five stages that need your due attention. This template can be used to pitch topics like costs, budget, economic, cash flow. In addtion, this PPT design contains high resolution images, graphics, etc, that are easily editable and available for immediate download.
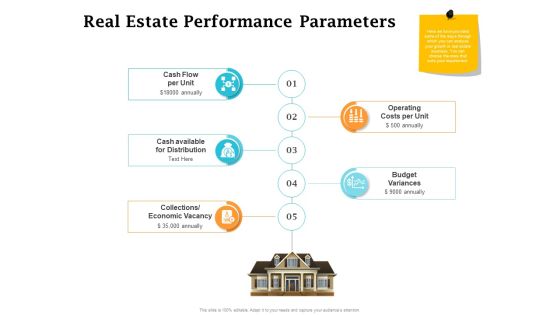
Real Estate Asset Management Real Estate Performance Parameters Ppt File Layout Ideas PDF
Presenting real estate asset management real estate performance parameters ppt file layout ideas pdf to provide visual cues and insights. Share and navigate important information on five stages that need your due attention. This template can be used to pitch topics like costs, budget, economic, cash flow. In addtion, this PPT design contains high resolution images, graphics, etc, that are easily editable and available for immediate download.
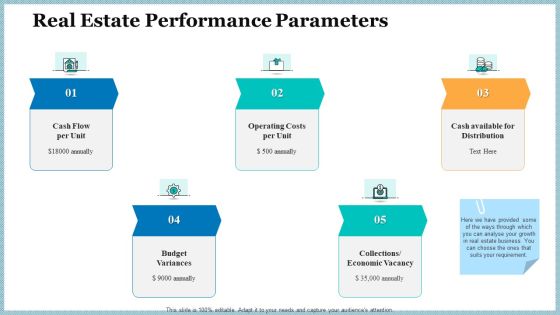
Real Property Strategic Plan Real Estate Performance Parameters Ppt Ideas Background PDF
Presenting real property strategic plan real estate performance parameters ppt ideas background pdf to provide visual cues and insights. Share and navigate important information on five stages that need your due attention. This template can be used to pitch topics like costs, budget, economic, cash flow. In addtion, this PPT design contains high resolution images, graphics, etc, that are easily editable and available for immediate download.

Market Research Analysis Of Housing Sector Real Estate Performance Parameters Summary PDF
Presenting market research analysis of housing sector real estate performance parameters summary pdf to provide visual cues and insights. Share and navigate important information on five stages that need your due attention. This template can be used to pitch topics like costs, budget, economic, cash flow. In addtion, this PPT design contains high resolution images, graphics, etc, that are easily editable and available for immediate download.
Tactical Merger M And A Performance Tracker Ppt Summary Inspiration PDF
Presenting tactical merger m and a performance tracker ppt summary inspiration pdf to provide visual cues and insights. Share and navigate important information on five stages that need your due attention. This template can be used to pitch topics like shareholder value, production capacity, cash flow. In addition, this PPT design contains high-resolution images, graphics, etc, that are easily editable and available for immediate download.
United States Real Estate Industry Real Estate Performance Parameters Ppt Professional Icons PDF
Presenting united states real estate industry real estate performance parameters ppt professional icons pdf to provide visual cues and insights. Share and navigate important information on five stages that need your due attention. This template can be used to pitch topics like costs, budget, economic, cash flow. In addtion, this PPT design contains high resolution images, graphics, etc, that are easily editable and available for immediate download.

Commercial Property Administration And Advancement Real Estate Performance Parameters Mockup PDF
Presenting commercial property administration and advancement real estate performance parameters mockup pdf to provide visual cues and insights. Share and navigate important information on five stages that need your due attention. This template can be used to pitch topics like costs, budget, economic, cash flow. In addtion, this PPT design contains high resolution images, graphics, etc, that are easily editable and available for immediate download.

Table Of Contents For ISO 9001Certification Procedure System Template PDF
Presenting Table Of Contents For ISO 9001Certification Procedure System Template PDF to provide visual cues and insights. Share and navigate important information on one stages that need your due attention. This template can be used to pitch topics like Quality Management Principles, Auditable Requirements, Software Process Flow. In addtion, this PPT design contains high resolution images, graphics, etc, that are easily editable and available for immediate download.
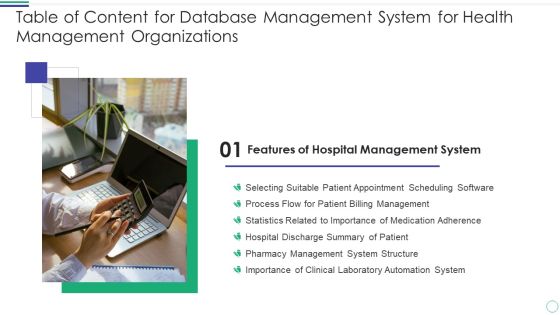
Table Of Content For Database Management System For Health Management Organizations Sample PDF
Presenting Table Of Content For Database Management System For Health Management Organizations Sample PDF to provide visual cues and insights. Share and navigate important information on one stage that need your due attention. This template can be used to pitch topics like Hospital Management, Selecting Suitable, Process Flow. In addtion, this PPT design contains high resolution images, graphics, etc, that are easily editable and available for immediate download.
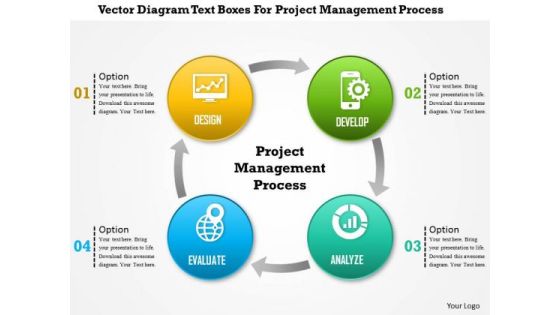
Business Diagram Vector Diagram Text Boxes For Project Management Process Presentation Template
This business diagram has been designed with four staged infographic. This four stages are design develop, evaluate and analyze. Use this diagram to present your views in a wonderful manner.
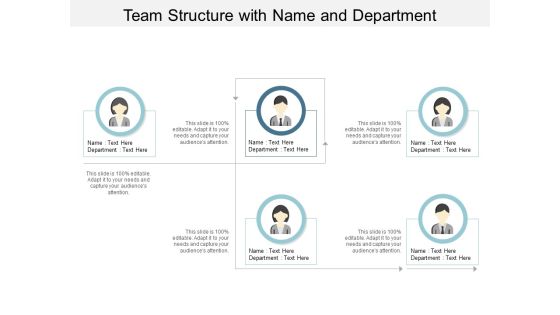
Team Structure With Name And Department Ppt PowerPoint Presentation File Professional
This is a team structure with name and department ppt powerpoint presentation file professional. This is a five stage process. The stages in this process are flow chart, org chart, hierarchy chart.

3d Linear Abstraction To Prevent Business Losses Seven Steps Flowcharting PowerPoint Templates
We present our 3d linear abstraction to prevent business losses seven steps flowcharting PowerPoint templates.Use our Advertising PowerPoint Templates because,It shows you the vision of a desired destination and the best road to take to reach that goal. Use our Circle Charts PowerPoint Templates because,Our PowerPoint templates give this step by step process to acheive the aim. Use our Arrows PowerPoint Templates because, this slide can help to bullet point your views. Use our Business PowerPoint Templates because, The majestic Tiger lord of all it surveys.It exudes power even when it is in repose Use our Shapes PowerPoint Templates because,You have the process in your head, our template design showing will illuminate your thoughts.Use these PowerPoint slides for presentations relating to Advertising, arrow, background, banner, bookmark, card, choice, concept, creative, design, direction, flow, idea, illustration, infographic, instruction, label, layout, manual, marketing, modern, next, number, offer, options, order, paper, process, product, promotion, sequence, simple, step, symbol, template, triangle, tutorial, vector, version, web. The prominent colors used in the PowerPoint template are Green, Gray, White
Eight Column Chart For Business Operating Income Ppt PowerPoint Presentation Icon Backgrounds PDF
Showcasing this set of slides titled eight column chart for business operating income ppt powerpoint presentation icon backgrounds pdf. The topics addressed in these templates are operating income, operating expenses, free cash flow. All the content presented in this PPT design is completely editable. Download it and make adjustments in colour, background, font etc. as per your unique business setting.
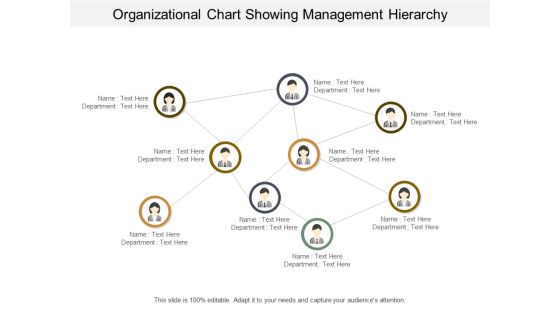
Organizational Chart Showing Management Hierarchy Ppt PowerPoint Presentation Visual Aids Infographics
This is a organizational chart showing management hierarchy ppt powerpoint presentation visual aids infographics. This is a nine stage process. The stages in this process are flow chart, org chart, hierarchy chart.
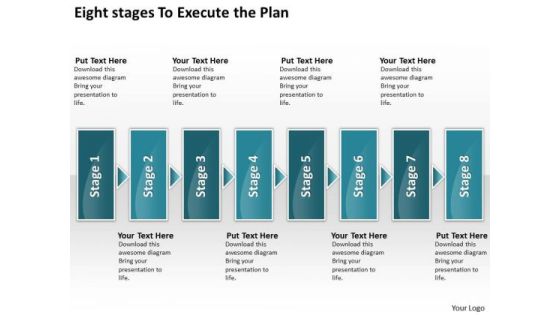
Eight Stages To Execute The Plan Diagram Of Business PowerPoint Templates
We present our eight stages to execute the plan diagram of business PowerPoint templates.Download and present our Arrows PowerPoint Templates because this diagram helps you to harness the opportunities, celebrate your performance till date and focus on greater growth and expansion in coming years. Download our Success PowerPoint Templates because your quest has taken you well onto the path of success. Use our Marketing PowerPoint Templates because customer satisfaction is a mantra of the marketplace. Building a loyal client base is an essential element of your business. Download our Advertising PowerPoint Templates because to achieve sureshot success you need to come together at the right time, place and manner. Present our Business PowerPoint Templates because your marketing strategies can funnel down to the cone, stage by stage, refining as you go along.Use these PowerPoint slides for presentations relating to Arrow, Chart, Concept, Connection, Diagram, Direction, Duplicate, Flow, Four, Manage, Method, Order, Phase, Presentation, Procedure, Process, React, Recycle, Refresh, Relate, Repeat, Repetition, Report, Review, Ring, Rotation, Round, Section, Sequence, Simple, Stage, Step, Strategy, Success. The prominent colors used in the PowerPoint template are Green, Green dark , Black. Customers tell us our eight stages to execute the plan diagram of business PowerPoint templates are Spectacular. The feedback we get is that our Connection PowerPoint templates and PPT Slides are Splendid. Professionals tell us our eight stages to execute the plan diagram of business PowerPoint templates are designed by a team of presentation professionals. People tell us our Flow PowerPoint templates and PPT Slides are aesthetically designed to attract attention. We guarantee that they will grab all the eyeballs you need. Customers tell us our eight stages to execute the plan diagram of business PowerPoint templates will impress their bosses and teams. Professionals tell us our Direction PowerPoint templates and PPT Slides are Graceful.
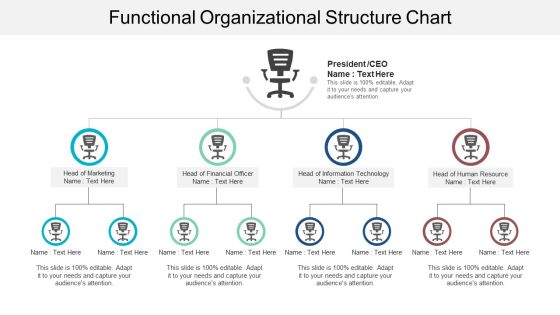
Functional Organizational Structure Chart Ppt PowerPoint Presentation Pictures Diagrams
This is a functional organizational structure chart ppt powerpoint presentation pictures diagrams. This is a four stage process. The stages in this process are flow chart, org chart, hierarchy chart.
Organizational Chart Vector Icon Ppt PowerPoint Presentation Inspiration Visuals
This is a organizational chart vector icon ppt powerpoint presentation inspiration visuals. This is a six stage process. The stages in this process are flow chart, org chart, hierarchy chart.

Hierarchical Organizational Chart With Names And Departments Ppt PowerPoint Presentation Infographics Background
This is a hierarchical organizational chart with names and departments ppt powerpoint presentation infographics background. This is a three stage process. The stages in this process are flow chart, org chart, hierarchy chart.

Business Team Reporting Structure Powerpoint Slides
This PowerPoint template contains flow chart with team pictures. Download this PPT slide to display reporting structure of business team. Transmit your thoughts via this slide and prod your team to action.

PowerPoint Themes Chains Flowchart Process Company Ppt Slide
PowerPoint Themes Chains Flowchart Process Company PPT Slide-This is a very simple Chain Flow Chart Diagram. It can be used to express ideas, logical chains, or organizational hierarchies.-PowerPoint Themes Chains Flowchart Process Company PPT Slide

Lead Generation Activities Powerpoint Slide Images
This is a lead generation activities powerpoint slide images. This is a seven stage process. The stages in this process are business, strategy, social, flow chart, organization chart, lead generation.

Activity Network Diagram Ppt PowerPoint Presentation Deck
This is a activity network diagram ppt powerpoint presentation deck. This is a five stage process. The stages in this process are business, strategy, analysis, marketing, hexagon, flow process.
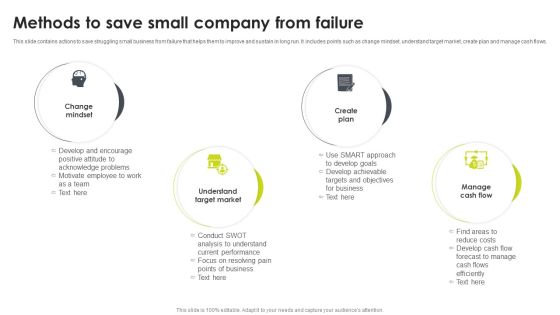
Methods To Save Small Company From Failure Diagrams PDF
This slide contains actions to save struggling small business from failure that helps them to improve and sustain in long run. It includes points such as change mindset, understand target market, create plan and manage cash flows. Persuade your audience using this Methods To Save Small Company From Failure Diagrams PDF. This PPT design covers four stages, thus making it a great tool to use. It also caters to a variety of topics including Understand Target Market, Create Plan, Manage Cash Flow. Download this PPT design now to present a convincing pitch that not only emphasizes the topic but also showcases your presentation skills.

Mitigation Plan For Setting Up Startup Small Business Elements PDF
The following slide showcases small business challenges that new entrepreneurs have to deal with. It presents information related to capital requirement, adequate amount of cash flow, increasing customer base, etc. Persuade your audience using this Mitigation Plan For Setting Up Startup Small Business Elements PDF. This PPT design covers four stages, thus making it a great tool to use. It also caters to a variety of topics including Capital, Right Business, Cash Flow. Download this PPT design now to present a convincing pitch that not only emphasizes the topic but also showcases your presentation skills.

Business Development Multi Level Organization Hierarchy Ppt PowerPoint Presentation Pictures
This is a business development multi level organization hierarchy ppt powerpoint presentation pictures. This is a three stage process. The stages in this process are business, strategy, flow process, management, marketing.

Yearly Company Financial Performance Indicators Of Organization Ppt Infographics Outline PDF
This slide showcases to past years values of organization for future prediction. Key metrics covered are revenue, net profit, cash flow, sales and EBITDA. Persuade your audience using this Yearly Company Financial Performance Indicators Of Organization Ppt Infographics Outline PDF. This PPT design covers five stages, thus making it a great tool to use. It also caters to a variety of topics including Revenue, Net Profit, Cash Flow. Download this PPT design now to present a convincing pitch that not only emphasizes the topic but also showcases your presentation skills.
