Delivery Plan

Red Green Teams Comparison Chart Powerpoint Slides
This PPT slide displays graphics of two red and green teams. Use this PPT design to display comparison of teams performances. This PowerPoint template can be customized as per requirements of business education or any other theme.
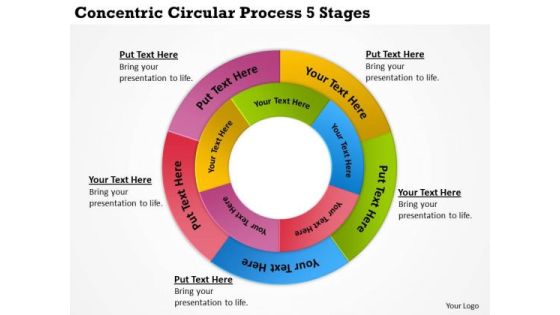
Diagram Of Business Cycle Concentric Circular Process 5 Stages PowerPoint Templates
We present our diagram of business cycle concentric circular process 5 stages PowerPoint templates.Download and present our Symbol PowerPoint Templates because They will Put your wonderful verbal artistry on display. Our PowerPoint Templates and Slides will provide you the necessary glam and glitter. Download and present our Business PowerPoint Templates because Our PowerPoint Templates and Slides will give you great value for your money. Be assured of finding the best projection to highlight your words. Download and present our Shapes PowerPoint Templates because Our PowerPoint Templates and Slides will let you Hit the right notes. Watch your audience start singing to your tune. Use our Circle Charts PowerPoint Templates because You can Stir your ideas in the cauldron of our PowerPoint Templates and Slides. Cast a magic spell on your audience. Use our Process and Flows PowerPoint Templates because Our PowerPoint Templates and Slides ensures Effective communication. They help you put across your views with precision and clarity.Use these PowerPoint slides for presentations relating to Abstract, Access, Background, Banner, Blue, Bright, Business, Chart, Circle, Color, Colorful, Concept, Conceptual, Connection, Corporate, Creative, Cycle, Design, Different, Element, Empty, Form, Frame, Graphic, Green, Group, Idea, Illustration, Match, Message, Order, Part, Piece, Place, Process, Red, Shape, Solution, Special, Speech, Strategy, Symbol, Template, Text, Usable, Vector. The prominent colors used in the PowerPoint template are Green, Blue, Yellow.

Representation Of Data Flow Diagram 7 Stages Templates For Business PowerPoint
We present our representation of data flow diagram 7 stages templates for business PowerPoint.Download our Circle Charts PowerPoint Templates because Our PowerPoint Templates and Slides will give you great value for your money. Be assured of finding the best projection to highlight your words. Present our Arrows PowerPoint Templates because Our PowerPoint Templates and Slides will let you Leave a lasting impression to your audiences. They possess an inherent longstanding recall factor. Present our Business PowerPoint Templates because Our PowerPoint Templates and Slides are designed to help you succeed. They have all the ingredients you need. Download and present our Shapes PowerPoint Templates because Our PowerPoint Templates and Slides are Clear and concise. Use them and dispel any doubts your team may have. Download and present our Process and Flows PowerPoint Templates because Our PowerPoint Templates and Slides will let you Clearly mark the path for others to follow.Use these PowerPoint slides for presentations relating to abstract, access, arrow, background, banner, blue, bright, business, chart, circle, color, colorful, concept, conceptual, connection, corporate, creative, cycle, design, different, element, empty, form, frame, graphic, green, group, idea, illustration, match, message, order, part, piece, place, process, red, shape, solution, special, speech, strategy, symbol, system loop, template, text, usable, vector, web, website. The prominent colors used in the PowerPoint template are Purple, Yellow, Green.

Circular Process 8 Stages Diverging Flow Venn Network PowerPoint Templates
We present our circular process 8 stages diverging flow Venn Network PowerPoint templates.Use our Ring charts PowerPoint Templates because Our PowerPoint Templates and Slides will let you meet your Deadlines. Use our Marketing PowerPoint Templates because there is a crucial aspect that requires extra attention. Download our Arrows PowerPoint Templates because you can Churn the wheels of the brains of your colleagues. Present our Shapes PowerPoint Templates because this helps in epitomised the values of teamwork. Present our Business PowerPoint Templates because this slide will fire away with all the accuracy at your command.Use these PowerPoint slides for presentations relating to Around, arrow, business, chart, circle, circular, circulation, commerce, concept, curving, cycle, diagram, direction, element, finance, financial, flow, flowchart, flowing, global, globe, internet, investment, market, motion, movement, moving, presentation, process, recession, recycle, repeat, repetitive, ring, rotation, round, savings, shape, shipping, shopping, spinning, step, structure, symbol. The prominent colors used in the PowerPoint template are Blue light, Black, White. People tell us our circular process 8 stages diverging flow Venn Network PowerPoint templates are Swanky. We assure you our chart PowerPoint templates and PPT Slides are Festive. PowerPoint presentation experts tell us our circular process 8 stages diverging flow Venn Network PowerPoint templates are Stylish. You can be sure our circulation PowerPoint templates and PPT Slides are Fancy. Professionals tell us our circular process 8 stages diverging flow Venn Network PowerPoint templates are Nifty. Use our business PowerPoint templates and PPT Slides are Splendid.
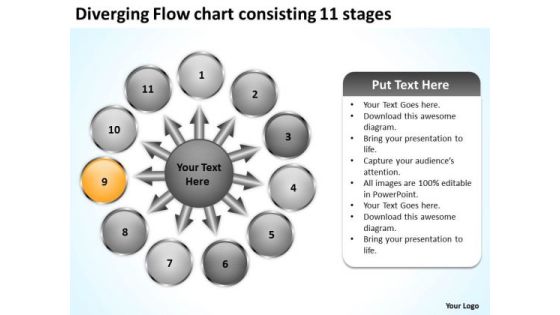
Diverging Flow Chart Consisting 11 Stages Business Target Network PowerPoint Slides
We present our diverging flow chart consisting 11 stages business Target Network PowerPoint Slides.Present our Business PowerPoint Templates because you have secured a name for yourself in the domestic market. Now the time is right to spread your reach to other countries. Present our Circle Charts PowerPoint Templates because they have fired the dreams of many fertile minds. Download and present our Arrows PowerPoint Templates because you have a good idea of the roadmap to your desired destination. Download and present our Shapes PowerPoint Templates because it helps you to get your team in the desired sequence into the bracket. Use our Flow charts PowerPoint Templates because Our PowerPoint Templates and Slides provide you with a vast range of viable options. Select the appropriate ones and just fill in your text. Use these PowerPoint slides for presentations relating to Arrows, blank, business, central, centralized, chart, circle, circular, circulation concept, conceptual, converging, design, diagram, empty, executive, icon, idea illustration, management, map, mapping, moa, model, numbers, organization outwards, pointing, procedure, process, radial, radiating, relationship, resource sequence, sequential, seven, square, strategy, template. The prominent colors used in the PowerPoint template are Yellow, Gray, White. Presenters tell us our diverging flow chart consisting 11 stages business Target Network PowerPoint Slides are Efficient. Presenters tell us our central PowerPoint templates and PPT Slides are Fantastic. PowerPoint presentation experts tell us our diverging flow chart consisting 11 stages business Target Network PowerPoint Slides are Fantastic. We assure you our centralized PowerPoint templates and PPT Slides are Reminiscent. Customers tell us our diverging flow chart consisting 11 stages business Target Network PowerPoint Slides are Excellent. People tell us our centralized PowerPoint templates and PPT Slides are Stylish.

Eight Successive Steps Diverging A Flow Chart Circular Spoke Diagram PowerPoint Templates
We present our eight successive steps diverging a flow chart Circular Spoke Diagram PowerPoint templates.Download and present our Business PowerPoint Templates because infrastructure growth is an obvious requirement of today.inform your group on how exactly this potential is tailor made for you. Present our Circle Charts PowerPoint Templates because you have the process in your head, our template design showing will illuminate your thoughts. Use our Arrows PowerPoint Templates because you know your business and have a vision for it. Present our Shapes PowerPoint Templates because the mind is always whirring with new ideas. Download our Flow charts PowerPoint Templates because you understand the illness and its causes.Use these PowerPoint slides for presentations relating to Arrows, blank, business, central, centralized, chart, circle, circular, circulation concept, conceptual, converging, design, diagram, empty, executive, icon, idea illustration, management, map, mapping, moa, model, numbers, organization outwards, pointing, procedure, process, radial, radiating, relationship, resource sequence, sequential, seven, square, strategy, template. The prominent colors used in the PowerPoint template are Blue, Gray, White. Presenters tell us our eight successive steps diverging a flow chart Circular Spoke Diagram PowerPoint templates are Pleasant. Presenters tell us our circle PowerPoint templates and PPT Slides are Precious. PowerPoint presentation experts tell us our eight successive steps diverging a flow chart Circular Spoke Diagram PowerPoint templates are Awesome. We assure you our circular PowerPoint templates and PPT Slides are Stylish. Customers tell us our eight successive steps diverging a flow chart Circular Spoke Diagram PowerPoint templates are Dynamic. People tell us our business PowerPoint templates and PPT Slides are Charming.
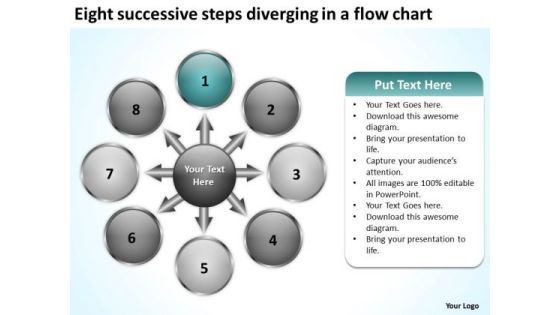
Eight Successive Steps Diverging A Flow Chart Pie Diagram PowerPoint Slides
We present our eight successive steps diverging a flow chart Pie Diagram PowerPoint Slides.Use our Business PowerPoint Templates because profit levels have been steady over the recent past. Spread your heightened excitement to others in the room. Use our Circle Charts PowerPoint Templates because you have configured your targets, identified your goals as per priority and importance. Download our Arrows PowerPoint Templates because there are different paths to gain the necessary knowledge to acheive it. Download our Shapes PowerPoint Templates because you can Refine them all as you take them through the numerous filtering stages of the funnel of your quality control process. Download and present our Flow charts PowerPoint Templates because this slide helps you to give your team an overview of your capability and insight into the minute details of the overall picture highlighting the interdependence at every operational level.Use these PowerPoint slides for presentations relating to Arrows, blank, business, central, centralized, chart, circle, circular, circulation concept, conceptual, converging, design, diagram, empty, executive, icon, idea illustration, management, map, mapping, moa, model, numbers, organization outwards, pointing, procedure, process, radial, radiating, relationship, resource sequence, sequential, seven, square, strategy, template. The prominent colors used in the PowerPoint template are Blue, Gray, White. Presenters tell us our eight successive steps diverging a flow chart Pie Diagram PowerPoint Slides are Excellent. Presenters tell us our centralized PowerPoint templates and PPT Slides are Pleasant. PowerPoint presentation experts tell us our eight successive steps diverging a flow chart Pie Diagram PowerPoint Slides are specially created by a professional team with vast experience. They diligently strive to come up with the right vehicle for your brilliant Ideas. We assure you our circle PowerPoint templates and PPT Slides will help them to explain complicated concepts. Customers tell us our eight successive steps diverging a flow chart Pie Diagram PowerPoint Slides are Splendid. People tell us our central PowerPoint templates and PPT Slides effectively help you save your valuable time.
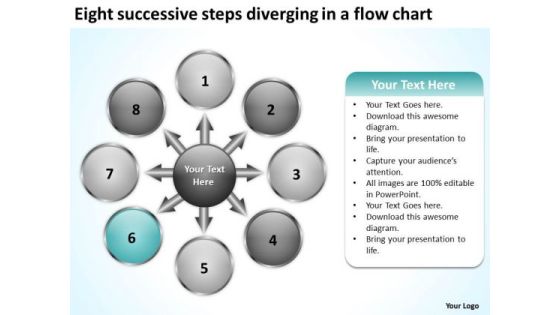
Eight Successive Steps Diverging A Flow Chart Pie Network PowerPoint Slides
We present our eight successive steps diverging a flow chart Pie Network PowerPoint Slides.Download our Business PowerPoint Templates because profit levels have been steady over the recent past. Spread your heightened excitement to others in the room. Present our Circle Charts PowerPoint Templates because they are the tools that helped most of us evolve. Use our Arrows PowerPoint Templates because it depicts that Original thinking is the need of the hour. Download our Shapes PowerPoint Templates because colours generate instant reactions in our brains. Use our Flow charts PowerPoint Templates because you should Emphasise the process of your business or corporate growth.Use these PowerPoint slides for presentations relating to Arrows, blank, business, central, centralized, chart, circle, circular, circulation concept, conceptual, converging, design, diagram, empty, executive, icon, idea illustration, management, map, mapping, moa, model, numbers, organization outwards, pointing, procedure, process, radial, radiating, relationship, resource sequence, sequential, seven, square, strategy, template. The prominent colors used in the PowerPoint template are Blue, Gray, White. Presenters tell us our eight successive steps diverging a flow chart Pie Network PowerPoint Slides have awesome images to get your point across. Presenters tell us our business PowerPoint templates and PPT Slides are Glamorous. PowerPoint presentation experts tell us our eight successive steps diverging a flow chart Pie Network PowerPoint Slides will make the presenter successul in his career/life. We assure you our circulation PowerPoint templates and PPT Slides provide you with a vast range of viable options. Select the appropriate ones and just fill in your text. Customers tell us our eight successive steps diverging a flow chart Pie Network PowerPoint Slides are readymade to fit into any presentation structure. People tell us our central PowerPoint templates and PPT Slides are Pleasant.
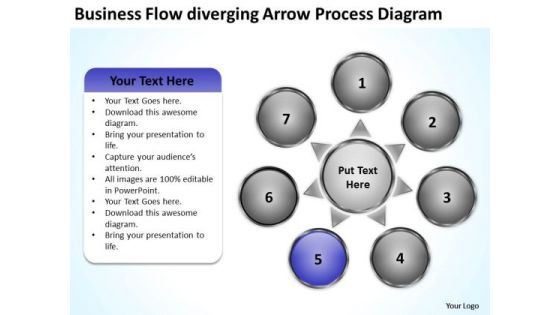
Flow Diverging Arrow Process Diagram Chart Circular PowerPoint Templates
We present our flow diverging arrow process diagram chart Circular PowerPoint templates.Use our Success PowerPoint Templates because you know your business and have a vision for it. Use our Shapes PowerPoint Templates because you can Show them how to churn out fresh ideas. Present our Business PowerPoint Templates because this template can project the path to sucess that you have charted. Download our Circle Charts PowerPoint Templates because you will be able to Highlight your ideas broad-based on strong fundamentals and illustrate how they step by step acheive the set growth factor. Download and present our Process and Flows PowerPoint Templates because the Venn graphic comprising interlinking circles geometrically demonstate how various functions operating independantly, to a large extent, are essentially interdependant.Use these PowerPoint slides for presentations relating to Access, Arrow, Background, Banner, Business, Circle, Color, Colorful, Concept, Conceptual, Connection, Corporate, Creative, Cycle, Dark, Design, Different, Element, Empty, Graphic, Group, Illustration, Process, Progress, Shape, Strategy, Symbol, Template. The prominent colors used in the PowerPoint template are Purple, White, Gray. People tell us our flow diverging arrow process diagram chart Circular PowerPoint templates will get their audience's attention. Professionals tell us our Color PowerPoint templates and PPT Slides will help you be quick off the draw. Just enter your specific text and see your points hit home. Customers tell us our flow diverging arrow process diagram chart Circular PowerPoint templates look good visually. Use our Background PowerPoint templates and PPT Slides will help them to explain complicated concepts. We assure you our flow diverging arrow process diagram chart Circular PowerPoint templates are Wistful. Professionals tell us our Background PowerPoint templates and PPT Slides are Excellent.
Key Statistics About Referral Marketing Online And Offline Brand Promotion Techniques Icons PDF
This slide showcases key statistics that can help organization to evaluate the efficiency of referral marketing. Referral marketing can help organization to improve the brand awareness and improve customer base. Presenting this PowerPoint presentation, titled Key Statistics About Referral Marketing Online And Offline Brand Promotion Techniques Icons PDF, with topics curated by our researchers after extensive research. This editable presentation is available for immediate download and provides attractive features when used. Download now and captivate your audience. Presenting this Key Statistics About Referral Marketing Online And Offline Brand Promotion Techniques Icons PDF. Our researchers have carefully researched and created these slides with all aspects taken into consideration. This is a completely customizable Key Statistics About Referral Marketing Online And Offline Brand Promotion Techniques Icons PDF that is available for immediate downloading. Download now and make an impact on your audience. Highlight the attractive features available with our PPTs.

Constituting Components Of Strategic Frameworks For Digital Transformation Diagrams PDF
This slide includes five constituting elements of digital transformation framework. These components are customer engagement, data and analytics, social communities, CRM and emerging technologies. Presenting Constituting Components Of Strategic Frameworks For Digital Transformation Diagrams PDF to dispense important information. This template comprises five stages. It also presents valuable insights into the topics including Social Communities, Data Analytics, Customer Engagement. This is a completely customizable PowerPoint theme that can be put to use immediately. So, download it and address the topic impactfully.

Utilization Of Current Techniques To Improve Efficiency Case Competition Market Size Of ADC Cosmetics Company For Past 5 Years Portrait PDF
This slide shows declining market share of ADC Cosmetics Company. This decline is due to Absence of latest trends in the company, Changes in Customer Preferences, Decline in revenue, Intense Competition etc. Deliver an awe inspiring pitch with this creative utilization of current techniques to improve efficiency case competition market size of adc cosmetics company for past 5 years portrait pdf bundle. Topics like absence of latest trends in the company, changes in customer preferences, decline in revenue can be discussed with this completely editable template. It is available for immediate download depending on the needs and requirements of the user.
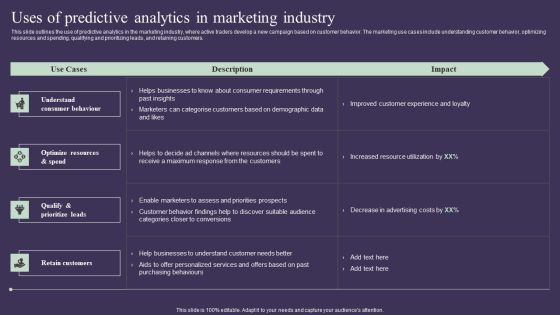
Projection Model Uses Of Predictive Analytics In Marketing Industry Infographics PDF
This slide outlines the use of predictive analytics in the marketing industry, where active traders develop a new campaign based on customer behavior. The marketing use cases include understanding customer behavior, optimizing resources and spending, qualifying and prioritizing leads, and retaining customers. Make sure to capture your audiences attention in your business displays with our gratis customizable Projection Model Uses Of Predictive Analytics In Marketing Industry Infographics PDF. These are great for business strategies, office conferences, capital raising or task suggestions. If you desire to acquire more customers for your tech business and ensure they stay satisfied, create your own sales presentation with these plain slides.
Sales Team Performance Management And Tracking Dashboard Building Efficient Workplace Performance Summary PDF
This slide showcases evaluating teams through 360 degree feedback method. It provides information about reliability, loyalty, initiatives, participitative, communication skills, writing skills, feedback, decision making, quick grasping, etc.Crafting an eye-catching presentation has never been more straightforward. Let your presentation shine with this tasteful yet straightforward Sales Team Performance Management And Tracking Dashboard Building Efficient Workplace Performance Summary PDF template. It offers a minimalistic and classy look that is great for making a statement. The colors have been employed intelligently to add a bit of playfulness while still remaining professional. Construct the ideal Sales Team Performance Management And Tracking Dashboard Building Efficient Workplace Performance Summary PDF that effortlessly grabs the attention of your audience Begin now and be certain to wow your customers.

Stock Inventory Acquisition ABC Analysis For Stock Inventory Management Microsoft PDF
This slide showcases ABC analysis method that can help organization in inventory management. It can help organization in optimum utilization of resources and reduce wastage of inventory. Crafting an eye-catching presentation has never been more straightforward. Let your presentation shine with this tasteful yet straightforward Stock Inventory Acquisition ABC Analysis For Stock Inventory Management Microsoft PDF template. It offers a minimalistic and classy look that is great for making a statement. The colors have been employed intelligently to add a bit of playfulness while still remaining professional. Construct the ideal Stock Inventory Acquisition ABC Analysis For Stock Inventory Management Microsoft PDF that effortlessly grabs the attention of your audience Begin now and be certain to wow your customers.
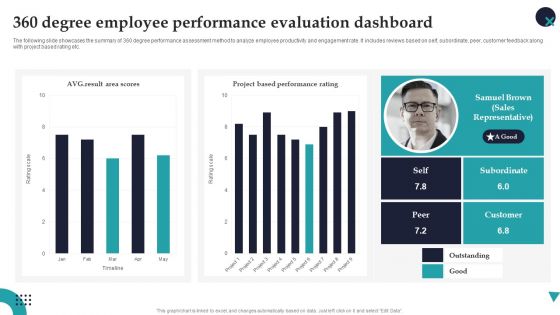
360 Degree Employee Performance Evaluation Dashboard Employee Performance Management Elements PDF
The following slide showcases the summary of 360 degree performance assessment method to analyze employee productivity and engagement rate. It includes reviews based on self, subordinate, peer, customer feedback along with project based rating etc.Retrieve professionally designed 360 Degree Employee Performance Evaluation Dashboard Employee Performance Management Elements PDF to effectively convey your message and captivate your listeners. Save time by selecting pre-made slideshows that are appropriate for various topics, from business to educational purposes. These themes come in many different styles, from creative to corporate, and all of them are easily adjustable and can be edited quickly. Access them as PowerPoint templates or as Google Slides themes. You do not have to go on a hunt for the perfect presentation because Slidegeeks got you covered from everywhere.

360 Degree Employee Performance Evaluation Dashboard Elements PDF
The following slide showcases the summary of 360 degree performance assessment method to analyze employee productivity and engagement rate. It includes reviews based on self, subordinate, peer, customer feedback along with project based rating etc. Presenting this PowerPoint presentation, titled 360 Degree Employee Performance Evaluation Dashboard Elements PDF, with topics curated by our researchers after extensive research. This editable presentation is available for immediate download and provides attractive features when used. Download now and captivate your audience. Presenting this 360 Degree Employee Performance Evaluation Dashboard Elements PDF. Our researchers have carefully researched and created these slides with all aspects taken into consideration. This is a completely customizable 360 Degree Employee Performance Evaluation Dashboard Elements PDF that is available for immediate downloading. Download now and make an impact on your audience. Highlight the attractive features available with our PPTs.

Team Effort Business PowerPoint Templates And PowerPoint Themes 1112
We present our Team Effort Business PowerPoint Templates And PowerPoint Themes 1112.Use our Puzzles or jigsaws PowerPoint Templates because, Now funnel your marketing strategies down the cone,stage by stage, refining as you go along. Use our Communication PowerPoint Templates because, Emphasise the benefits of healthy food habits and lifestyles in respect of vital organs of the human anatomy. Use our Construction PowerPoint Templates because, It has inspired a whole new world of medical endeavour. Use our Business PowerPoint Templates because,Marketing Strategy Business Template:- Maximising sales of your product is the intended destination. Use our Teamwork PowerPoint Templates because,Now use this slide to bullet point your views.Use these PowerPoint slides for presentations relating to businessmen connecting Business Communication Construction Teamwork Puzzles or jigsaws. The prominent colors used in the PowerPoint template are Blue, Red, White
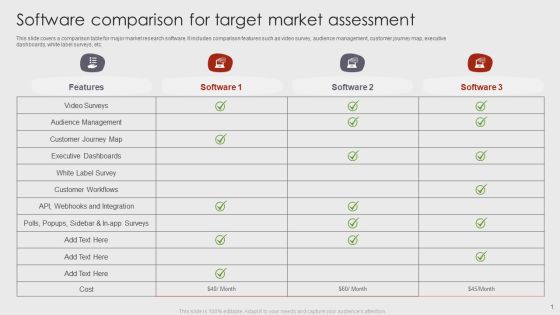
Software Comparison For Target Market Assessment Brochure PDF
This slide covers a comparison table for major market research software. It includes comparison features such as video survey, audience management, customer journey map, executive dashboards, white label surveys, etc. Showcasing this set of slides titled Software Comparison For Target Market Assessment Brochure PDF. The topics addressed in these templates are Executive Dashboards, Audience Management, Customer Workflows. All the content presented in this PPT design is completely editable. Download it and make adjustments in color, background, font etc. as per your unique business setting.

Help Desk Standard Operating Procedure SOP Process Flow One Pager PDF Document PPT Template
Here we present the Help Desk Standard Operating Procedure SOP Process Flow One Pager PDF Document PPT Template. This One-pager template includes everything you require. You can edit this document and make changes according to your needs it offers complete freedom of customization. Grab this Help Desk Standard Operating Procedure SOP Process Flow One Pager PDF Document PPT Template Download now.

One Pager Civil Procedure Cheat Sheet For Business Winding Up PDF Document PPT Template
Here we present the One Pager Civil Procedure Cheat Sheet For Business Winding Up PDF Document PPT Template. This One-pager template includes everything you require. You can edit this document and make changes according to your needs it offers complete freedom of customization. Grab this One Pager Civil Procedure Cheat Sheet For Business Winding Up PDF Document PPT Template Download now.

Dashboard To Assess Ecommerce Financial Performance Across Regions Themes PDF
This slide showcases ecommerce key performance indicators KPI dashboard with financial statement. It provides information about total sales, orders, net profit, net profit margin, average order value, channels, etc. Here you can discover an assortment of the finest PowerPoint and Google Slides templates. With these templates, you can create presentations for a variety of purposes while simultaneously providing your audience with an eye catching visual experience. Download Dashboard To Assess Ecommerce Financial Performance Across Regions Themes PDF to deliver an impeccable presentation. These templates will make your job of preparing presentations much quicker, yet still, maintain a high level of quality. Slidegeeks has experienced researchers who prepare these templates and write high quality content for you. Later on, you can personalize the content by editing the Dashboard To Assess Ecommerce Financial Performance Across Regions Themes PDF.
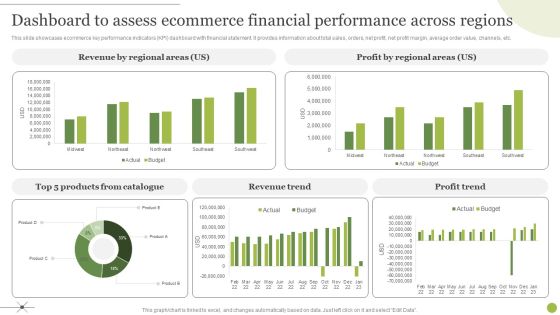
Managing E Commerce Business Accounting Dashboard To Assess Ecommerce Financial Performance Across Regions Graphics PDF
This slide showcases ecommerce key performance indicators KPI dashboard with financial statement. It provides information about total sales, orders, net profit, net profit margin, average order value, channels, etc. Do you have to make sure that everyone on your team knows about any specific topic I yes, then you should give Managing E Commerce Business Accounting Dashboard To Assess Ecommerce Financial Performance Across Regions Graphics PDF a try. Our experts have put a lot of knowledge and effort into creating this impeccable Managing E Commerce Business Accounting Dashboard To Assess Ecommerce Financial Performance Across Regions Graphics PDF. You can use this template for your upcoming presentations, as the slides are perfect to represent even the tiniest detail. You can download these templates from the Slidegeeks website and these are easy to edit. So grab these today.
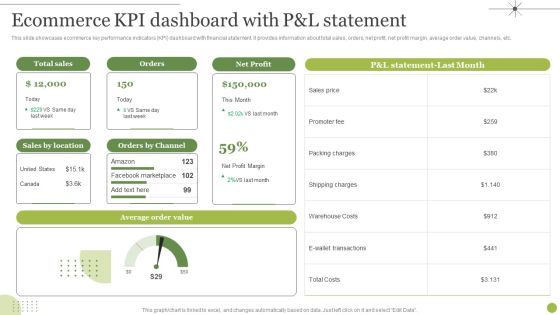
Managing E Commerce Business Accounting Ecommerce KPI Dashboard With P And L Statement Diagrams PDF
This slide showcases ecommerce key performance indicators KPI dashboard with financial statement. It provides information about total sales, orders, net profit, net profit margin, average order value, channels, etc. Present like a pro with Managing E Commerce Business Accounting Ecommerce KPI Dashboard With P And L Statement Diagrams PDF Create beautiful presentations together with your team, using our easy to use presentation slides. Share your ideas in real time and make changes on the fly by downloading our templates. So whether you are in the office, on the go, or in a remote location, you can stay in sync with your team and present your ideas with confidence. With Slidegeeks presentation got a whole lot easier. Grab these presentations today.

Dashboard To Assess Ecommerce Financial Performance Across Regions Infographics PDF
This slide showcases ecommerce key performance indicators KPI dashboard with financial statement. It provides information about total sales, orders, net profit, net profit margin, average order value, channels, etc.Here you can discover an assortment of the finest PowerPoint and Google Slides templates. With these templates, you can create presentations for a variety of purposes while simultaneously providing your audience with an eye-catching visual experience. Download Dashboard To Assess Ecommerce Financial Performance Across Regions Infographics PDF to deliver an impeccable presentation. These templates will make your job of preparing presentations much quicker, yet still, maintain a high level of quality. Slidegeeks has experienced researchers who prepare these templates and write high-quality content for you. Later on, you can personalize the content by editing the Dashboard To Assess Ecommerce Financial Performance Across Regions Infographics PDF.

Company Sales Lead Qualification Procedure To Enhance Revenue Utilizing CHAMP Sales Model Summary PDF
The following slide displays the utilization of CHAMP model in the sales process, as it displays the name of leads, the key challenges faced, who has the authority of making the purchase along with budget and customers key priority.Deliver an awe inspiring pitch with this creative Company Sales Lead Qualification Procedure To Enhance Revenue Utilizing CHAMP Sales Model Summary PDF bundle. Topics like Customer Shareholders, Prioritization, Organization can be discussed with this completely editable template. It is available for immediate download depending on the needs and requirements of the user.

Sales Automation Procedure Why Do We Need To Automate Sales Processes Microsoft PDF
This slide covers the need of sales process automation which includes to enhance team productivity, decrease response time, recognize potential customers and simplify reporting process. Presenting Sales Automation Procedure Why Do We Need To Automate Sales Processes Microsoft PDF to provide visual cues and insights. Share and navigate important information on four stages that need your due attention. This template can be used to pitch topics like Decreases Response Time, Recognizes Potential Customers, Simplifies Reporting Process. In addtion, this PPT design contains high resolution images, graphics, etc, that are easily editable and available for immediate download.
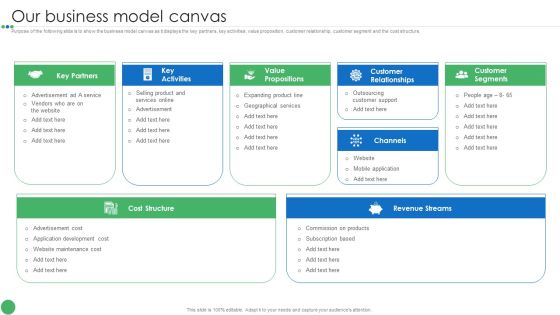
Our Business Model Canvas Guide To Enhance Organic Growth By Advancing Business Procedures Themes PDF
Purpose of the following slide is to show the business model canvas as it displays the key partners, key activities, value proposition, customer relationship, customer segment and the cost structure. Deliver an awe inspiring pitch with this creative Our Business Model Canvas Guide To Enhance Organic Growth By Advancing Business Procedures Themes PDF bundle. Topics like Top Management, Business Development, Efficient Management can be discussed with this completely editable template. It is available for immediate download depending on the needs and requirements of the user.

Procedure To Develop Effective Product Buyer Persona For Understanding Target Audience Ppt Portfolio Graphics PDF
This slide covers customer persona which helps in understanding the target audience for better product positioning. It includes customer details such as professional information, online behaviour, worries, hopes, dreams, background, etc. Want to ace your presentation in front of a live audience. Our Procedure To Develop Effective Product Buyer Persona For Understanding Target Audience Ppt Portfolio Graphics PDF can help you do that by engaging all the users towards you. Slidegeeks experts have put their efforts and expertise into creating these impeccable powerpoint presentations so that you can communicate your ideas clearly. Moreover, all the templates are customizable, and easy-to-edit and downloadable. Use these for both personal and commercial use.

Store Positioning In Retail Management Retail Enterprise Organizational Chart Structure PDF
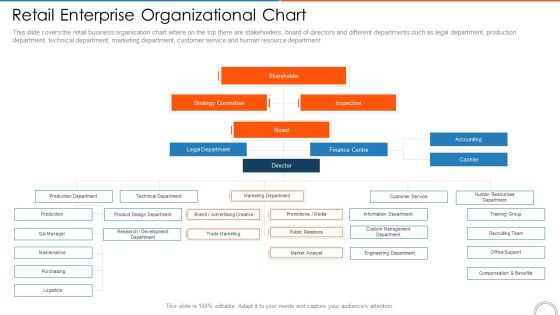
This slide covers the retail business organization chart where on the top there are stakeholders, board of directors and different departments such as legal department, production department, technical department, marketing department, customer service and human resource department Presenting store positioning in retail management retail enterprise organizational chart structure pdf to provide visual cues and insights. Share and navigate important information on three stages that need your due attention. This template can be used to pitch topics like shareholder, strategy committee, production department. In addtion, this PPT design contains high resolution images, graphics, etc, that are easily editable and available for immediate download.
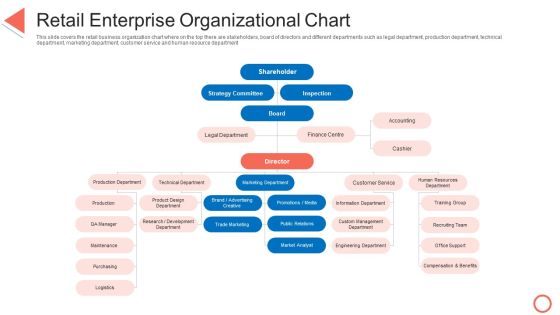
Retail Enterprise Organizational Chart STP Approaches In Retail Marketing Portrait PDF
This slide covers the retail business organization chart where on the top there are stakeholders, board of directors and different departments such as legal department, production department, technical department, marketing department, customer service and human resource department. Presenting retail enterprise organizational chart stp approaches in retail marketing portrait pdf to provide visual cues and insights. Share and navigate important information on eight stages that need your due attention. This template can be used to pitch topics like strategy, accounting, human resources, training, analyst. In addtion, this PPT design contains high resolution images, graphics, etc, that are easily editable and available for immediate download.
Retail Enterprise Organizational Chart Retail Store Positioning Ppt Layouts Graphics PDF
This slide covers the retail business organization chart where on the top there are stakeholders, board of directors and different departments such as legal department, production department, technical department, marketing department, customer service and human resource department. Presenting retail enterprise organizational chart retail store positioning ppt layouts graphics pdf to provide visual cues and insights. Share and navigate important information on eight stages that need your due attention. This template can be used to pitch topics like strategy, accounting, human resources, training, analyst. In addtion, this PPT design contains high resolution images, graphics, etc, that are easily editable and available for immediate download.

Retail Enterprise Organizational Chart Retail Outlet Positioning And Merchandising Approaches Guidelines PDF
This slide covers the retail business organization chart where on the top there are stakeholders, board of directors and different departments such as legal department, production department, technical department, marketing department, customer service and human resource department. Presenting retail enterprise organizational chart retail outlet positioning and merchandising approaches guidelines pdf to provide visual cues and insights. Share and navigate important information on eight stages that need your due attention. This template can be used to pitch topics like strategy, accounting, human resources, training, analyst. In addtion, this PPT design contains high resolution images, graphics, etc, that are easily editable and available for immediate download.

Designing And Deployment CRM Training Program For Employees Introduction PDF
This slide highlights the CRM training Program for employees which includes overview training, lead management session, customization and data security session. Deliver an awe inspiring pitch with this creative designing and deployment crm training program for employees introduction pdf bundle. Topics like training session, involved, trainer, program, duration can be discussed with this completely editable template. It is available for immediate download depending on the needs and requirements of the user.

BI Technique For Data Informed Decisions Major Users Of Sap Analytics Cloud Suite Summary PDF
The following slide illustrates the major user of SAP Analytics Cloud suite which are business users and business intelligence seekers. It also contains details regarding the usage statistics of both the users. Crafting an eye catching presentation has never been more straightforward. Let your presentation shine with this tasteful yet straightforward BI Technique For Data Informed Decisions Major Users Of Sap Analytics Cloud Suite Summary PDF template. It offers a minimalistic and classy look that is great for making a statement. The colors have been employed intelligently to add a bit of playfulness while still remaining professional. Construct the ideal BI Technique For Data Informed Decisions Major Users Of Sap Analytics Cloud Suite Summary PDF that effortlessly grabs the attention of your audience Begin now and be certain to wow your customers.

Affinity Marketing Industry Drivers Efficient B2B And B2C Marketing Techniques For Organization Professional PDF
The following slide helps the organization in understanding the marketing industry drivers. Understanding these drivers can help the organization in developing effective affinity marketing campaign. These drivers can be brand trust, customer service, prices etc.Do you have to make sure that everyone on your team knows about any specific topic I yes, then you should give Affinity Marketing Industry Drivers Efficient B2B And B2C Marketing Techniques For Organization Professional PDF a try. Our experts have put a lot of knowledge and effort into creating this impeccable Affinity Marketing Industry Drivers Efficient B2B And B2C Marketing Techniques For Organization Professional PDF. You can use this template for your upcoming presentations, as the slides are perfect to represent even the tiniest detail. You can download these templates from the Slidegeeks website and these are easy to edit. So grab these today.

Defining Generic Target Marketing Techniques Analyze Online And Offline Marketing Campaigns Data Topics PDF
This template covers dashboard to measure and analyze target marketing campaign performance. It also helps in tracking and reporting online and offline marketing campaigns through KPIs such as traffic sources, lead generation metrics, offline product sales, store visitations, customer acquisition, and offline retention and advocacy. Create an editable Defining Generic Target Marketing Techniques Analyze Online And Offline Marketing Campaigns Data Topics PDF that communicates your idea and engages your audience. Whether you are presenting a business or an educational presentation, pre designed presentation templates help save time. Defining Generic Target Marketing Techniques Analyze Online And Offline Marketing Campaigns Data Topics PDF is highly customizable and very easy to edit, covering many different styles from creative to business presentations. Slidegeeks has creative team members who have crafted amazing templates. So, go and get them without any delay.

Techniques To Boost Brand Awareness Key Statistics About Referral Marketing Introduction PDF
This slide showcases key statistics that can help organization to evaluate the efficiency of referral marketing. Referral marketing can help organization to improve the brand awareness and improve customer base. Explore a selection of the finest Techniques To Boost Brand Awareness Key Statistics About Referral Marketing Introduction PDF here. With a plethora of professionally designed and pre-made slide templates, you can quickly and easily find the right one for your upcoming presentation. You can use our Techniques To Boost Brand Awareness Key Statistics About Referral Marketing Introduction PDF to effectively convey your message to a wider audience. Slidegeeks has done a lot of research before preparing these presentation templates. The content can be personalized and the slides are highly editable. Grab templates today from Slidegeeks.
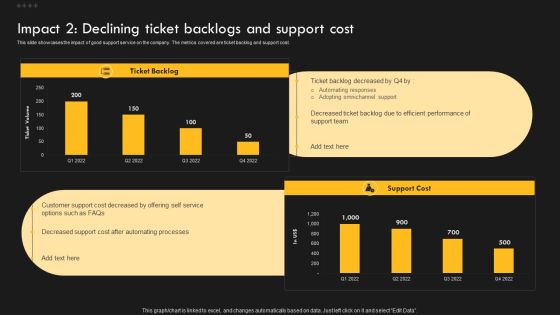
Service Improvement Techniques For Client Retention Impact 2 Declining Ticket Backlogs And Support Diagrams PDF
This slide showcases the impact of good support service on the company. The metrics covered are customer satisfaction and retention. Explore a selection of the finest Service Improvement Techniques For Client Retention Impact 2 Declining Ticket Backlogs And Support Diagrams PDF here. With a plethora of professionally designed and pre-made slide templates, you can quickly and easily find the right one for your upcoming presentation. You can use our Service Improvement Techniques For Client Retention Impact 2 Declining Ticket Backlogs And Support Diagrams PDF to effectively convey your message to a wider audience. Slidegeeks has done a lot of research before preparing these presentation templates. The content can be personalized and the slides are highly editable. Grab templates today from Slidegeeks.

Techniques To Optimize UX Issue 1 Increasing Average Response Time Themes PDF
This slide provides an overview of major KPIs of customer service team. The metrics covered are average response time and first call resolution. Explore a selection of the finest Techniques To Optimize UX Issue 1 Increasing Average Response Time Themes PDF here. With a plethora of professionally designed and pre-made slide templates, you can quickly and easily find the right one for your upcoming presentation. You can use our Techniques To Optimize UX Issue 1 Increasing Average Response Time Themes PDF to effectively convey your message to a wider audience. Slidegeeks has done a lot of research before preparing these presentation templates. The content can be personalized and the slides are highly editable. Grab templates today from Slidegeeks.
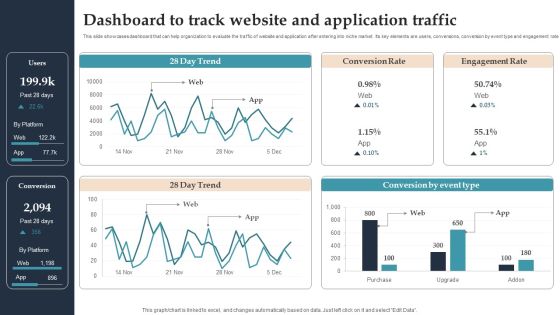
Product Rollout Techniques Dashboard To Track Website And Application Traffic Mockup PDF
This slide showcases dashboard that can help organization to evaluate the traffic of website and application after entering into niche market. Its key elements are users, conversions, conversion by event type and engagement rate. Crafting an eye-catching presentation has never been more straightforward. Let your presentation shine with this tasteful yet straightforward Product Rollout Techniques Dashboard To Track Website And Application Traffic Mockup PDF template. It offers a minimalistic and classy look that is great for making a statement. The colors have been employed intelligently to add a bit of playfulness while still remaining professional. Construct the ideal Product Rollout Techniques Dashboard To Track Website And Application Traffic Mockup PDF that effortlessly grabs the attention of your audience Begin now and be certain to wow your customers.

Promotion Sales Techniques For New Service Introduction Key Issues Face By Us In Market Ideas PDF
This slide showcases problems that create hindrance for organization in achieving long and short term strategic goals. Key issues of company include declining revenues and market share. Crafting an eye catching presentation has never been more straightforward. Let your presentation shine with this tasteful yet straightforward Promotion Sales Techniques For New Service Introduction Key Issues Face By Us In Market Ideas PDF template. It offers a minimalistic and classy look that is great for making a statement. The colors have been employed intelligently to add a bit of playfulness while still remaining professional. Construct the ideal Promotion Sales Techniques For New Service Introduction Key Issues Face By Us In Market Ideas PDF that effortlessly grabs the attention of your audience. Begin now and be certain to wow your customers.
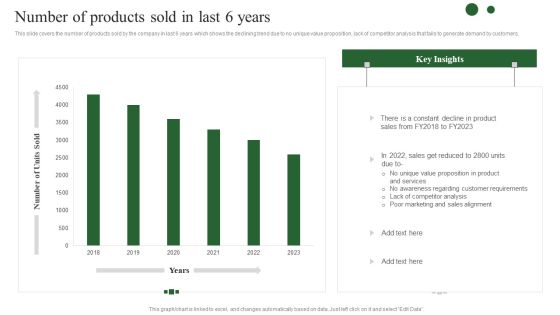
Brand Development Techniques To Increase Revenues Number Of Products Sold In Last 6 Years Guidelines PDF
This slide covers the number of products sold by the company in last 6 years which shows the declining trend due to no unique value proposition, lack of competitor analysis that fails to generate demand by customers. Explore a selection of the finest Brand Development Techniques To Increase Revenues Number Of Products Sold In Last 6 Years Guidelines PDF here. With a plethora of professionally designed and pre made slide templates, you can quickly and easily find the right one for your upcoming presentation. You can use our Brand Development Techniques To Increase Revenues Number Of Products Sold In Last 6 Years Guidelines PDF to effectively convey your message to a wider audience. Slidegeeks has done a lot of research before preparing these presentation templates. The content can be personalized and the slides are highly editable. Grab templates today from Slidegeeks.
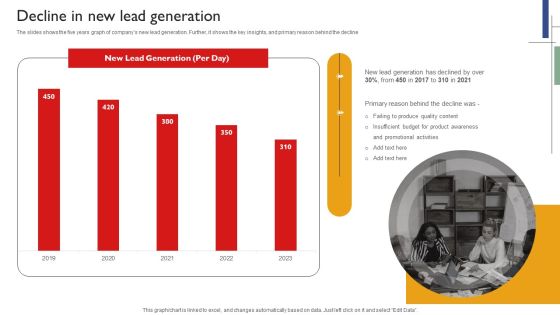
Techniques To Enhance Brand Awareness Decline In New Lead Generation Portrait PDF
The slides shows the five years graph of companys new lead generation. Further, it shows the key insights, and primary reason behind the decline Crafting an eye catching presentation has never been more straightforward. Let your presentation shine with this tasteful yet straightforward Techniques To Enhance Brand Awareness Decline In New Lead Generation Portrait PDF template. It offers a minimalistic and classy look that is great for making a statement. The colors have been employed intelligently to add a bit of playfulness while still remaining professional. Construct the ideal Techniques To Enhance Brand Awareness Decline In New Lead Generation Portrait PDF that effortlessly grabs the attention of your audience. Begin now and be certain to wow your customers.

Deploying B2B Advertising Techniques For Lead Generation Digital Marketing Dashboard Improve Performance Inspiration PDF
This slide covers digital marketing dashboard to improve performance visibility and sales. It involves details such as total number of sessions, bounce rate, goal completions and major channels over time. Crafting an eye catching presentation has never been more straightforward. Let your presentation shine with this tasteful yet straightforward Deploying B2B Advertising Techniques For Lead Generation Digital Marketing Dashboard Improve Performance Inspiration PDF template. It offers a minimalistic and classy look that is great for making a statement. The colors have been employed intelligently to add a bit of playfulness while still remaining professional. Construct the ideal Deploying B2B Advertising Techniques For Lead Generation Digital Marketing Dashboard Improve Performance Inspiration PDF that effortlessly grabs the attention of your audience. Begin now and be certain to wow your customers.

Deployment Of Marketing Tools Chart Powerpoint Slide Designs
This is a deployment of marketing tools chart powerpoint slide designs. This is a three stage process. The stages in this process are sales, customer service, marketing.

9 Steps Diverging Concepts Leading To One Issue Cycle Motion Diagram PowerPoint Slides
We present our 9 steps diverging concepts leading to one issue Cycle Motion Diagram PowerPoint Slides.Download our Circle charts PowerPoint Templates because using our templates for your colleagues will impart knowledge to feed. Download and present our Signs PowerPoint Templates because this template helps you to illustrate your method, piece by piece, and interlock the whole process in the minds of your audience. Use our Process and flows PowerPoint Templates because you can Help your viewers automatically emphathise with your thoughts. Download and present our Shapes PowerPoint Templates because all elements of the venture are equally critical. Use our Ring charts PowerPoint Templates because your brain is always churning out ideas like cogs in a wheel.Use these PowerPoint slides for presentations relating to Arrows, business, chart, circle, company, concept, continuity, continuous, cycle, dependency, diagram, direction, dynamic, endless, feeds, graph, iteration, iterative, method, path, phase, presentation, process, production, progress, progression, report, rotation, sequence, succession. The prominent colors used in the PowerPoint template are Orange, Black, White. You can be sure our 9 steps diverging concepts leading to one issue Cycle Motion Diagram PowerPoint Slides are Amazing. Presenters tell us our circle PowerPoint templates and PPT Slides are readymade to fit into any presentation structure. We assure you our 9 steps diverging concepts leading to one issue Cycle Motion Diagram PowerPoint Slides are Bright. Customers tell us our concept PowerPoint templates and PPT Slides are Beautiful. Presenters tell us our 9 steps diverging concepts leading to one issue Cycle Motion Diagram PowerPoint Slides are Royal. You can be sure our concept PowerPoint templates and PPT Slides are designed by a team of presentation professionals.

Retail Outlet Revenue Growth Chart Mockup PDF
This slide shows the revenue growth line chart of a retail store which includes passing footfall, customers per day, percentage of customer who purchased, revenue per day and revenue per year. Pitch your topic with ease and precision using this retail outlet revenue growth chart mockup pdf This layout presents information on Retail outlet revenue growth chart It is also available for immediate download and adjustment. So, changes can be made in the color, design, graphics or any other component to create a unique layout.

Circular Pink Green Bar Graph Business PowerPoint Templates Ppt Backgrounds For Slides 0113
We present our Circular Pink Green Bar Graph Business PowerPoint Templates PPT Backgrounds For Slides 0113.Download our Success PowerPoint Templates because You can Channelise the thoughts of your team with our PowerPoint Templates and Slides. Urge them to focus on the goals you have set. Use our Technology PowerPoint Templates because Our PowerPoint Templates and Slides will give you great value for your money. Be assured of finding the best projection to highlight your words. Present our Marketing PowerPoint Templates because Our PowerPoint Templates and Slides are topically designed to provide an attractive backdrop to any subject. Download our Shapes PowerPoint Templates because Our PowerPoint Templates and Slides offer you the needful to organise your thoughts. Use them to list out your views in a logical sequence. Download our Business PowerPoint Templates because They will bring a lot to the table. Their alluring flavours will make your audience salivate.Use these PowerPoint slides for presentations relating to Bar graph, Business, Success, Shapes, Technology, Marketing. The prominent colors used in the PowerPoint template are Pink, Green, Gray. Professionals tell us our Circular Pink Green Bar Graph Business PowerPoint Templates PPT Backgrounds For Slides 0113 are designed to make your presentations professional. Professionals tell us our Technology PowerPoint templates and PPT Slides look good visually. Use our Circular Pink Green Bar Graph Business PowerPoint Templates PPT Backgrounds For Slides 0113 are the best it can get when it comes to presenting. PowerPoint presentation experts tell us our PowerPoint templates and PPT Slides will make the presenter successul in his career/life. Customers tell us our Circular Pink Green Bar Graph Business PowerPoint Templates PPT Backgrounds For Slides 0113 will make the presenter look like a pro even if they are not computer savvy. Use our Business PowerPoint templates and PPT Slides are readymade to fit into any presentation structure.

Buyer Experience Journey Map With Kpis And Business Goals Formats PDF
This slide represents the five stages of the customer service journey map such as awareness, consideration, decision, service and loyalty. It includes details related to customer action, touchpoints, customer experience, KPIs, business goals and teams involved in different stages of customer journey. Showcasing this set of slides titled Buyer Experience Journey Map With Kpis And Business Goals Formats PDF. The topics addressed in these templates are Customer Action, Touchpoints, Customer Experience. All the content presented in this PPT design is completely editable. Download it and make adjustments in color, background, font etc. as per your unique business setting.

Introduction To Mobile Money In Developing Countries Five Year Comparison Of Registered Demonstration PDF
This slide shows the information statistics about region wise registered mobile money customers spread during last 5 years. It indicates that customers spread in South Asia recorded highest that is 28.4persent over the last five years.Deliver an awe inspiring pitch with this creative introduction to mobile money in developing countries five year comparison of registered demonstration pdf bundle. Topics like five year comparison of registered mobile money customers spread by region can be discussed with this completely editable template. It is available for immediate download depending on the needs and requirements of the user.

Implementation Of Digital Marketing Impact And Performance Analysis Of Digital Rules PDF
This slide represents marketing impact and performance analysis of digital marketing program. It covers an decline in cart abandonment rate and increase in qualified leads resulting in increase in revenue. Make sure to capture your audiences attention in your business displays with our gratis customizable Implementation Of Digital Marketing Impact And Performance Analysis Of Digital Rules PDF. These are great for business strategies, office conferences, capital raising or task suggestions. If you desire to acquire more customers for your tech business and ensure they stay satisfied, create your own sales presentation with these plain slides.
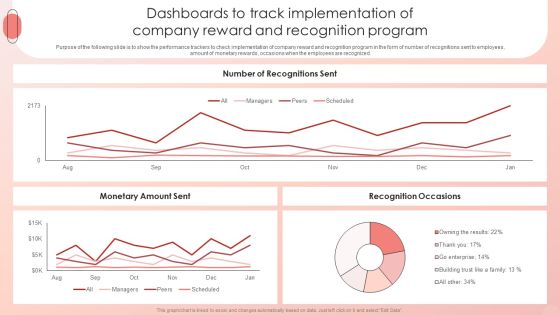
Improving HRM Process Dashboards To Track Implementation Of Company Reward Themes PDF
Purpose of the following slide is to show the performance trackers to check implementation of company reward and recognition program in the form of number of recognitions sent to employees, amount of monetary rewards, occasions when the employees are recognized. Make sure to capture your audiences attention in your business displays with our gratis customizable Improving HRM Process Dashboards To Track Implementation Of Company Reward Themes PDF. These are great for business strategies, office conferences, capital raising or task suggestions. If you desire to acquire more customers for your tech business and ensure they stay satisfied, create your own sales presentation with these plain slides.

KPI Dashboard To Assess Impact On Staff Productivity Infographics PDF
This slide covers dashboard to assess impact on employee performance by training and motivation program. It involves details such as absenteeism rate, training costs and overall labor effectiveness. Make sure to capture your audiences attention in your business displays with our gratis customizable KPI Dashboard To Assess Impact On Staff Productivity Infographics PDF. These are great for business strategies, office conferences, capital raising or task suggestions. If you desire to acquire more customers for your tech business and ensure they stay satisfied, create your own sales presentation with these plain slides.

Executing Diversity Snapshot Of Company Business Profile Infographics PDF
The purpose of this slide is to showcase the snapshot of company business profile in terms of total number of employees, active customers, services offered, corporate offices across the world etc. Coming up with a presentation necessitates that the majority of the effort goes into the content and the message you intend to convey. The visuals of a PowerPoint presentation can only be effective if it supplements and supports the story that is being told. Keeping this in mind our experts created Executing Diversity Snapshot Of Company Business Profile Infographics PDF to reduce the time that goes into designing the presentation. This way, you can concentrate on the message while our designers take care of providing you with the right template for the situation.

Consumer Acquisition And Retention Monthly Graph Background PDF
This slide displays monthly retention rate and number of acquired customers within a business for building a strong customer base and strategy formulation. It also includes graphs showing the customer acquisition and retention with key insights. Pitch your topic with ease and precision using this Consumer Acquisition And Retention Monthly Graph Background PDF. This layout presents information on Consumer Acquisition, Retention Monthly Graph. It is also available for immediate download and adjustment. So, changes can be made in the color, design, graphics or any other component to create a unique layout.

Capital Financing Pitch Deck For Cryptocurrency Business Target Market For Cryptocurrency Business Sample PDF
Mentioned slide depicts the key statistics about target customers group covering details about gender, age, demographic and financially well-off customer. Make sure to capture your audiences attention in your business displays with our gratis customizable Capital Financing Pitch Deck For Cryptocurrency Business Target Market For Cryptocurrency Business Sample PDF. These are great for business strategies, office conferences, capital raising or task suggestions. If you desire to acquire more customers for your tech business and ensure they stay satisfied, create your own sales presentation with these plain slides.
Efficient Administration Of Product Business And Umbrella Branding Product Branding Performance Tracking Dashboard Background PDF
This slide provides information regarding product branding performance tracking dashboard in terms of revenues, new customers, customer satisfaction rate. Make sure to capture your audiences attention in your business displays with our gratis customizable Efficient Administration Of Product Business And Umbrella Branding Product Branding Performance Tracking Dashboard Background PDF. These are great for business strategies, office conferences, capital raising or task suggestions. If you desire to acquire more customers for your tech business and ensure they stay satisfied, create your own sales presentation with these plain slides.
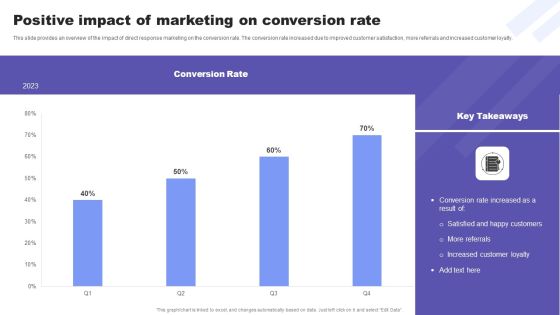
Direct Response Marketing Guide Ultimate Success Positive Impact Of Marketing On Diagrams PDF
This slide provides an overview of the impact of direct response marketing on the conversion rate. The conversion rate increased due to improved customer satisfaction, more referrals and increased customer loyalty. Make sure to capture your audiences attention in your business displays with our gratis customizable Direct Response Marketing Guide Ultimate Success Positive Impact Of Marketing On Diagrams PDF. These are great for business strategies, office conferences, capital raising or task suggestions. If you desire to acquire more customers for your tech business and ensure they stay satisfied, create your own sales presentation with these plain slides.
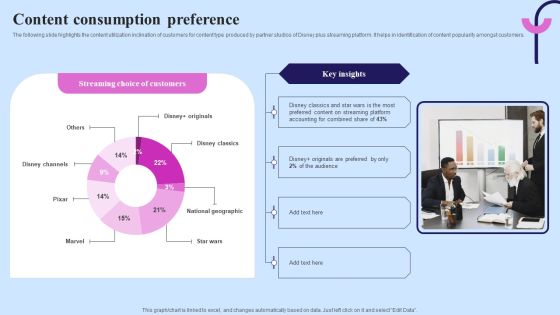
Video Streaming Technology Company Introduction Content Consumption Preference Microsoft PDF
The following slide highlights the content utilization inclination of customers for content type produced by partner studios of Disney plus streaming platform. It helps in identification of content popularity amongst customers. Make sure to capture your audiences attention in your business displays with our gratis customizable Video Streaming Technology Company Introduction Content Consumption Preference Microsoft PDF. These are great for business strategies, office conferences, capital raising or task suggestions. If you desire to acquire more customers for your tech business and ensure they stay satisfied, create your own sales presentation with these plain slides.
 Home
Home