AI PPT Maker
Templates
PPT Bundles
Design Services
Business PPTs
Business Plan
Management
Strategy
Introduction PPT
Roadmap
Self Introduction
Timelines
Process
Marketing
Agenda
Technology
Medical
Startup Business Plan
Cyber Security
Dashboards
SWOT
Proposals
Education
Pitch Deck
Digital Marketing
KPIs
Project Management
Product Management
Artificial Intelligence
Target Market
Communication
Supply Chain
Google Slides
Research Services
 One Pagers
All Categories
-
Home
- Customer Favorites
- Deal
Deal
Erp Criteria List Functional Requirement Ppt PowerPoint Presentation Icon Gallery
This is a erp criteria list functional requirement ppt powerpoint presentation icon gallery. This is a five stage process. The stages in this process are functional criteria, marketing, sales planning, marketing planning, product management.
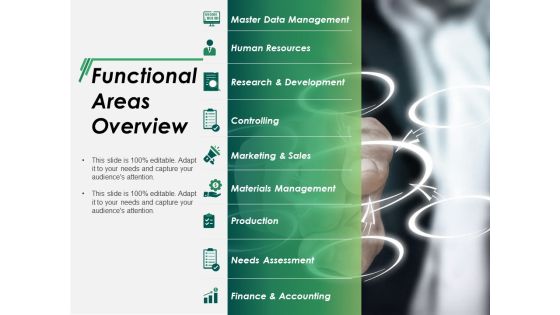
Functional Areas Overview Ppt PowerPoint Presentation Layouts Backgrounds
This is a functional areas overview ppt powerpoint presentation layouts backgrounds. This is a nine stage process. The stages in this process are master data management, human resources, controlling, marketing and sales, materials management.

Erp Criteria List Functional Requirement Ppt PowerPoint Presentation Model Outfit
This is a erp criteria list functional requirement ppt powerpoint presentation model outfit. This is a five stage process. The stages in this process are functional criteria, marketing, sales planning, marketing planning, product management.

Activity Ratios Ppt PowerPoint Presentation Gallery Microsoft
This is a activity ratios ppt powerpoint presentation gallery microsoft. This is a two stage process. The stages in this process are inventory turnover, receivables turnover, net credit sales, average accounts receivable.
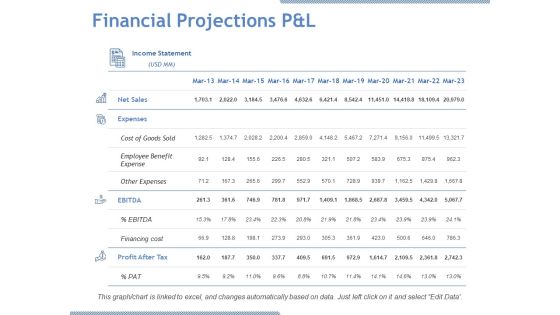
Financial Projections P And L Ppt PowerPoint Presentation Model Design Inspiration
This is a financial projections p and l ppt powerpoint presentation model design inspiration. This is a four stage process. The stages in this process are net sales, expenses, ebitda, profit after tax, cost of goods sold.

P And L Kpis Tabular Form Ppt PowerPoint Presentation Outline Aids
This is a p and l kpis tabular form ppt powerpoint presentation outline aids. This is a four stage process. The stages in this process are net sales, other income, total income, expenses, taxes.

Area Chart Ppt PowerPoint Presentation Outline Graphic Tips
This is a area chart ppt powerpoint presentation outline graphic tips. This is a two stage process. The stages in this process are business, sales in percentage, area chart, percentage, marketing.

Column Chart Ppt PowerPoint Presentation Infographic Template Icon
This is a column chart ppt powerpoint presentation infographic template icon. This is a two stage process. The stages in this process are business, marketing, sales in percentage, financial year, graph.

Erp Criteria List Functional Requirement Ppt PowerPoint Presentation Show Summary
This is a erp criteria list functional requirement ppt powerpoint presentation show summary. This is a four stage process. The stages in this process are functional criteria, marketing, sales planning, marketing planning, product management.
Functional Areas Overview Ppt PowerPoint Presentation Icon Design Inspiration
This is a functional areas overview ppt powerpoint presentation icon design inspiration. This is a nine stage process. The stages in this process are master data management, human resources, research and development, controlling, marketing and sales.

Break Even Analysis Ppt PowerPoint Presentation Portfolio Graphics Design
This is a break even analysis ppt powerpoint presentation portfolio graphics design. This is a five stage process. The stages in this process are units of output, fixed cost, variable cost, total cost, sales revenue.
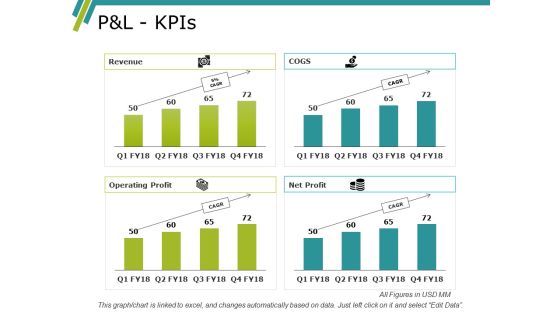
Pandl Kpis Ppt PowerPoint Presentation Slides Designs Download
This is a pandl kpis ppt powerpoint presentation slides designs download. This is a four stage process. The stages in this process are net sales, table, planning, cost, management.

Bar Chart Ppt PowerPoint Presentation Summary File Formats
This is a bar chart ppt powerpoint presentation summary file formats. This is a two stage process. The stages in this process are business, finance, financial years, sales in percentage, graph.

Erp Criteria List Functional Requirement Ppt PowerPoint Presentation Infographics Layouts
This is a erp criteria list functional requirement ppt powerpoint presentation infographics layouts. This is a four stage process. The stages in this process are functional criteria, marketing, sales planning, marketing planning, product management.

Bar Chart Ppt PowerPoint Presentation Model Sample
This is a bar chart ppt powerpoint presentation model sample. This is a two stage process. The stages in this process are sales in percentage, business, marketing, graph, percentage, year.

Balance Sheet Kpis Tabular Form Template 2 Ppt PowerPoint Presentation Summary Structure
This is a balance sheet kpis tabular form template 2 ppt powerpoint presentation summary structure. This is a four stage process. The stages in this process are net sales, expenses, ebitda, profit after tax, finecing cost.

Pandl Kpis Tabular Form Ppt PowerPoint Presentation Outline Background
This is a pandl kpis tabular form ppt powerpoint presentation outline background. This is a four stage process. The stages in this process are net sales, expenses, ebitda, profit before tax, profit after tax.

Revenue Streams Template 3 Ppt PowerPoint Presentation Slides Introduction
This is a revenue streams template 3 ppt powerpoint presentation slides introduction. This is a six stage process. The stages in this process are advertising, sales commission, subscription, affiliate, feature listening.
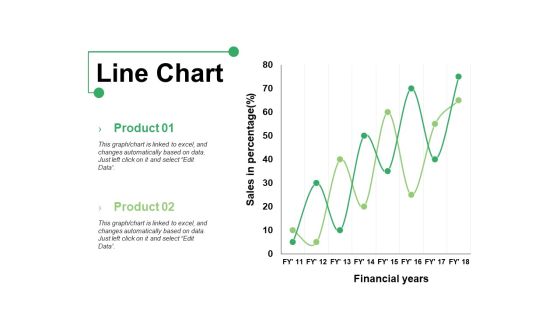
Line Chart Ppt PowerPoint Presentation Show Graphics Example
This is a line chart ppt powerpoint presentation show graphics example. This is a two stage process. The stages in this process are product, line chart, financial years, sales in percentage.

Bar Chart Ppt PowerPoint Presentation Infographics Format Ideas
This is a bar chart ppt powerpoint presentation infographics format ideas. This is a two stage process. The stages in this process are bar graph, product, financial year, sales in percentage.

Financial Projections P And L Ppt PowerPoint Presentation Summary Backgrounds
This is a financial projections p and l ppt powerpoint presentation summary backgrounds. This is a four stage process. The stages in this process are net sales, expenses, other expenses, profit after tax, pat.

Column Chart Ppt PowerPoint Presentation Show Structure
This is a column chart ppt powerpoint presentation show structure. This is a two stage process. The stages in this process are business, financial year in, sales in percentage, marketing, graph.

Financial Projections Pandl Ppt PowerPoint Presentation File Example File
This is a financial projections pandl ppt powerpoint presentation file example file. This is a four stage process. The stages in this process are net sales, expenses, ebitda, profit after tax, business.
Pandl Kpis Tabular Form Ppt PowerPoint Presentation Icon
This is a pandl kpis tabular form ppt powerpoint presentation icon. This is a four stage process. The stages in this process are business, net sales, total income, expenses, profit before tax, profit after tax.
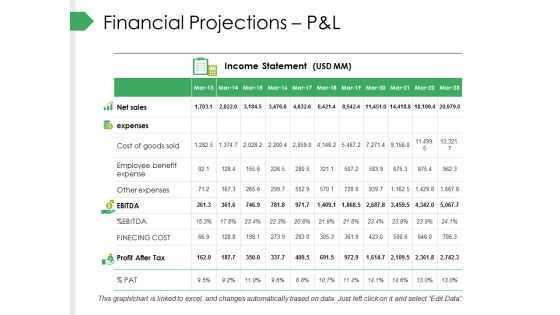
Financial Projections Pandl Ppt PowerPoint Presentation Visual Aids Professional
This is a financial projections pandl ppt powerpoint presentation visual aids professional. This is a four stage process. The stages in this process are net sales, expenses, ebitda, profit after tax, business.
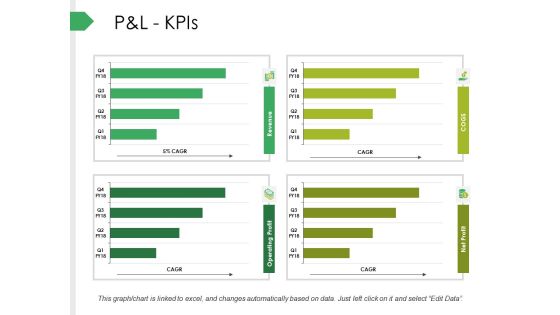
P And L Kpis Ppt PowerPoint Presentation Infographics Background
This is a p and l kpis ppt powerpoint presentation infographics background. This is a four stage process. The stages in this process are net sales, expenses, ebitda, profit before tax, profit after tax.

Business Transformation Template Ppt PowerPoint Presentation Layouts Styles
This is a business transformation template ppt powerpoint presentation layouts styles. This is a three stage process. The stages in this process are reduce complexity, shared services, data management, sales marketing, improve execution.

Line Chart Ppt PowerPoint Presentation Professional Grid
This is a line chart ppt powerpoint presentation professional grid. This is a two stage process. The stages in this process are sales in percentage, financial years, product, line chart.

Area Chart Ppt PowerPoint Presentation Infographics Graphics Pictures
This is a area chart ppt powerpoint presentation infographics graphics pictures. This is a two stage process. The stages in this process are business, sales in percentage, area chart, marketing, graph.

Financial Projections Pandl Ppt PowerPoint Presentation Outline Grid
This is a financial projections pandl ppt powerpoint presentation outline grid. This is a ten stage process. The stages in this process are net sales, expenses, cost of goods sold, other expenses, financing cost.
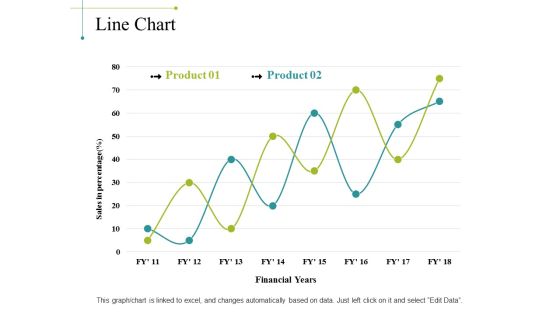
Line Chart Ppt PowerPoint Presentation Portfolio Background Image
This is a line chart ppt powerpoint presentation portfolio background image. This is a two stage process. The stages in this process are sales in percentage, financial years, chart, business, marketing, finance.

Revenue Streams Ppt PowerPoint Presentation Gallery Graphic Images
This is a revenue streams ppt powerpoint presentation gallery graphic images. This is a six stage process. The stages in this process are advertising, sales commission, subscription, affiliate, sponsored content.

Revenue Streams Ppt PowerPoint Presentation Infographic Template Graphics Template
This is a revenue streams ppt powerpoint presentation infographic template graphics template. This is a six stage process. The stages in this process are advertising, sales commission, subscription, affiliate, sponsored content.

Quality Cost Report Ppt PowerPoint Presentation Tips
This is a quality cost report ppt powerpoint presentation tips. This is a two stage process. The stages in this process are types of cost, quality cost, percentage of sales.
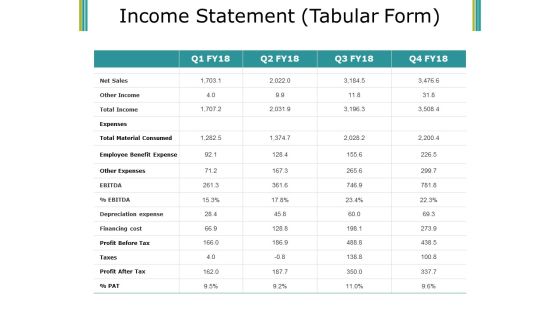
Income Statement Ppt PowerPoint Presentation Layouts Show
This is a income statement ppt powerpoint presentation layouts show. This is a four stage process. The stages in this process are net sales, expenses, total income, texas, profit after tax.

Financial Projections Pandl Ppt PowerPoint Presentation Portfolio Sample
This is a financial projections pandl ppt powerpoint presentation portfolio sample. This is a ten stage process. The stages in this process are net sales, expenses, cost of goods sold, employee benefit expense, other expenses.

Area Chart Ppt PowerPoint Presentation Ideas Professional
This is a area chart ppt powerpoint presentation ideas professional. This is a two stage process. The stages in this process are business, sales in percentage, area chart, marketing, finance.

Financial Projections Income Statement Ppt PowerPoint Presentation Outline Designs Download
This is a financial projections income statement ppt powerpoint presentation outline designs download. This is a one stage process. The stages in this process are net sales, expenses, cost of goods sold, employee benefit expense, other expenses.
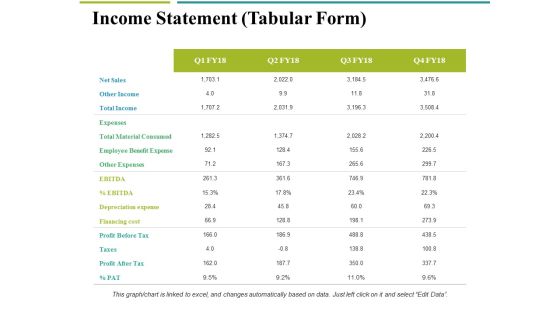
Income Statement Tabular Form Ppt PowerPoint Presentation Inspiration Examples
This is a income statement tabular form ppt powerpoint presentation inspiration examples. This is a four stage process. The stages in this process are net sales, other income, total income, expenses, total material consumed.

Area Chart Ppt PowerPoint Presentation Inspiration Graphics
This is a area chart ppt powerpoint presentation inspiration graphics. This is a two stage process. The stages in this process are product, area chart, business, growth, sales in percentage.
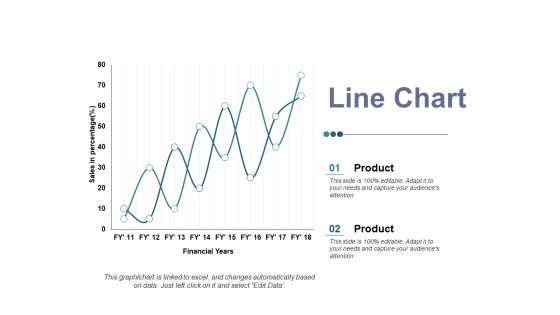
Line Chart Ppt PowerPoint Presentation Ideas Elements
This is a line chart ppt powerpoint presentation ideas elements. This is a two stage process. The stages in this process are product, sales in percentage, financial year, business, line chart.

Area Chart Ppt PowerPoint Presentation Icon Aids
This is a area chart ppt powerpoint presentation icon aids. This is a three stage process. The stages in this process are financial years, sales in percentage, business, marketing, graph.

Bar Chart Ppt PowerPoint Presentation Summary Themes
This is a bar chart ppt powerpoint presentation summary themes. This is a three stage process. The stages in this process are financial years, sales in percentage, business, marketing, graph.

Combo Chart Ppt PowerPoint Presentation Gallery Design Ideas
This is a combo chart ppt powerpoint presentation gallery design ideas. This is a three stage process. The stages in this process are business, financial years, sales in percentage, finance, graph.

Identifying Key Business And It Drivers Ppt PowerPoint Presentation Ideas Files
This is a identifying key business and it drivers ppt powerpoint presentation ideas files. This is a three stage process. The stages in this process are increase sales and shares, improve profit, manage risks, business, management.

Demand Creation Process Ppt PowerPoint Presentation Design Templates
This is a demand creation process ppt powerpoint presentation design templates. This is a twelve stage process. The stages in this process are market sizing, metrics, sales tools, demand management, automation, offers, contacts.

Demand Creation Template Ppt PowerPoint Presentation Infographics Styles
This is a demand creation template ppt powerpoint presentation infographics styles. This is a three stage process. The stages in this process are demand creation, winning opportunities, account management, sales process.

Demand Creation Template Ppt PowerPoint Presentation Slides Clipart
This is a demand creation template ppt powerpoint presentation slides clipart. This is a three stage process. The stages in this process are demand creation, winning opportunities, account management, sales process.
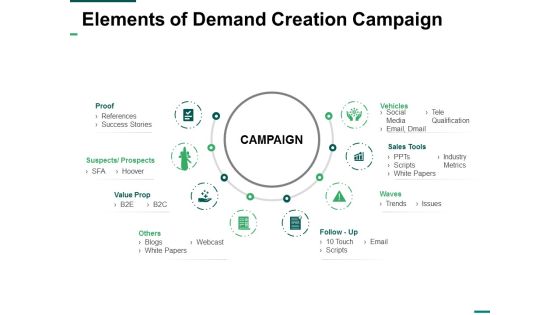
Elements Of Demand Creation Campaign Ppt PowerPoint Presentation Slides Aids
This is a elements of demand creation campaign ppt powerpoint presentation slides aids. This is a eight stage process. The stages in this process are proof, vehicles, sales tools, waves, value prop.

Line Chart Ppt PowerPoint Presentation Infographic Template Master Slide
This is a line chart ppt powerpoint presentation infographic template master slide. This is a two stage process. The stages in this process are product, financial years, sales in percentage.

Bar Chart Ppt PowerPoint Presentation Layouts Template
This is a bar chart ppt powerpoint presentation layouts template. This is a two stage process. The stages in this process are financial year, sales in percentage, business, marketing, finance.

Bar Chart Ppt PowerPoint Presentation Slides Example File
This is a bar chart ppt powerpoint presentation slides example file. This is a two stage process. The stages in this process are product, financial years, sales in percentage.
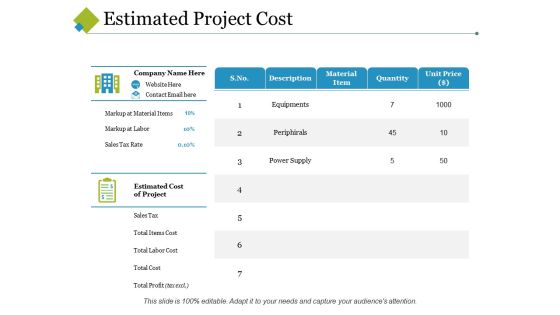
Estimated Project Cost Ppt PowerPoint Presentation Slides Format Ideas
This is a estimated project cost ppt powerpoint presentation slides format ideas. This is a seven stage process. The stages in this process are description, material item, quantity, markup at labor, sales tax, equipment.

Bar Graph Ppt PowerPoint Presentation Layouts Influencers
This is a bar graph ppt powerpoint presentation layouts influencers. This is a two stage process. The stages in this process are business, marketing, in bar graph, sales in percentage, finance.
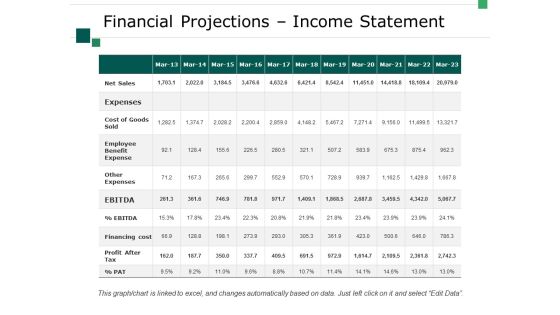
Financial Projections Income Statement Ppt PowerPoint Presentation Pictures Design Inspiration
This is a financial projections income statement ppt powerpoint presentation pictures design inspiration. This is a one stage process. The stages in this process are business, net sales, expenses, cost of goods sold, employee benefit expense, other expenses, financing cost.
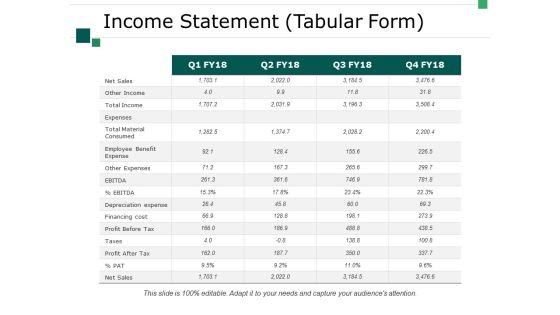
Income Statement Tabular Form Ppt PowerPoint Presentation Model Show
This is a income statement tabular form ppt powerpoint presentation model show. This is a four stage process. The stages in this process are business, marketing, net sales, other income, total income.

Bar Graph Ppt PowerPoint Presentation Portfolio Slide Portrait
This is a bar graph ppt powerpoint presentation portfolio slide portrait. This is a three stage process. The stages in this process are product, sales in percentage, bar graph, growth, success.

Area Chart Ppt PowerPoint Presentation Inspiration Background Designs
This is a area chart ppt powerpoint presentation inspiration background designs. This is a two stage process. The stages in this process are business, sales in percentage, area chart, marketing, finance.

Brand Performance Dashboard Ppt PowerPoint Presentation Infographic Template Designs
This is a brand performance dashboard ppt powerpoint presentation infographic template designs. This is a three stage process. The stages in this process are customer recognition, enhanced sales, competitive edge.
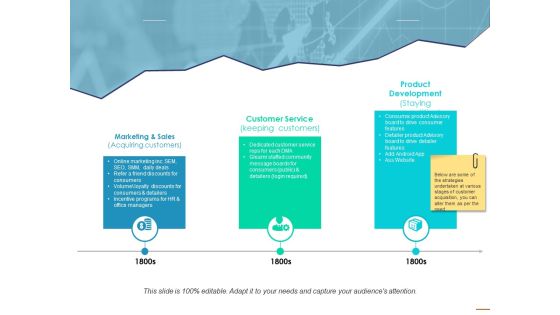
Marketing Growth Strategy Ppt PowerPoint Presentation Layouts Design Templates
This is a marketing growth strategy ppt powerpoint presentation layouts design templates. This is a three stage process. The stages in this process are marketing and sales, customer service, product development, staying, keeping customers.
