AI PPT Maker
Templates
PPT Bundles
Design Services
Business PPTs
Business Plan
Management
Strategy
Introduction PPT
Roadmap
Self Introduction
Timelines
Process
Marketing
Agenda
Technology
Medical
Startup Business Plan
Cyber Security
Dashboards
SWOT
Proposals
Education
Pitch Deck
Digital Marketing
KPIs
Project Management
Product Management
Artificial Intelligence
Target Market
Communication
Supply Chain
Google Slides
Research Services
 One Pagers
All Categories
-
Home
- Customer Favorites
- Data
Data

Data Statistics Charts And Key Performance Indicators Ppt Powerpoint Presentation Layouts Guide
This is a data statistics charts and key performance indicators ppt powerpoint presentation layouts guide. This is a four stage process. The stages in this process are business metrics, business kpi, business dashboard.
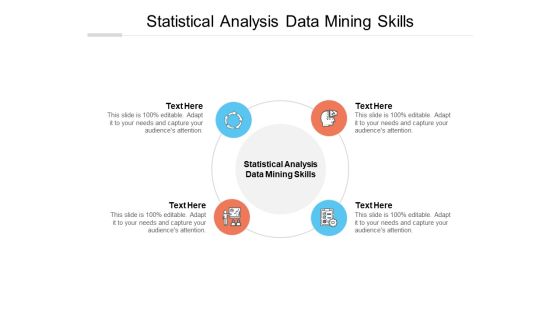
Statistical Analysis Data Mining Skills Ppt PowerPoint Presentation Slides Grid Cpb
Presenting this set of slides with name statistical analysis data mining skills ppt powerpoint presentation slides grid cpb. This is an editable Powerpoint four stages graphic that deals with topics like statistical analysis data mining skills to help convey your message better graphically. This product is a premium product available for immediate download and is 100 percent editable in Powerpoint. Download this now and use it in your presentations to impress your audience.
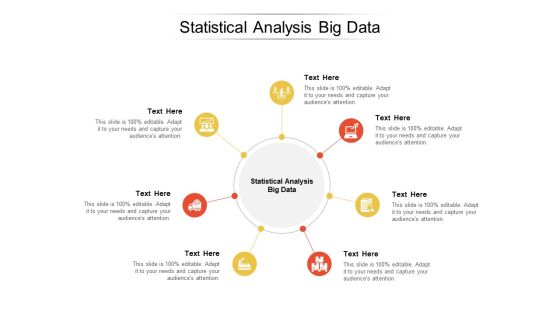
Statistical Analysis Big Data Ppt PowerPoint Presentation Summary Master Slide Cpb
Presenting this set of slides with name statistical analysis big data ppt powerpoint presentation summary master slide cpb. This is an editable Powerpoint seven stages graphic that deals with topics like statistical analysis big data to help convey your message better graphically. This product is a premium product available for immediate download and is 100 percent editable in Powerpoint. Download this now and use it in your presentations to impress your audience.

Manager Analyzing Statistical Data On Tablet Ppt PowerPoint Presentation Inspiration Graphics Download PDF
Persuade your audience using this manager analyzing statistical data on tablet ppt powerpoint presentation inspiration graphics download pdf. This PPT design covers three stages, thus making it a great tool to use. It also caters to a variety of topics including manager analyzing statistical data on tablet. Download this PPT design now to present a convincing pitch that not only emphasizes the topic but also showcases your presentation skills.
Icon Showing Transformation Shift Of Digital Data With Statistics Ppt PowerPoint Presentation Diagram PDF
Persuade your audience using this Icon Showing Transformation Shift Of Digital Data With Statistics Ppt PowerPoint Presentation Diagram PDF. This PPT design covers three stages, thus making it a great tool to use. It also caters to a variety of topics including Icon Showing Transformation Shift, Digital Data With Statistics. Download this PPT design now to present a convincing pitch that not only emphasizes the topic but also showcases your presentation skills.

Predictive Analytics In The Age Of Big Data Introduction To Predictive Analytics Technology Background PDF
This slide represents the predictive analytics introduction that is used for forecasts action, behaviors, and trends using recent and past information. It performs the operations such as data mining, text analytics, statistics, and modeling on structured and unstructured data. Get a simple yet stunning designed Predictive Analytics In The Age Of Big Data Introduction To Predictive Analytics Technology Background PDF. It is the best one to establish the tone in your meetings. It is an excellent way to make your presentations highly effective. So, download this PPT today from Slidegeeks and see the positive impacts. Our easy to edit Predictive Analytics In The Age Of Big Data Introduction To Predictive Analytics Technology Background PDF can be your go to option for all upcoming conferences and meetings. So, what are you waiting for Grab this template today.
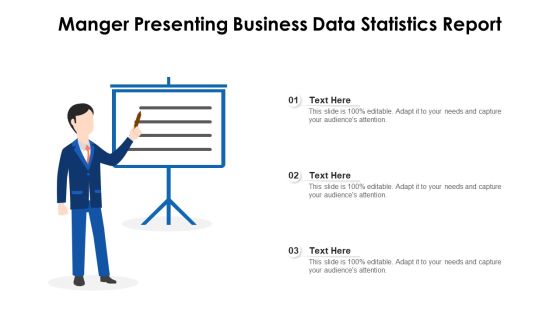
Manger Presenting Business Data Statistics Report Ppt PowerPoint Presentation File Images PDF
Persuade your audience using this manger presenting business data statistics report ppt powerpoint presentation file images pdf. This PPT design covers three stages, thus making it a great tool to use. It also caters to a variety of topics including manger presenting business data statistics report. Download this PPT design now to present a convincing pitch that not only emphasizes the topic but also showcases your presentation skills.

Transformation Toolkit Competitive Intelligence Information Analysis Key Essential Features Of Data Analytics Tools Formats PDF
The slide elaborates the key features of Data Analytics software which are required to improve business results. The features includes easy raw data processing, scalability, and technical support etc Formulating a presentation can take up a lot of effort and time, so the content and message should always be the primary focus. The visuals of the PowerPoint can enhance the presenters message, so our Transformation Toolkit Competitive Intelligence Information Analysis Key Essential Features Of Data Analytics Tools Formats PDF was created to help save time. Instead of worrying about the design, the presenter can concentrate on the message while our designers work on creating the ideal templates for whatever situation is needed. Slidegeeks has experts for everything from amazing designs to valuable content, we have put everything into Transformation Toolkit Competitive Intelligence Information Analysis Key Essential Features Of Data Analytics Tools Formats PDF
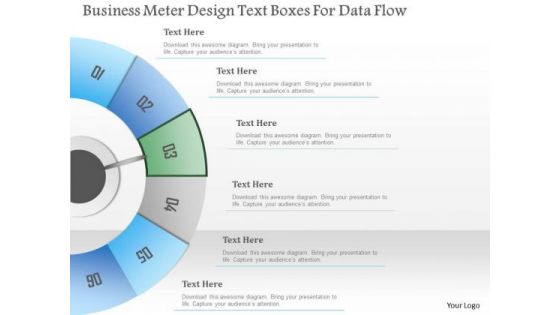
Busines Diagram Business Meter Design Text Boxes For Data Flow Presentation Template
Concept of data flow can be well defined with this exclusive business diagram. This slide contains the diagram of six steps in semi-circle. Use this professional diagram to impress your viewers.
Business Diagram Blue Text Icons For Workflow Of Data Presentation Template
This business diagram displays five text boxes with icons. This slide is useful for data display. Use this blue colored diagram to depict five steps of any business process. It helps in clearly conveying your message to clients and audience.
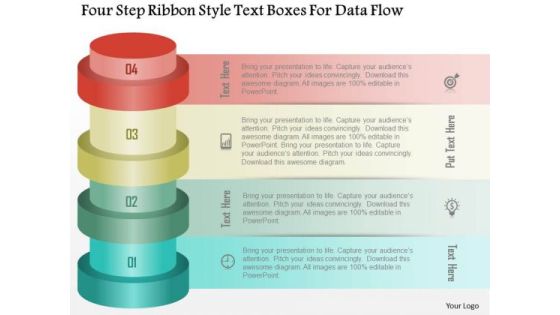
Business Diagram Four Step Ribbon Style Text Boxes For Data Flow PowerPoint Template
Four step ribbon style text boxes are used to craft this power point template. This PPT contains the concept of data flow and representation. Use this PPT diagram for your business and marketing related presentations.
Transformation Toolkit Competitive Intelligence Information Analysis Key Steps For Predictive Data Analytics Project Icons PDF
The slide shows the predictive data analytics process focusing on data analysis, machine learning, predictive modelling and monitoring. Are you searching for a Transformation Toolkit Competitive Intelligence Information Analysis Key Steps For Predictive Data Analytics Project Icons PDF that is uncluttered, straightforward, and original Its easy to edit, and you can change the colors to suit your personal or business branding. For a presentation that expresses how much effort you have put in, this template is ideal With all of its features, including tables, diagrams, statistics, and lists, its perfect for a business plan presentation. Make your ideas more appealing with these professional slides. Download Transformation Toolkit Competitive Intelligence Information Analysis Key Steps For Predictive Data Analytics Project Icons PDF from Slidegeeks today.

Transformation Toolkit Competitive Intelligence Information Analysis Key Requirements For Data Analytics Project Formats PDF
The slide gives an overview of key business elements that are required for data analytics project. It includes information such as business value drivers, data strategy, and decision model etc. The Transformation Toolkit Competitive Intelligence Information Analysis Key Requirements For Data Analytics Project Formats PDF is a compilation of the most recent design trends as a series of slides. It is suitable for any subject or industry presentation, containing attractive visuals and photo spots for businesses to clearly express their messages. This template contains a variety of slides for the user to input data, such as structures to contrast two elements, bullet points, and slides for written information. Slidegeeks is prepared to create an impression.

Business Diagram Four Staged Linear Text Box Diagram For Data Flow PowerPoint Template
Four staged linear text box diagram has been used to craft this power point template. This PPT diagram contains the concept of data flow representation. Use this PPT for education and technology related topics.

Bar Graph Icon For Data Analysis Ppt PowerPoint Presentation Pictures Ideas
This is a bar graph icon for data analysis ppt powerpoint presentation pictures ideas. This is a four stage process. The stages in this process are financial analysis, quantitative, statistical modelling.

Data Analysis Chart For Funds Management Ppt PowerPoint Presentation Infographic Template Files
This is a data analysis chart for funds management ppt powerpoint presentation infographic template files. This is a five stage process. The stages in this process are financial analysis, quantitative, statistical modelling.

Data Chart For Individual Income Analysis Ppt PowerPoint Presentation Layouts Visual Aids
This is a data chart for individual income analysis ppt powerpoint presentation layouts visual aids. This is a five stage process. The stages in this process are financial analysis, quantitative, statistical modelling.

Quantitative Bar Chart For Data Analysis Ppt PowerPoint Presentation Model Graphic Tips
This is a quantitative bar chart for data analysis ppt powerpoint presentation model graphic tips. This is a two stage process. The stages in this process are financial analysis, quantitative, statistical modelling.

Customer Relationship Management Dashboard With Industry Operations Data Statistics Pictures PDF
This slide illustrates graphical representation of statistical data of sales operation. It includes sales pipeline, closed operations, open operations, operations by closing date etc. Pitch your topic with ease and precision using this Customer Relationship Management Dashboard With Industry Operations Data Statistics Pictures PDF. This layout presents information on Sales Pipeline, Insurance, Telecommunic. It is also available for immediate download and adjustment. So, changes can be made in the color, design, graphics or any other component to create a unique layout.

Business Data Statistical Dashboard Vector Icon Ppt PowerPoint Presentation Icon Graphics Template PDF
Persuade your audience using this business data statistical dashboard vector icon ppt powerpoint presentation icon graphics template pdf. This PPT design covers three stages, thus making it a great tool to use. It also caters to a variety of topics including business data statistical dashboard vector icon. Download this PPT design now to present a convincing pitch that not only emphasizes the topic but also showcases your presentation skills.
Statistical Data Icon Of Poll Graph Depicting Elections Result Introduction PDF
Persuade your audience using this statistical data icon of poll graph depicting elections result introduction pdf. This PPT design covers four stages, thus making it a great tool to use. It also caters to a variety of topics including statistical data icon of poll graph depicting elections result. Download this PPT design now to present a convincing pitch that not only emphasizes the topic but also showcases your presentation skills.
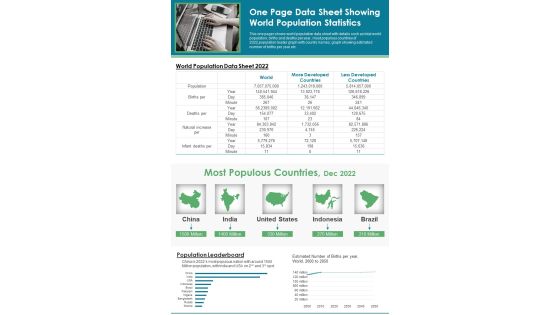
One Page Data Sheet Showing World Population Statistics PDF Document PPT Template
Looking for a predesigned One Page Data Sheet Showing World Population Statistics PDF Document PPT Template Heres the perfect piece for you It has everything that a well-structured one-pager template should have. Besides, it is 100 percent editable, which offers you the cushion to make adjustments according to your preferences. Grab this One Page Data Sheet Showing World Population Statistics PDF Document PPT Template Download now.

Qualitative Analysis Of Interview Data Focus Groups And Content Analysis Ppt PowerPoint Presentation Ideas Guidelines
This is a qualitative analysis of interview data focus groups and content analysis ppt powerpoint presentation ideas guidelines. This is a five stage process. The stages in this process are analysis, observation, qualitative.
Types Statistical Data Ppt PowerPoint Presentation Outline Designs Download Cpb Pdf
Presenting this set of slides with name types statistical data ppt powerpoint presentation outline designs download cpb pdf. This is an editable Powerpoint five stages graphic that deals with topics like data leakage detection to help convey your message better graphically. This product is a premium product available for immediate download and is 100 percent editable in Powerpoint. Download this now and use it in your presentations to impress your audience.
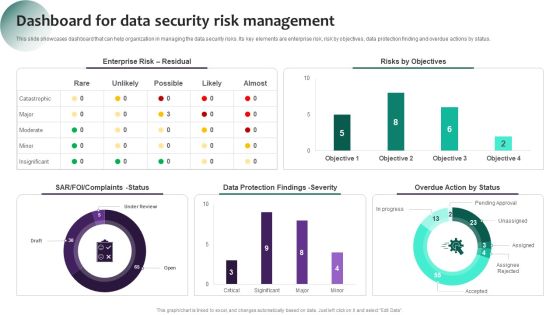
Information Systems Security And Risk Management Plan Dashboard For Data Security Risk Management Information PDF
This slide showcases dashboard that can help organization in managing the data security risks. Its key elements are enterprise risk, risk by objectives, data protection finding and overdue actions by status. If you are looking for a format to display your unique thoughts, then the professionally designed Information Systems Security And Risk Management Plan Dashboard For Data Security Risk Management Information PDF is the one for you. You can use it as a Google Slides template or a PowerPoint template. Incorporate impressive visuals, symbols, images, and other charts. Modify or reorganize the text boxes as you desire. Experiment with shade schemes and font pairings. Alter, share or cooperate with other people on your work. Download Information Systems Security And Risk Management Plan Dashboard For Data Security Risk Management Information PDF and find out how to give a successful presentation. Present a perfect display to your team and make your presentation unforgettable.

Table Of Contents Information Analytics And Ml Strategy Playbook Data Graphics PDF
This is a Table Of Contents Information Analytics And Ml Strategy Playbook Data Graphics PDF template with various stages. Focus and dispense information on one stages using this creative set, that comes with editable features. It contains large content boxes to add your information on topics like Automated Data Analysis, Strategy Playbook, Information. You can also showcase facts, figures, and other relevant content using this PPT layout. Grab it now.

Data Chart For Distribution Of Vehicles By Origin And Type Ppt PowerPoint Presentation Infographics Topics
This is a data chart for distribution of vehicles by origin and type ppt powerpoint presentation infographics topics. This is a four stage process. The stages in this process are financial analysis, quantitative, statistical modelling.
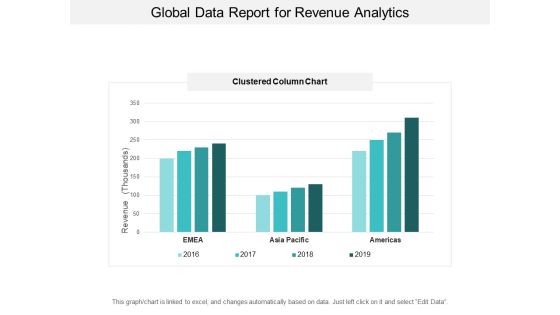
Global Data Report For Revenue Analytics Ppt PowerPoint Presentation Inspiration Visuals
This is a global data report for revenue analytics ppt powerpoint presentation inspiration visuals. This is a four stage process. The stages in this process are financial analysis, quantitative, statistical modelling.
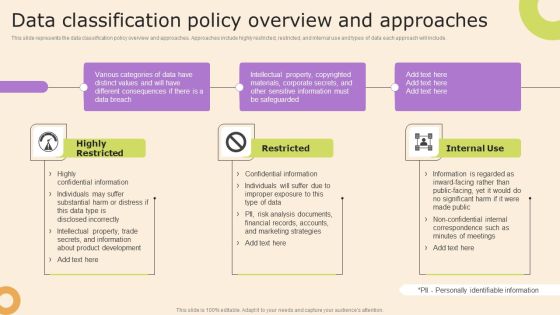
Information Technology Policy And Processes Data Classification Policy Overview And Approaches Structure PDF
This slide represents the data classification policy overview and approaches. Approaches include highly restricted, restricted, and internal use and types of data each approach will include. Find highly impressive Information Technology Policy And Processes Data Classification Policy Overview And Approaches Structure PDF on Slidegeeks to deliver a meaningful presentation. You can save an ample amount of time using these presentation templates. No need to worry to prepare everything from scratch because Slidegeeks experts have already done a huge research and work for you. You need to download Information Technology Policy And Processes Data Classification Policy Overview And Approaches Structure PDF for your upcoming presentation. All the presentation templates are 100 percent editable and you can change the color and personalize the content accordingly. Download now.
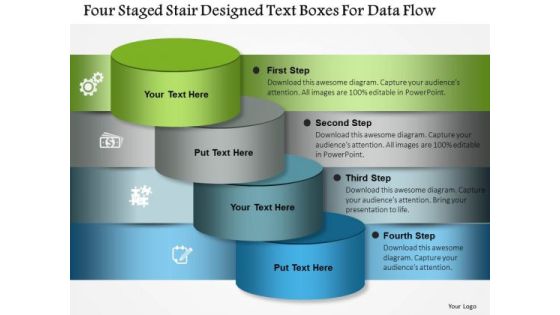
Business Diagram Four Staged Stair Designed Text Boxes For Data Flow Presentation Template
Four staged stair designed text boxes are used to design this power point template. This PPT contains the concept of data flow. Use this PPT for your business and finance related presentations.
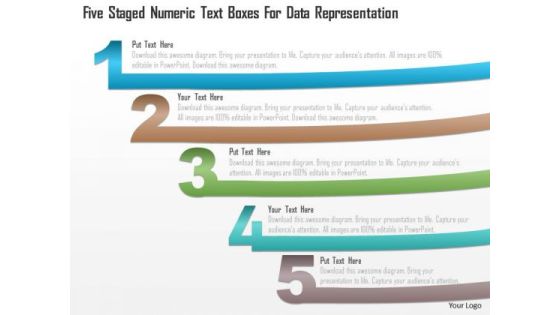
Business Diagram Five Staged Numeric Text Boxes For Data Representation PowerPoint Template
Five staged numeric text boxes diagram has been used to design this power point template. This diagram template contains the concept of data representation. Use this PPT for your business and marketing related presentations.
Business Diagram Four Circular Text Boxes For Data Representation PowerPoint Template
Graphic of four circular text boxes are used to craft this power point template. This PPT contains the concept of data representation. This PPT is suitable for business and marketing related presentations.
Business Diagram Four Staged Text Box With Globe For Data Representation Ppt Template
Four staged text boxes with globe has been used to craft this power point template. This PPT diagram contains the concept of global business agenda and data representation. Use this PPT for business and marketing related presentations.
Business Diagram Human Hand With Credit Card Text Boxes For Data Representation Ppt Template
This power point template has been crafted with graphic of human hand and credit card style text boxes. his PPT diagram contains the concept of data representation. This PPT is suitable for your business and marketing presentations.
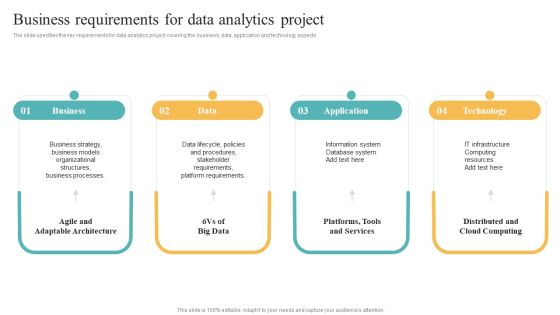
Transformation Toolkit Competitive Intelligence Information Analysis Business Requirements For Data Analytics Project Microsoft PDF
The slide specifies the key requirements for data analytics project covering the business, data, application and technology aspects. Do you have an important presentation coming up Are you looking for something that will make your presentation stand out from the rest Look no further than Transformation Toolkit Competitive Intelligence Information Analysis Business Requirements For Data Analytics Project Microsoft PDF. With our professional designs, you can trust that your presentation will pop and make delivering it a smooth process. And with Slidegeeks, you can trust that your presentation will be unique and memorable. So why wait Grab Transformation Toolkit Competitive Intelligence Information Analysis Business Requirements For Data Analytics Project Microsoft PDF today and make your presentation stand out from the rest.

Transformation Toolkit Competitive Intelligence Information Analysis Industry Data Analytics Value Stream Model Inspiration PDF
This slide shows the data value streams structure that will identify and represent all data sources and methods to transform the ingest information into analytical data for business decision making. Are you in need of a template that can accommodate all of your creative concepts This one is crafted professionally and can be altered to fit any style. Use it with Google Slides or PowerPoint. Include striking photographs, symbols, depictions, and other visuals. Fill, move around, or remove text boxes as desired. Test out color palettes and font mixtures. Edit and save your work, or work with colleagues. Download Transformation Toolkit Competitive Intelligence Information Analysis Industry Data Analytics Value Stream Model Inspiration PDF and observe how to make your presentation outstanding. Give an impeccable presentation to your group and make your presentation unforgettable.
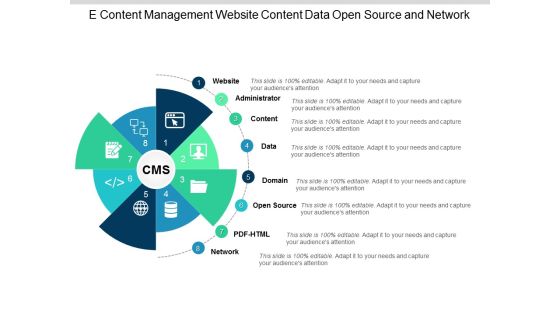
E Content Management Website Content Data Open Source And Network Ppt Powerpoint Presentation Portfolio Deck
This is a e content management website content data open source and network ppt powerpoint presentation portfolio deck. This is a eight stage process. The stages in this process are cms, content management system.
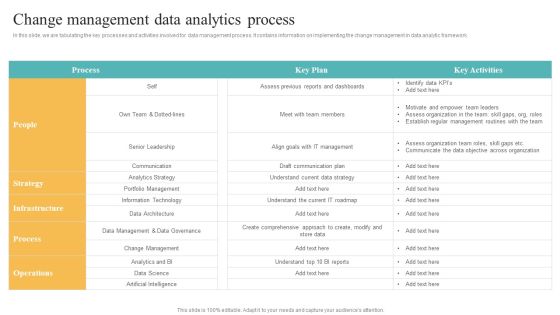
Transformation Toolkit Competitive Intelligence Information Analysis Change Management Data Analytics Process Template PDF
In this slide, we are tabulating the key processes and activities involved for data management process. It contains information on implementing the change management in data analytic framework. Formulating a presentation can take up a lot of effort and time, so the content and message should always be the primary focus. The visuals of the PowerPoint can enhance the presenters message, so our Transformation Toolkit Competitive Intelligence Information Analysis Change Management Data Analytics Process Template PDF was created to help save time. Instead of worrying about the design, the presenter can concentrate on the message while our designers work on creating the ideal templates for whatever situation is needed. Slidegeeks has experts for everything from amazing designs to valuable content, we have put everything into Transformation Toolkit Competitive Intelligence Information Analysis Change Management Data Analytics Process Template PDF

Busines Diagram Five Staged Business Infographics For Data Representation Ppt Template
This business diagram displays five staged business info graphics. This professional diagram text boxes for data representation. Ideas are best expressed easily with the help of this diagram slide.

Transformation Toolkit Competitive Intelligence Information Analysis Data Analytics Value Stream Chain Portrait PDF
This slide illustrates the series of activities required for analyzing the data. It contains information such as data preparation, exploratory analysis, and predictive analytics etc. Find highly impressive Transformation Toolkit Competitive Intelligence Information Analysis Data Analytics Value Stream Chain Portrait PDF on Slidegeeks to deliver a meaningful presentation. You can save an ample amount of time using these presentation templates. No need to worry to prepare everything from scratch because Slidegeeks experts have already done a huge research and work for you. You need to download Transformation Toolkit Competitive Intelligence Information Analysis Data Analytics Value Stream Chain Portrait PDF for your upcoming presentation. All the presentation templates are 100 percent editable and you can change the color and personalize the content accordingly. Download now.
Transformation Toolkit Competitive Intelligence Information Analysis Key Failure Reasons For Data Analytics Project Icons PDF
This slide displays the key reasons for why the data analytics project fails. It includes reasons such as incorrect data, poor communication structure, and conflicting data etc. Coming up with a presentation necessitates that the majority of the effort goes into the content and the message you intend to convey. The visuals of a PowerPoint presentation can only be effective if it supplements and supports the story that is being told. Keeping this in mind our experts created Transformation Toolkit Competitive Intelligence Information Analysis Key Failure Reasons For Data Analytics Project Icons PDF to reduce the time that goes into designing the presentation. This way, you can concentrate on the message while our designers take care of providing you with the right template for the situation.

Transformation Toolkit Competitive Intelligence Information Analysis Data Analytics Software Features Template PDF
This slide represents the key features of predictive data analytics including data mining, data visualization, and modelling etc. Coming up with a presentation necessitates that the majority of the effort goes into the content and the message you intend to convey. The visuals of a PowerPoint presentation can only be effective if it supplements and supports the story that is being told. Keeping this in mind our experts created Transformation Toolkit Competitive Intelligence Information Analysis Data Analytics Software Features Template PDF to reduce the time that goes into designing the presentation. This way, you can concentrate on the message while our designers take care of providing you with the right template for the situation.

Semantic Data Searching Technique Introduction To Semantic Web Technology Introduction PDF
This slide represents the introduction to semantic web technology that makes internet data machine readable. It is the concept of the World Wide Web Consortium W3c, and it can be used to develop web based data stores, define vocabulary, and design data handling rules. This Semantic Data Searching Technique Introduction To Semantic Web Technology Introduction PDF is perfect for any presentation, be it in front of clients or colleagues. It is a versatile and stylish solution for organizing your meetings. The product features a modern design for your presentation meetings. The adjustable and customizable slides provide unlimited possibilities for acing up your presentation. Slidegeeks has done all the homework before launching the product for you. So, do not wait, grab the presentation templates today
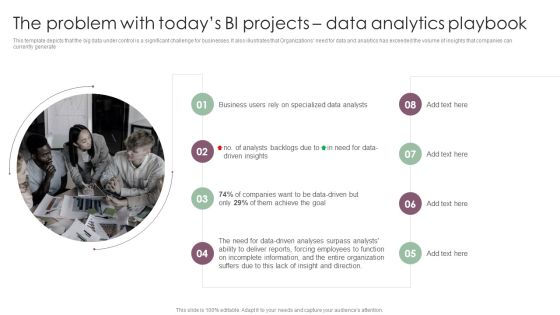
Information Analysis And BI Playbook The Problem With Todays BI Projects Data Analytics Playbook Portrait PDF
This template depicts that the big data under control is a significant challenge for businesses. It also illustrates that Organizations need for data and analytics has exceeded the volume of insights that companies can currently generate. Do you have an important presentation coming up Are you looking for something that will make your presentation stand out from the rest Look no further than Information Analysis And BI Playbook The Problem With Todays BI Projects Data Analytics Playbook Portrait PDF. With our professional designs, you can trust that your presentation will pop and make delivering it a smooth process. And with Slidegeeks, you can trust that your presentation will be unique and memorable. So why wait Grab Information Analysis And BI Playbook The Problem With Todays BI Projects Data Analytics Playbook Portrait PDF today and make your presentation stand out from the rest.

Computer Screen With Pie Chart For Data Analysis Ppt PowerPoint Presentation Show Picture
This is a computer screen with pie chart for data analysis ppt powerpoint presentation show picture. This is a six stage process. The stages in this process are computer icon, desktop icon, laptop screen icon.
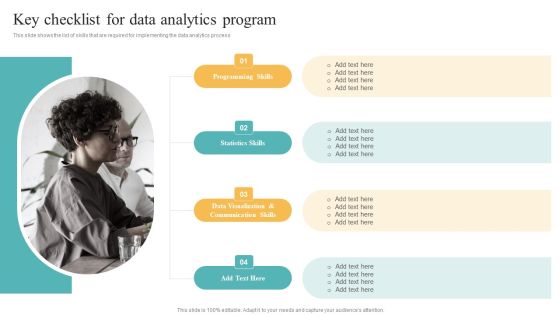
Transformation Toolkit Competitive Intelligence Information Analysis Key Checklist For Data Analytics Program Demonstration PDF
This slide shows the list of skills that are required for implementing the data analytics process Presenting this PowerPoint presentation, titled Transformation Toolkit Competitive Intelligence Information Analysis Key Checklist For Data Analytics Program Demonstration PDF, with topics curated by our researchers after extensive research. This editable presentation is available for immediate download and provides attractive features when used. Download now and captivate your audience. Presenting this Transformation Toolkit Competitive Intelligence Information Analysis Key Checklist For Data Analytics Program Demonstration PDF. Our researchers have carefully researched and created these slides with all aspects taken into consideration. This is a completely customizable Transformation Toolkit Competitive Intelligence Information Analysis Key Checklist For Data Analytics Program Demonstration PDF that is available for immediate downloading. Download now and make an impact on your audience. Highlight the attractive features available with our PPTs.

Information Analysis And BI Playbook Analytics From All The Data At Scale Challenges Slides PDF
This template covers the problems while implementing analytics from all the data, at scale in the organization. The challenges are large and complex data and analytic slowdown. Create an editable Information Analysis And BI Playbook Analytics From All The Data At Scale Challenges Slides PDF that communicates your idea and engages your audience. Whether you are presenting a business or an educational presentation, pre designed presentation templates help save time. Information Analysis And BI Playbook Analytics From All The Data At Scale Challenges Slides PDF is highly customizable and very easy to edit, covering many different styles from creative to business presentations. Slidegeeks has creative team members who have crafted amazing templates. So, go and get them without any delay.

Transformation Toolkit Competitive Intelligence Information Analysis Key Features Of Predictive Data Analytics Software Elements PDF
This slide represents the characteristics of predictive data analytics software. It includes features like predictive modeling, predictive scoring and data mining functions that help companies to get better insights. This Transformation Toolkit Competitive Intelligence Information Analysis Key Features Of Predictive Data Analytics Software Elements PDF is perfect for any presentation, be it in front of clients or colleagues. It is a versatile and stylish solution for organizing your meetings. The Transformation Toolkit Competitive Intelligence Information Analysis Key Features Of Predictive Data Analytics Software Elements PDF features a modern design for your presentation meetings. The adjustable and customizable slides provide unlimited possibilities for acing up your presentation. Slidegeeks has done all the homework before launching the product for you. So, do not wait, grab the presentation templates today.

Transformation Toolkit Competitive Intelligence Information Analysis Mini Charter For Data Analytics Project Download PDF
In this slide, we are highlighting the scope of work for data analytics project. It describes the process, roles and key tasks required to interpret and present the data for a wide range of business applications Whether you have daily or monthly meetings, a brilliant presentation is necessary. Transformation Toolkit Competitive Intelligence Information Analysis Mini Charter For Data Analytics Project Download PDF can be your best option for delivering a presentation. Represent everything in detail using Transformation Toolkit Competitive Intelligence Information Analysis Mini Charter For Data Analytics Project Download PDF and make yourself stand out in meetings. The template is versatile and follows a structure that will cater to your requirements. All the templates prepared by Slidegeeks are easy to download and edit. Our research experts have taken care of the corporate themes as well. So, give it a try and see the results.

Transformation Toolkit Competitive Intelligence Information Analysis Steps To Accomplish Data Analytics Project Slides PDF
The slide illustrates the key fundamental steps of a data analytics project that helps to realize business value from data insights. It starts from raw data preparation to building a machine learning model. Do you know about Slidesgeeks Transformation Toolkit Competitive Intelligence Information Analysis Steps To Accomplish Data Analytics Project Slides PDF These are perfect for delivering any kind od presentation. Using it, create PowerPoint presentations that communicate your ideas and engage audiences. Save time and effort by using our pre designed presentation templates that are perfect for a wide range of topic. Our vast selection of designs covers a range of styles, from creative to business, and are all highly customizable and easy to edit. Download as a PowerPoint template or use them as Google Slides themes.

Incorporating HIS To Enhance Healthcare Services Laboratory Information Management System To Track Data Slides PDF
This slide covers integration of laboratory information management system LIMS to track medical data. It involves electronic data management system, instrument management and SOP compliance. Get a simple yet stunning designed Incorporating HIS To Enhance Healthcare Services Laboratory Information Management System To Track Data Slides PDF. It is the best one to establish the tone in your meetings. It is an excellent way to make your presentations highly effective. So, download this PPT today from Slidegeeks and see the positive impacts. Our easy to edit Incorporating HIS To Enhance Healthcare Services Laboratory Information Management System To Track Data Slides PDF can be your go to option for all upcoming conferences and meetings. So, what are you waiting for Grab this template today.

Big Data Insight For Time Spent Analysis Over Internet Diagram Slides
This is a big data insight for time spent analysis over internet diagram slides. This is a one stage process. The stages in this process are social networking, online shopping, multimedia sites, searches, reading content, emails communication.

Web Based Content Management System Data Administration Ppt Powerpoint Presentation Model Graphics Pictures
This is a web based content management system data administration ppt powerpoint presentation model graphics pictures. This is a eight stage process. The stages in this process are cms, content management system.

Business Diagram Tip Of Iceberg Big Data Problems And Analysis Ppt Slide
This PowerPoint template has been designed with graphic of iceberg diagram. This diagram slide depicts concept of big data problem and analysis Download this diagram to create professional presentations.
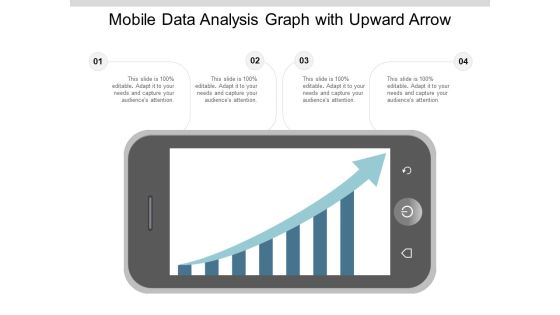
Mobile Data Analysis Graph With Upward Arrow Ppt PowerPoint Presentation Summary Styles
This is a mobile data analysis graph with upward arrow ppt powerpoint presentation summary styles. This is a four stage process. The stages in this process are mobile analytics, mobile tracking, mobile web analytics.
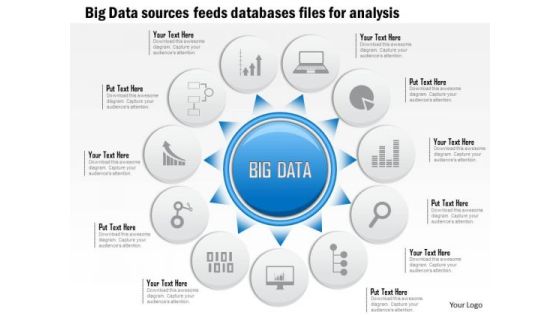
Business Diagram Big Data Sources Sensors Feeds Databases Files For Analysis Ppt Slide
This slide has been designed with graphic of circular source diagram. This diagram contains the concept of data source sensors and feeds of database files. Download this editable slide to build an exclusive presentation for your viewers.
Busines Diagram 3d Four Paper Clip For Data Representation Presentation Template
This business diagram displays 3d paper clips with four text boxes. This editable text boxes diagram can be used for data representation. Use this slide to make professional presentations.
Business Diagram Four Staged Pencil Infographics For Data Representation PowerPoint Template
Four staged pencil info graphics has been used to design this power point template. This diagram template contains the concept of data representations. Use this PPT for your business and marketing presentations.

Business Diagram 3 Vs Of Big Data Showing Challenges And Complexity Of Analysis Ppt Slide
Explain the complexity and analysis with this unique PowerPoint template. This technology diagram contains the graphic of three V's to display data complexity. Use this diagram to make professional presentations.

Data Cleansing Process Flow For Duplicate Leads Enhancing Client Lead Conversion Rates Infographics PDF
This slide covers the data cleansing workflow. It includes steps such as initiating contact through lead channel, receiving lead data in system, reassigning lead to appropriate owner, managing lead through defined process, etc. Formulating a presentation can take up a lot of effort and time, so the content and message should always be the primary focus. The visuals of the PowerPoint can enhance the presenters message, so our Data Cleansing Process Flow For Duplicate Leads Enhancing Client Lead Conversion Rates Infographics PDF was created to help save time. Instead of worrying about the design, the presenter can concentrate on the message while our designers work on creating the ideal templates for whatever situation is needed. Slidegeeks has experts for everything from amazing designs to valuable content, we have put everything into Data Cleansing Process Flow For Duplicate Leads Enhancing Client Lead Conversion Rates Infographics PDF.
