Data

How To Overcome Analytics From All The Data At Scale Challenges Topics PDF
This template illustrates that the high performance computation engine of the analytics software company, the data platform connects to various data sources, automates the data preparation workflow, and scales to big data scenarios. Deliver and pitch your topic in the best possible manner with this How To Overcome Analytics From All The Data At Scale Challenges Topics PDF. Use them to share invaluable insights on Purchases, Marketing, Data Pipeline and impress your audience. This template can be altered and modified as per your expectations. So, grab it now.
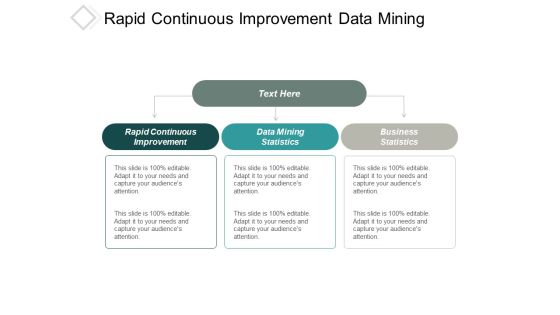
Rapid Continuous Improvement Data Mining Statistics Business Statistics Ppt PowerPoint Presentation Pictures Introduction
This is a rapid continuous improvement data mining statistics business statistics ppt powerpoint presentation pictures introduction. This is a three stage process. The stages in this process are rapid continuous improvement, data mining statistics, business statistics.
Big Data Information Architecture Ppt PowerPoint Presentation Complete Deck With Slides
This is a big data information architecture ppt powerpoint presentation complete deck with slides. This is a one stage process. The stages in this process are big data, information, architecture, process, technology, business.
Business Diagram Creative Sign With Highway Sign Text Big Data Next Exit Ppt Slide
This diagram has been designed with graphic of magnifier and text boxes. These boxes are used to display creative sign and highway sign for big data analysis. This diagram can be used for data related topics in any presentation.

Updates Data Sources Three Text Tags With Circle Ppt PowerPoint Presentation Gallery Guidelines
This is a updates data sources three text tags with circle ppt powerpoint presentation gallery guidelines. This is a three stage process. The stages in this process are data feed, web feed, information feed.
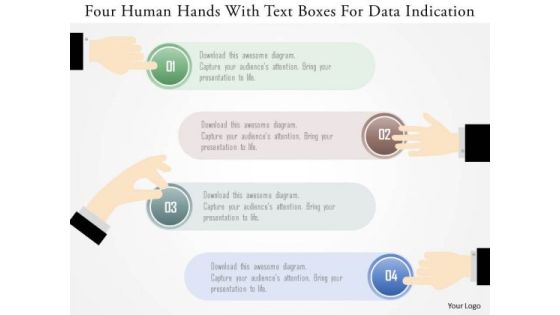
Business Diagram Four Human Hands With Text Boxes For Data Indication Ppt Template
Graphic of four human hands with text boxes are used to design this power point template. This PPT contains the concept of data indication. Use this PPT for your data related topics in any presentation.

Business Diagram Three Staged Key Text Diagram For Data Representation PowerPoint Template
Three staged key and text diagram has been used to design this power point template. This PPT contains the concept of data representation. Use this PPT diagram to represent the marketing and business data in any presentation.

Business Diagram Four Staged Circular Text Box For Data Representation Presentation Template
Graphic of four staged circular text boxes are used to decorate this PPT slide. This PPT slide contains the concept of data analysis and representation. Use this PPT slide for business data analysis related topics.

Business Diagram Four Staged Business Text Boxes For Data Representation Presentation Template
Four staged business text boxes are used to design this Power Point template slide. This PPT slide contains the concept of data representation. Use this PPT slide for your business and sales data analysis related topics in any presentation.

Business Diagram Seven Linear Text Boxes For Data Representation Process Diagram Presentation Templa
Seven staged linear text boxes are used to design this Power Point template slide. This PPT slide contains the concept of data representation. Use this PPT slide and make an exclusive presentation for data related topics.

Business Diagram Four Staged Colored Text Boxes For Data Flow Presentation Template
Four staged colored text boxes are used to craft this power point template. This PPT contains the concept of data flow and its techniques. Use this PPT for your data related topics in any presentation.
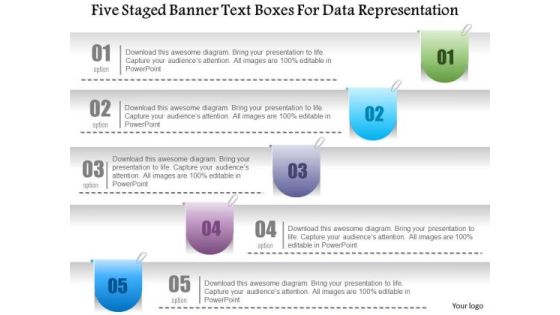
Business Diagram Five Staged Banner Text Boxes For Data Representation PowerPoint Template
Five staged banner style text boxes are used to design this power point template. This PPT contains the concept of data representation. Use this PPT slide for your data and business related presentations.
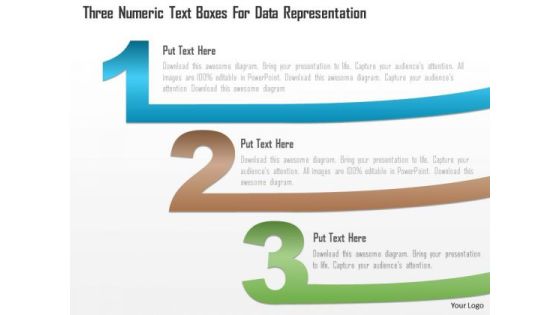
Business Diagram Three Numeric Text Boxes For Data Representation PowerPoint Template
Three numeric text boxes are used to develop this power point template. This PPT slide contains the concept of data representation. Display any kind of data in your presentation by using this exclusive template.
Business Diagram Five Staged Linear Infographics With Icons For Data Representation Ppt Template
Five staged linear info graphics with icons has been used to craft this power point template. This diagram template contains the concept of data representation. Use this PPT for your business and marketing data related topics in any presentations.

Market Research Process Roadmap Data Analysis Risk Management Ppt PowerPoint Presentation Summary Information
This is a market research process roadmap data analysis risk management ppt powerpoint presentation summary information. This is a five stage process. The stages in this process are market research, process roadmap, data analysis, risk management.
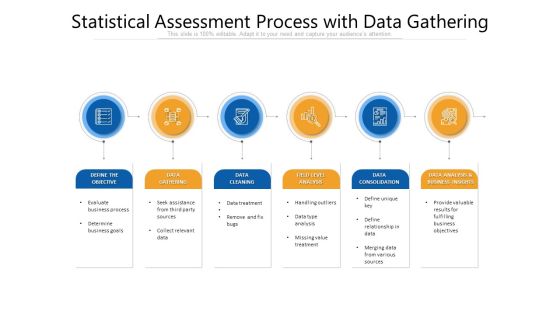
Statistical Assessment Process With Data Gathering Ppt Infographic Template Picture PDF
Persuade your audience using this statistical assessment process with data gathering ppt infographic template picture pdf. This PPT design covers six stages, thus making it a great tool to use. It also caters to a variety of topics including data gathering, data cleaning, data consolidation, objective, business insights. Download this PPT design now to present a convincing pitch that not only emphasizes the topic but also showcases your presentation skills.

Business Diagram Map Shuffle Reduce Phases Shown In Big Data Analytic Processing Ppt Slide
This technology slide has been designed with graphic of map and data text. This diagram helps to depict concept of data analysis and processing. Use this diagram slide for computer technology related presentations.
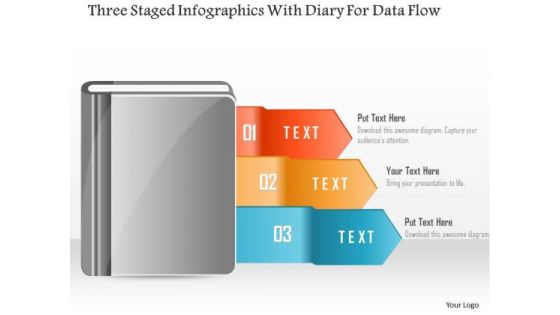
Business Diagram Three Staged Infographics With Diary For Data Flow PowerPoint Template
Three staged info graphic with diary has been used to design this power point template. This PPT contains the concept of data flow. Use this PPT diagram to represent the marketing and business data in any presentation.

Development Leadership Program Research Data Analysis Liquidation Value Ppt PowerPoint Presentation File Graphics Example
This is a development leadership program research data analysis liquidation value ppt powerpoint presentation file graphics example. This is a four stage process. The stages in this process are development leadership program, research data analysis, liquidation value.

Computer Screen With Data Analysis Vector Icon Ppt PowerPoint Presentation Slides Clipart Cpb
This is a computer screen with data analysis vector icon ppt powerpoint presentation slides clipart cpb. This is a four stage process. The stages in this process are data analysis, analytics architecture, analytics framework.

Kaizen Action Plan Data Collection And Analysis Techniques Ppt PowerPoint Presentation Complete Deck With Slides
This is a kaizen action plan data collection and analysis techniques ppt powerpoint presentation complete deck with slides. This is a one stage process. The stages in this process are action plan, kaizen, data management, analysis, technology.

Data Comparison And Analysis Chart Ppt Powerpoint Presentation File Background Images
This is a data comparison and analysis chart ppt powerpoint presentation file background images. This is a four stage process. The stages in this process are data presentation, content presentation, information presentation.

Business Diagram Technology Predictive Data Analytics Networking Social Icons Ppt Slide
This technology diagram slide has been designed with graphic of data icons. These icons may be used to displays the data analytics and social media networking. Use this PPT slide for networking and technology related presentations.

Business Diagram Colored 3d Flow Chart For Data Processing Presentation Template
Colored 3d flow chart has been used to design this power point template. This PPT contains the concept of data processing. Use this PPT for your data communication and analysis related presentations.

Data Feed News And Information With Icons Ppt PowerPoint Presentation Pictures Master Slide
This is a data feed news and information with icons ppt powerpoint presentation pictures master slide. This is a two stage process. The stages in this process are data feed, web feed, information feed.
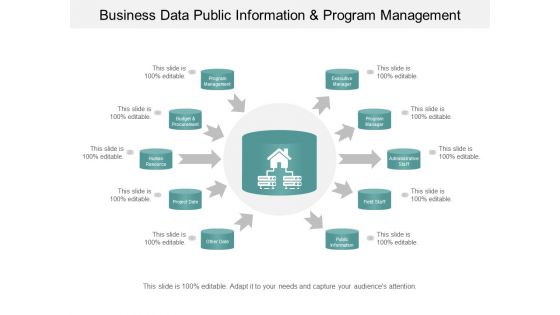
Business Data Public Information And Program Management Ppt PowerPoint Presentation File Deck
This is a business data public information and program management ppt powerpoint presentation file deck. This is a ten stage process. The stages in this process are transform and load, data wore housing, etl, extract.

Dissertation Data Presentation Structure And Analysis Ppt PowerPoint Presentation Complete Deck With Slides
This is a dissertation data presentation structure and analysis ppt powerpoint presentation complete deck with slides. This is a one stage process. The stages in this process are dissertation, data, presentation, structure, analysis.
Core Competency Analysis Agile Data Modelling Outsourcing Employee Ppt PowerPoint Presentation Infographics Icons
This is a core competency analysis agile data modelling outsourcing employee ppt powerpoint presentation infographics icons. This is a three stage process. The stages in this process are core competency analysis, agile data modelling, outsourcing employee.

Product Planning Tool Data Quality Analysis Financial Management Ppt PowerPoint Presentation Styles Graphics Template
This is a product planning tool data quality analysis financial management ppt powerpoint presentation styles graphics template. This is a five stage process. The stages in this process are product planning tool, data quality analysis, financial management.
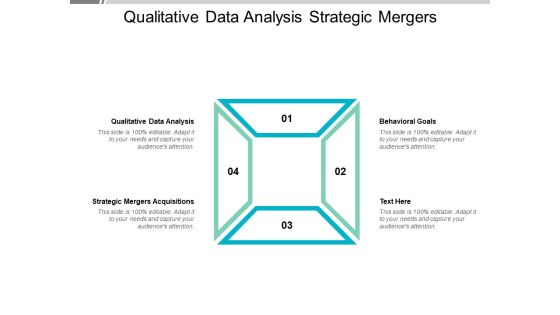
Qualitative Data Analysis Strategic Mergers Acquisitions Behavioural Goals Ppt PowerPoint Presentation Ideas Guidelines
This is a qualitative data analysis strategic mergers acquisitions behavioural goals ppt powerpoint presentation ideas guidelines. This is a four stage process. The stages in this process are qualitative data analysis, strategic mergers acquisitions, behavioural goals.

Market Research Data Analysis Methods Ppt PowerPoint Presentation Pictures Clipart Images Cpb
This is a market research data analysis methods ppt powerpoint presentation pictures clipart images cpb. This is a three stage process. The stages in this process are market research data analysis methods.

Data Analysis Collection Integration And Visualization Ppt PowerPoint Presentation Summary Graphics Tutorials Cpb
This is a data analysis collection integration and visualization ppt powerpoint presentation summary graphics tutorials cpb. This is a six stage process. The stages in this process are data analysis, analytics architecture, analytics framework.

Data Integration Analysis Visualization And Alerting Ppt PowerPoint Presentation Gallery Deck Cpb
This is a data integration analysis visualization and alerting ppt powerpoint presentation gallery deck cpb. This is a six stage process. The stages in this process are data analysis, analytics architecture, analytics framework.
Financial Charts Data Analysis Vector Icon Ppt PowerPoint Presentation Visual Aids Summary Cpb
This is a financial charts data analysis vector icon ppt powerpoint presentation visual aids summary cpb. This is a three stage process. The stages in this process are data analysis, analytics architecture, analytics framework.
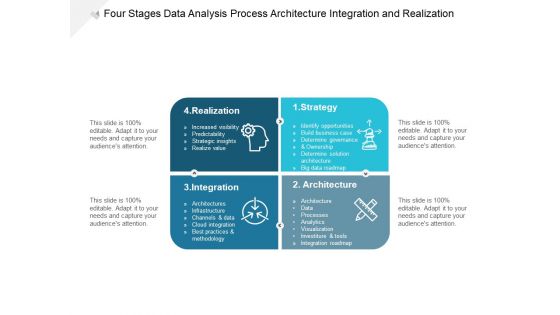
Four Stages Data Analysis Process Architecture Integration And Realization Ppt PowerPoint Presentation Pictures Templates Cpb
This is a four stages data analysis process architecture integration and realization ppt powerpoint presentation pictures templates cpb. This is a four stage process. The stages in this process are data analysis, analytics architecture, analytics framework.

Seven Stages Web Data Analysis Identify Key Performance Indicators Ppt PowerPoint Presentation Infographics Example Topics Cpb
This is a seven stages web data analysis identify key performance indicators ppt powerpoint presentation infographics example topics cpb. This is a seven stage process. The stages in this process are data analysis, analytics architecture, analytics framework.
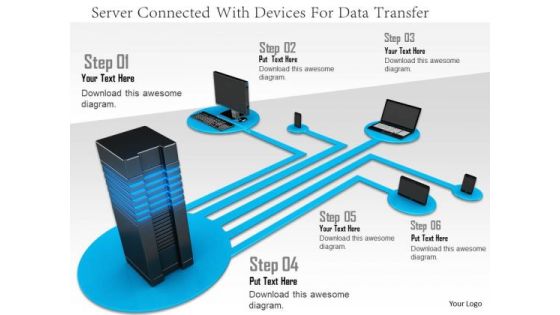
Stock Photo Server Connected With Devices For Data Transfer PowerPoint Slide
In this Power Point template server is connected with devices. This image template contains the concept of data sharing and transfer. Use this PPT in your data technology related presentations.

Circular Diagram To Show Phases Of Big Data Analysis Ppt PowerPoint Presentation Infographic Template
This is a circular diagram to show phases of big data analysis ppt powerpoint presentation infographic template. This is a five stage process. The stages in this process are big data, icons, management, strategy, business.

Business Data Analysis Inventory And Accounts Payable Days Ppt PowerPoint Presentation Layouts Professional
This is a business data analysis inventory and accounts payable days ppt powerpoint presentation layouts professional. This is a three stage process. The stages in this process are business analytics, ba, organizations data.

Information Technology Disaster Resilience Plan On-Premises Data Center To Cloud cold Recovery Slides PDF
This slide depicts the on-premise data center to cloud cold recovery reference architecture and how backup would be done from the data center to the cloud.Deliver and pitch your topic in the best possible manner with this Information Technology Disaster Resilience Plan On-Premises Data Center To Cloud cold Recovery Slides PDF.zip. Use them to share invaluable insights on Premises Data, Application Environment, Domain Controller and impress your audience. This template can be altered and modified as per your expectations. So, grab it now.

Behaviour Management Techniques Business Data Processing Sales Management Ppt PowerPoint Presentation Inspiration Template
This is a behaviour management techniques business data processing sales management ppt powerpoint presentation inspiration template. This is a four stage process. The stages in this process are behaviour management techniques, business data processing, sales management.

Long Term Customer Relationship Sales Data Automation Tools Ppt PowerPoint Presentation Ideas Graphics
This is a long term customer relationship sales data automation tools ppt powerpoint presentation ideas graphics. This is a three stage process. The stages in this process are long term customer relationship, sales data automation tools.
Business Diagram 3 Vs Of Big Data Volume Velocity Variety With Icons Ppt Slide
Three Vs of big data has been introduced in this power point template. This diagram presents volume, velocity and variety of big data with icons. Download this diagram to make technology related presentations.

Stock Photo Earth Globe With Pen Drive For Data Transfer PowerPoint Slide
This power point image template has been designed with graphic of earth globe and pen drive. This image template contains the concept of data transfer. This image template can be used for data and global technology related presentations.

Stock Photo 3d Lifesaving Ring And Data Folder For Safety PowerPoint Slide
This PowerPoint template has been designed with graphic of 3d folder in life saving rings. This image slide contains the concept of data safety. Use this slide for your data storage and safety related topics.
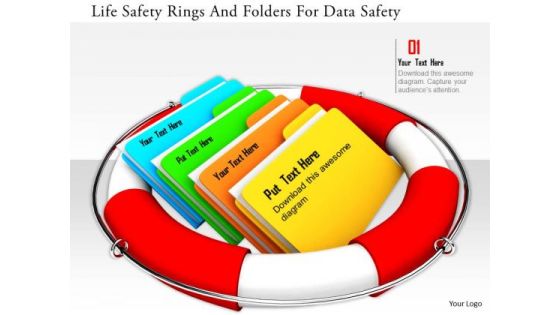
Stock Photo Life Safety Rings And Folders For Data Safety PowerPoint Slide
This PowerPoint template has been designed with graphic of 3d folder in life saving rings. This image slide contains the concept of data safety. Use this slide for your data storage and safety related topics.
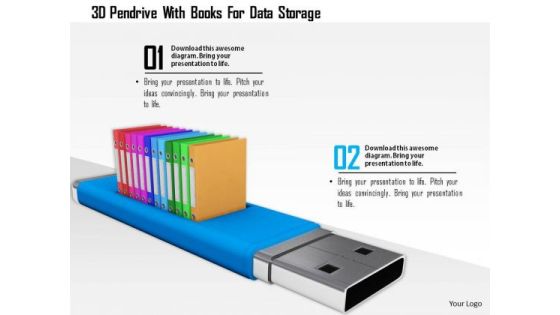
Stock Photo 3d Pendrive With Books For Data Storage PowerPoint Slide
This power point image template has been crafted with graphic of 3d pen drive and books. This PPT contains the concept of data storage. Use this image for your business data storage related topics in any presentations.

Professional Development Motivation Data Masking Techniques Marketing Strategy Ppt PowerPoint Presentation Gallery Format Ideas
This is a professional development motivation data masking techniques marketing strategy ppt powerpoint presentation gallery format ideas. This is a eight stage process. The stages in this process are professional development motivation, data masking techniques, marketing strategy.

Data Life Cycle Management Ppt PowerPoint Presentation Infographic Template Brochure Cpb
This is a data life cycle management ppt powerpoint presentation infographic template brochure cpb. This is a eight stage process. The stages in this process are data life cycle management.
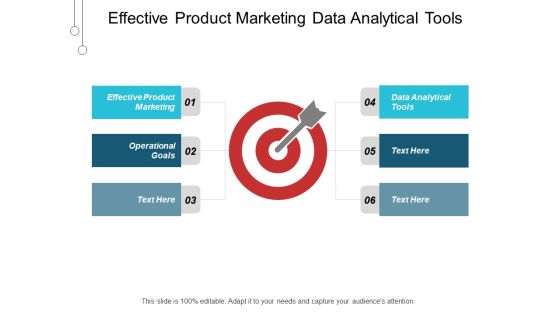
Effective Product Marketing Data Analytical Tools Operational Goals Ppt PowerPoint Presentation Layouts Good
This is a effective product marketing data analytical tools operational goals ppt powerpoint presentation layouts good. This is a six stage process. The stages in this process are effective product marketing, data analytical tools, operational goals.
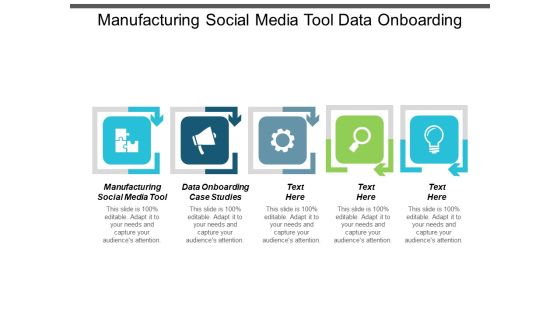
Manufacturing Social Media Tool Data Onboarding Case Studies Ppt PowerPoint Presentation Layouts Background Image
This is a manufacturing social media tool data onboarding case studies ppt powerpoint presentation layouts background image. This is a five stage process. The stages in this process are manufacturing social media tool, data onboarding case studies.

Sales Funnel Management Data Analytics Marketing Cost Estimate Ppt PowerPoint Presentation Inspiration Templates Cpb
This is a sales funnel management data analytics marketing cost estimate ppt powerpoint presentation inspiration templates cpb. This is a five stage process. The stages in this process are sales funnel management, data analytics marketing, cost estimate.

Business Diagram Four Colored Boxes And Arrows For Data Representation Presentation Template
Graphic of four colored boxes and arrows has been used to design this power point template. This PPT contains the concept of data representation. Use this PPT for data technology related topics in any presentation.

Six Building Blocks Of Digital Transformation Data Analytics Ppt PowerPoint Presentation Outline Guide
This is a six building blocks of digital transformation data analytics ppt powerpoint presentation outline guide. This is a six stage process. The stages in this process are process automation, organization, technology, data and analytics, strategy and innovation.

Future Of Big Data Analytics Arrow Diagram Ppt PowerPoint Presentation Summary
This is a future of big data analytics arrow diagram ppt powerpoint presentation summary. This is a four stage process. The stages in this process are big data, process, business, marketing, icons.

Data Management Solutions Strategy And Realization Ppt PowerPoint Presentation Pictures Show Cpb
This is a data management solutions strategy and realization ppt powerpoint presentation pictures show cpb. This is a four stage process. The stages in this process are data analysis, analytics architecture, analytics framework.
Mechanism Of Data Sources Checklist With Gear Ppt PowerPoint Presentation Model Example
This is a mechanism of data sources checklist with gear ppt powerpoint presentation model example. This is a three stage process. The stages in this process are data feed, web feed, information feed.

Executive Information Database System Topdown Design Approach Of Data Warehouse Information PDF
This slide represents the top down design approach of the data warehouse, including its features such as time variant, non volatile, subject oriented, etc.Deliver and pitch your topic in the best possible manner with this Executive Information Database System Topdown Design Approach Of Data Warehouse Information PDF. Use them to share invaluable insights on Warehouse Defined, Data Repository, Data Warehouse and impress your audience. This template can be altered and modified as per your expectations. So, grab it now.
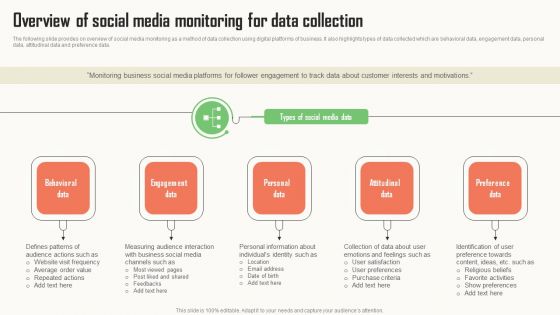
Strategic Market Insight Implementation Guide Overview Of Social Media Monitoring For Data Collection Microsoft PDF
The following slide provides on overview of social media monitoring as a method of data collection using digital platforms of business. It also highlights types of data collected which are behavioral data, engagement data, personal data, attitudinal data and preference data. Boost your pitch with our creative Strategic Market Insight Implementation Guide Overview Of Social Media Monitoring For Data Collection Microsoft PDF. Deliver an awe-inspiring pitch that will mesmerize everyone. Using these presentation templates you will surely catch everyones attention. You can browse the ppts collection on our website. We have researchers who are experts at creating the right content for the templates. So you do not have to invest time in any additional work. Just grab the template now and use them.
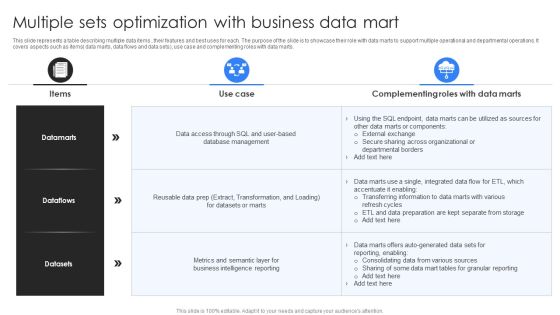
Multiple Sets Optimization With Business Data Mart Ppt Model Example Topics PDF
This slide represents a table describing multiple data items , their features and best uses for each. The purpose of the slide is to showcase their role with data marts to support multiple operational and departmental operations. It covers aspects such as items data marts, data flows and data sets, use case and complementing roles with data marts. Pitch your topic with ease and precision using this Multiple Sets Optimization With Business Data Mart Ppt Model Example Topics PDF. This layout presents information on Complementing Roles, Data Marts, Business Intelligence Reporting. It is also available for immediate download and adjustment. So, changes can be made in the color, design, graphics or any other component to create a unique layout.
 Home
Home