Data

Data Monetization Approach To Drive Business Growth Assessing Role Of Data Monetising In Healthcare Sector Diagrams PDF
This slide provides details about analyzing the role of data monetizing in healthcare sector in context to benefits associated to it with the help of data optimize software. Do you know about Slidesgeeks Data Monetization Approach To Drive Business Growth Assessing Role Of Data Monetising In Healthcare Sector Diagrams PDF These are perfect for delivering any kind od presentation. Using it, create PowerPoint presentations that communicate your ideas and engage audiences. Save time and effort by using our pre designed presentation templates that are perfect for a wide range of topic. Our vast selection of designs covers a range of styles, from creative to business, and are all highly customizable and easy to edit. Download as a PowerPoint template or use them as Google Slides themes.
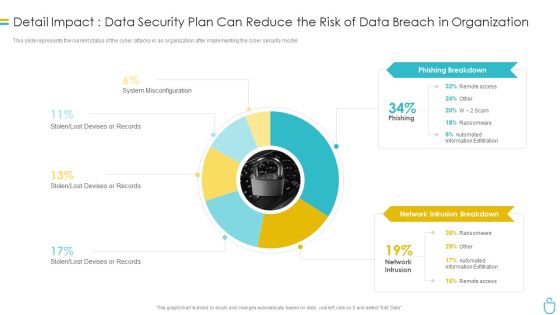
Information Security Detail Impact Data Security Plan Can Reduce The Risk Of Data Breach In Organization Ppt Slides Influencers PDF
This slide represents the current status of the cyber attacks in an organization after implementing the cyber security model. Deliver and pitch your topic in the best possible manner with this information security detail impact data security plan can reduce the risk of data breach in organization ppt slides influencers pdf. Use them to share invaluable insights on phishing breakdown, network intrusion breakdown and impress your audience. This template can be altered and modified as per your expectations. So, grab it now.

Using Data Science Technologies For Business Transformation Tasks And Skills Of Data And Analytics Manager Brochure PDF
This slide depicts the tasks performed by a data and analytics manager and skills he should have, such as leadership and project management qualities, interpersonal communication skills, and so on. Are you in need of a template that can accommodate all of your creative concepts This one is crafted professionally and can be altered to fit any style. Use it with Google Slides or PowerPoint. Include striking photographs, symbols, depictions, and other visuals. Fill, move around, or remove text boxes as desired. Test out color palettes and font mixtures. Edit and save your work, or work with colleagues. Download Using Data Science Technologies For Business Transformation Tasks And Skills Of Data And Analytics Manager Brochure PDF and observe how to make your presentation outstanding. Give an impeccable presentation to your group and make your presentation unforgettable.
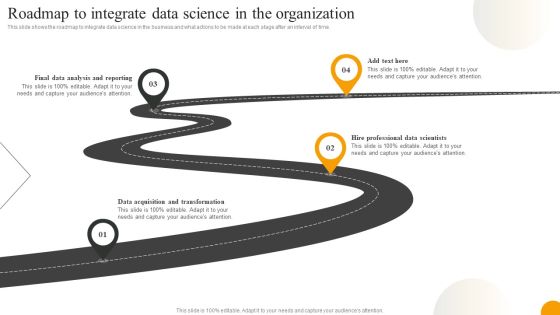
Using Data Science Technologies For Business Transformation Roadmap To Integrate Data Science In The Organization Topics PDF
This slide describes the operational phase of data science and what tasks are performed in this phase, such as deliver final reports, pilot project implementation, and how it will be helpful in monitoring performance. Slidegeeks is here to make your presentations a breeze with Using Data Science Technologies For Business Transformation Roadmap To Integrate Data Science In The Organization Topics PDF With our easy to use and customizable templates, you can focus on delivering your ideas rather than worrying about formatting. With a variety of designs to choose from, you are sure to find one that suits your needs. And with animations and unique photos, illustrations, and fonts, you can make your presentation pop. So whether you are giving a sales pitch or presenting to the board, make sure to check out Slidegeeks first.

Toolkit For Data Science And Analytics Transition Key Reasons For Failure Of Data Analytics Project Portrait PDF
This slide describes a list of key reasons responsible for the failure of delivering accurate data analytics results to the business. Present like a pro with Toolkit For Data Science And Analytics Transition Key Reasons For Failure Of Data Analytics Project Portrait PDF Create beautiful presentations together with your team, using our easy to use presentation slides. Share your ideas in real time and make changes on the fly by downloading our templates. So whether you are in the office, on the go, or in a remote location, you can stay in sync with your team and present your ideas with confidence. With Slidegeeks presentation got a whole lot easier. Grab these presentations today.

Devops Data Use Case Monitoring For Containers And Serverless Data Record Cases Of Devops IT Download PDF
This template covers devOps configuration management including customer requirements, and appropriate solutions. This is a devops data use case monitoring for containers and serverless data record cases of devops it download pdf template with various stages. Focus and dispense information on four stages using this creative set, that comes with editable features. It contains large content boxes to add your information on topics like develop, products, applications, environments. You can also showcase facts, figures, and other relevant content using this PPT layout. Grab it now.

Predictive Analytics In The Age Of Big Data Methods Of Data Clustering In Predictive Analytics Topics PDF
This slide outlines the two primary information clustering methods used in the predictive analytics clustering model. The methods include K-means and K-nearest neighbor clustering, including the working of both approaches. Slidegeeks is here to make your presentations a breeze with Predictive Analytics In The Age Of Big Data Methods Of Data Clustering In Predictive Analytics Topics PDF With our easy to use and customizable templates, you can focus on delivering your ideas rather than worrying about formatting. With a variety of designs to choose from, you are sure to find one that suits your needs. And with animations and unique photos, illustrations, and fonts, you can make your presentation pop. So whether you are giving a sales pitch or presenting to the board, make sure to check out Slidegeeks first.

Toolkit For Data Science And Analytics Transition Vendor Scan Selection Score Sheet For Data Analytics Software Microsoft PDF
In this slide, we are tabulating the scores on the scale of 1 to 10 to multiple vendors based on the attributes such as functionality, price, strength and risk etc. This modern and well arranged Toolkit For Data Science And Analytics Transition Vendor Scan Selection Score Sheet For Data Analytics Software Microsoft PDF provides lots of creative possibilities. It is very simple to customize and edit with the Powerpoint Software. Just drag and drop your pictures into the shapes. All facets of this template can be edited with Powerpoint no extra software is necessary. Add your own material, put your images in the places assigned for them, adjust the colors, and then you can show your slides to the world, with an animated slide included.

Business Diagram Sample Advantages Benefits Of Big Data Analysis And Modelling Ppt Slide
Explain the concept of sample advantages and benefits of big data analysis with this unique diagram. This slide contains the graphic of data icons. Use this slide to present data analysis and modeling related topics in any presentation.
Pie Chart For Data Presentation Vector Ppt PowerPoint Presentation Summary Files
Presenting this set of slides with name pie chart for data presentation vector ppt powerpoint presentation summary files. The topics discussed in these slides are data visualization icon, research analysis, business focus. This is a completely editable PowerPoint presentation and is available for immediate download. Download now and impress your audience.

Data Analysis Reports Under Magnifying Glass Ppt PowerPoint Presentation Icon Graphic Tips
Presenting this set of slides with name data analysis reports under magnifying glass ppt powerpoint presentation icon graphic tips. This is a three stage process. The stages in this process are data visualization icon, research analysis, business focus. This is a completely editable PowerPoint presentation and is available for immediate download. Download now and impress your audience.

Data Processing Mainframe Structure Vector Icon Ppt PowerPoint Presentation Model Files PDF
Pitch your topic with ease and precision using this data processing mainframe structure vector icon ppt powerpoint presentation model files pdf. This layout presents information on data processing mainframe structure vector icon. It is also available for immediate download and adjustment. So, changes can be made in the color, design, graphics or any other component to create a unique layout.
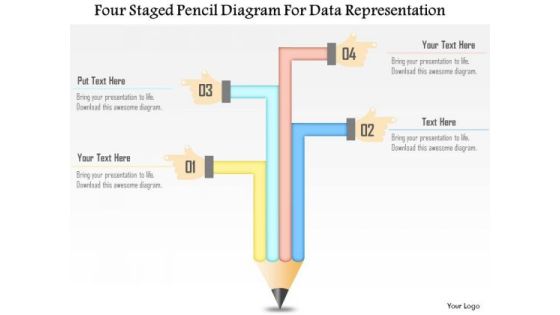
Business Diagram Four Staged Pencil Diagram For Data Representation Presentation Template
This business diagram has been designed with four staged pencil chart. This slide suitable for data representation. You can also use this slide to present four steps of any business process. Use this diagram to present your views in a wonderful manner.

Eight Stages Of Pie Chart Data Interpretation Detailed Business Plan PowerPoint Templates
We present our eight stages of pie chart data interpretation detailed business plan PowerPoint templates.Download and present our Competition PowerPoint Templates because You can Stir your ideas in the cauldron of our PowerPoint Templates and Slides. Cast a magic spell on your audience. Download and present our Marketing PowerPoint Templates because You should Kick up a storm with our PowerPoint Templates and Slides. The heads of your listeners will swirl with your ideas. Download and present our Arrows PowerPoint Templates because Your ideas provide food for thought. Our PowerPoint Templates and Slides will help you create a dish to tickle the most discerning palate. Present our Circle Charts PowerPoint Templates because You can Stir your ideas in the cauldron of our PowerPoint Templates and Slides. Cast a magic spell on your audience. Download our Business PowerPoint Templates because You can Score a slam dunk with our PowerPoint Templates and Slides. Watch your audience hang onto your every word.Use these PowerPoint slides for presentations relating to chart, graph, pie, 3d, diagram, graphic, icon, control, business, data, profit, market, sales, display, corporate, concept, render, success, presentation, finance, report, marketing, accounting, management, piece, strategy, money, growth, company, competition, progress, account, sheet, part, information, investment, improvement, banking, index, financial, reflect, results, performance, exchange. The prominent colors used in the PowerPoint template are Blue, Black, Gray.
Stock Photo Cube With Key And Lock Data Protection Concept PowerPoint Slide
Graphic of cube with lock and key has been used to design this power point image template. This image template contains the concept of data protection. This image template can e used for data related presentations.
File Transfer Data Management Vector Icon Ppt PowerPoint Presentation File Graphic Images
Presenting this set of slides with name file transfer data management vector icon ppt powerpoint presentation file graphic images. The topics discussed in these slides are data sources, database management, marketing. This is a completely editable PowerPoint presentation and is available for immediate download. Download now and impress your audience.
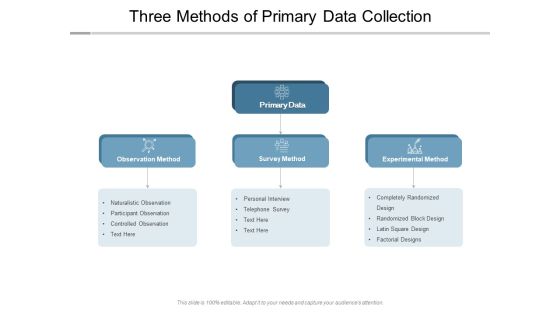
Three Methods Of Primary Data Collection Ppt PowerPoint Presentation Infographics Graphics Design
Presenting this set of slides with name three methods of primary data collection ppt powerpoint presentation infographics graphics design. The topics discussed in these slides are data sources, database management, marketing. This is a completely editable PowerPoint presentation and is available for immediate download. Download now and impress your audience.

Business Diagram 3d Pie Chart With Arrows For Data Representation PowerPoint Slide
This business slide displays pie chart with timeline graphics. This diagram has been designed with graphic of with four arrows representing yearly data. Use this diagram, in your presentations to display process steps, stages, for business management.

Business Diagram Thumb Diagram With Five Stages For Data Representation PowerPoint Slide
This business diagram displays thumb up with five stages. This diagram contains text boxes for data representation. Use this diagram to display business process workflows in any presentations.
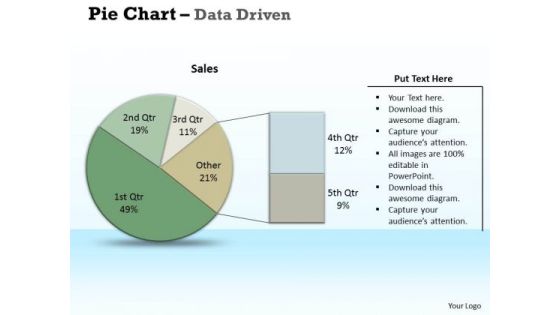
Examples Of Data Analysis Market Driven Pie Chart Research PowerPoint Slides Templates
Chalk It Up With Our examples of data analysis market driven pie chart research powerpoint slides Templates . Add To The Credits Of Your Ideas.

Quantitative Data Analysis Icon For Predictive Modelling Ppt Ideas Images PDF
Presenting Quantitative Data Analysis Icon For Predictive Modelling Ppt Ideas Images PDF to dispense important information. This template comprises one stages. It also presents valuable insights into the topics including Quantitative Data, Analysis Icon, Predictive Modelling. This is a completely customizable PowerPoint theme that can be put to use immediately. So, download it and address the topic impactfully.

Data Maturity Framework Assessment Icon Ppt PowerPoint Presentation Icon Infographic Template PDF
Presenting Data Maturity Framework Assessment Icon Ppt PowerPoint Presentation Icon Infographic Template PDF to dispense important information. This template comprises one stages. It also presents valuable insights into the topics including Data Maturity Framework, Assessment Icon. This is a completely customizable PowerPoint theme that can be put to use immediately. So, download it and address the topic impactfully.
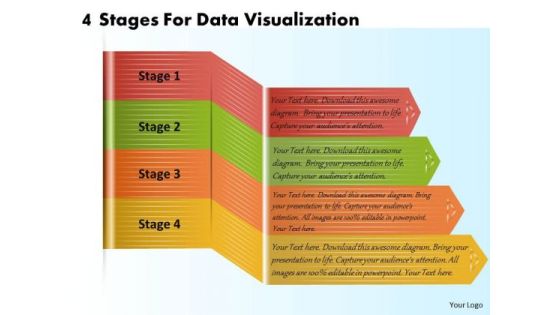
Business Plan And Strategy 4 Stages For Data Visualization Strategic Planning Template Ppt Slide
Your Listeners Will Never Doodle. Our business plan and strategy 4 stages for data visualization strategic planning template ppt slide Powerpoint Templates Will Hold Their Concentration. Do The One Thing With Your Thoughts. Uphold Custom With Our Process and Flows Powerpoint Templates.
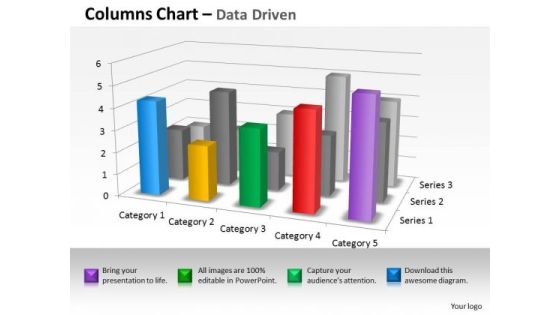
Quantitative Data Analysis 3d Interpretation Of Statistical Quality Control PowerPoint Templates
Land The Idea With Our quantitative data analysis 3d interpretation of statistical quality control Powerpoint Templates . Help It Grow With Your Thoughts.

Business Diagram 3d Colorful Pie Graph With Magnifier Data Search PowerPoint Slide
This business slide displays 3d colorful pie graph with magnifier. This diagram is a data visualization tool that gives you a simple way to present statistical information. This slide helps your audience examine and interpret the data you present.

Business Diagram Data Driven Pie Chart Inside The Magnifier PowerPoint Slide
This business slide displays 3d colorful pie graph with magnifier. This diagram is a data visualization tool that gives you a simple way to present statistical information. This slide helps your audience examine and interpret the data you present.
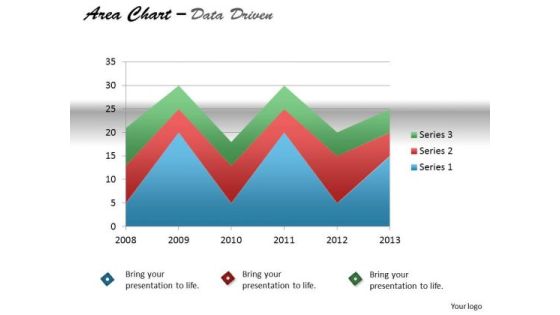
Quantitative Data Analysis Driven Display Series With Area Chart PowerPoint Slides Templates
Our quantitative data analysis driven display series with area chart powerpoint slides Templates Enjoy Drama. They Provide Entertaining Backdrops.
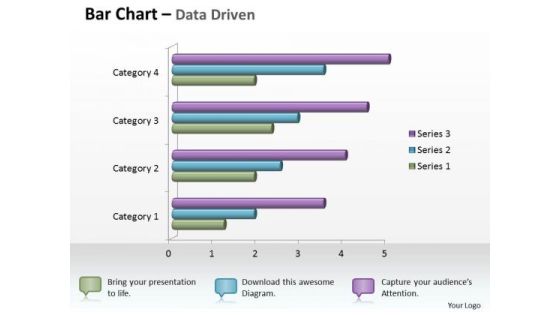
Data Analysis In Excel 3d Bar Chart For Business Statistics PowerPoint Templates
Knock On The Door To Success With Our data analysis in excel 3d bar chart for business statistics Powerpoint Templates . Be Assured Of Gaining Entry.
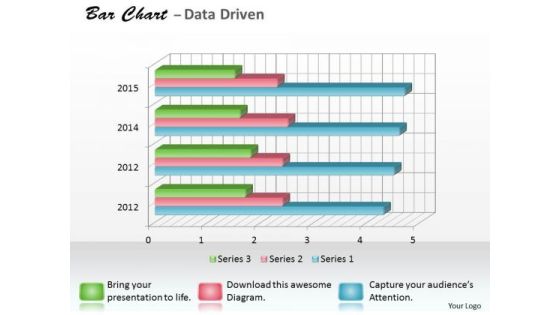
Data Analysis Programs 3d Bar Chart For Research In Statistics PowerPoint Templates
Draw It Out On Our data analysis programs 3d bar chart for research in statistics Powerpoint Templates . Provide Inspiration To Your Colleagues.
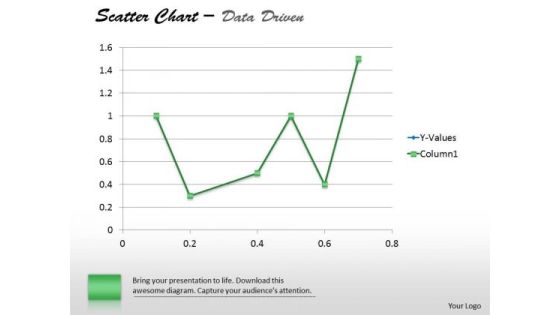
Financial Data Analysis Driven Demonstrate Statistics With Scatter Chart PowerPoint Slides Templates
Establish The Dominance Of Your Ideas. Our financial data analysis driven demonstrate statistics with scatter chart powerpoint slides Templates Will Put Them On Top.
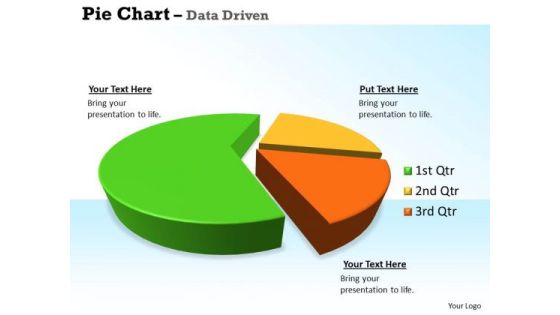
Quantitative Data Analysis 3d Pie Chart For Business Statistics PowerPoint Templates
Our quantitative data analysis 3d pie chart for business statistics Powerpoint Templates Allow You To Do It With Ease. Just Like Picking The Low Hanging Fruit.
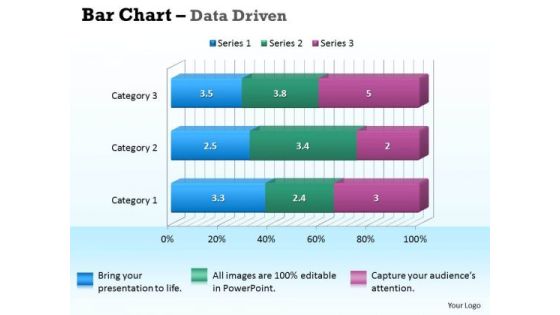
Data Analysis In Excel 3d Bar Chart For Business Information PowerPoint Templates
Our data analysis in excel 3d bar chart for business information Powerpoint Templates Deliver At Your Doorstep. Let Them In For A Wonderful Experience.

Data Analysis In Excel 3d Column Chart For Sets Of Information PowerPoint Templates
Double The Impact With Our data analysis in excel 3d column chart for sets of information Powerpoint Templates . Your Thoughts Will Have An Imposing Effect.
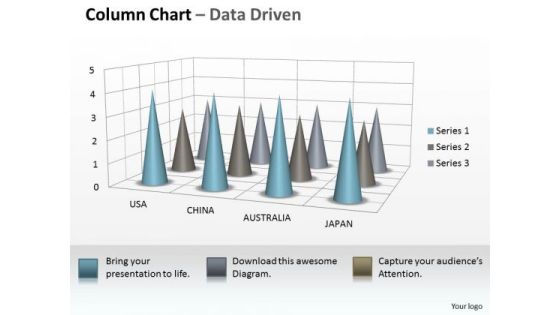
Data Analysis On Excel 3d Chart To Incorporate Business Information PowerPoint Templates
Our data analysis on excel 3d chart to incorporate business information Powerpoint Templates Allow You To Do It With Ease. Just Like Picking The Low Hanging Fruit.

Data Analysis On Excel Driven Sets Of Business Information PowerPoint Slides Templates
Break The Deadlock With Our data analysis on excel driven sets of business information powerpoint slides Templates . Let The Words Start To Flow.
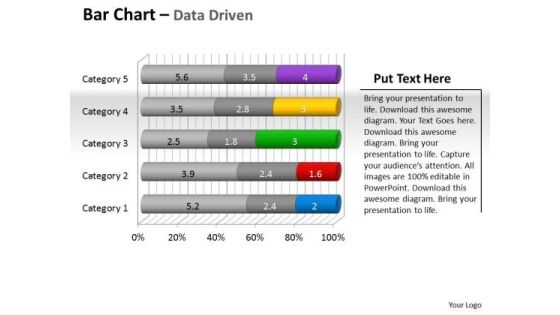
Data Analysis Programs 3d Bar Chart To Put Information PowerPoint Templates
Draw Up Your Agenda On Our data analysis programs 3d bar chart to put information Powerpoint Templates . Coax Your Audience Into Acceptance.
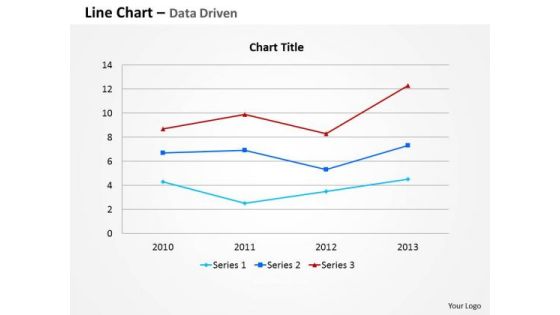
Data Analysis Template Driven Line Chart For Business Information PowerPoint Slides Templates
Your Thoughts Are Dripping With Wisdom. Lace It With Our data analysis template driven line chart for business information powerpoint slides Templates .
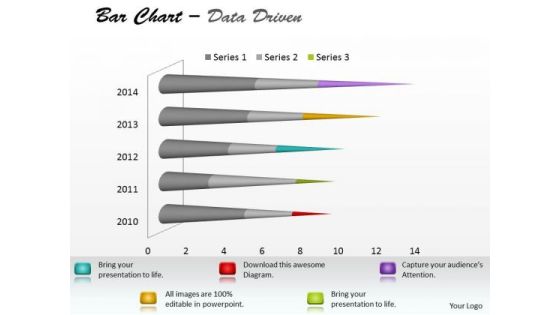
Microsoft Excel Data Analysis Bar Chart To Communicate Information PowerPoint Templates
With Our microsoft excel data analysis bar chart to communicate information Powerpoint Templates You Will Be Doubly Sure. They Possess That Stamp Of Authority.

Examples Of Data Analysis Market 3d Business Intelligence And PowerPoint Templates
Our examples of data analysis market 3d business intelligence and Powerpoint Templates Are Dual Purpose. They Help Instruct And Inform At The Same Time.
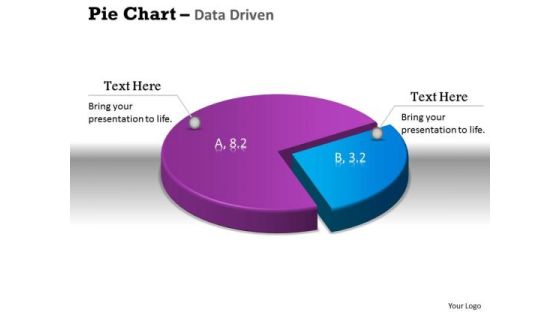
Data Analysis Excel 3d Pie Chart Shows Relative Size Of PowerPoint Templates
Get The Doers Into Action. Activate Them With Our data analysis excel 3d pie chart shows relative size of Powerpoint Templates.

Data Analysis Excel Driven Pie Chart For Business Stratregy PowerPoint Slides Templates
Open Up Doors That Lead To Success. Our data analysis excel driven pie chart for business stratregy powerpoint slides Templates Provide The Handles.
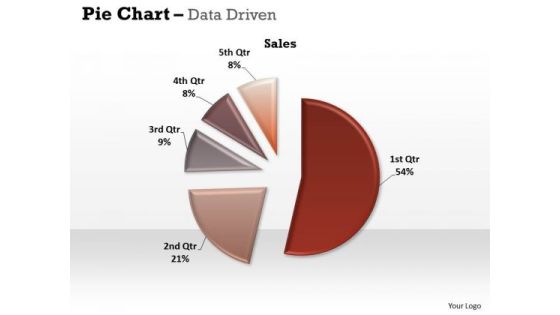
Data Analysis Excel Driven Pie Chart For Easy Comparison PowerPoint Slides Templates
Our data analysis excel driven pie chart for easy comparison powerpoint slides Templates Abhor Doodling. They Never Let The Interest Flag.

Data Analysis In Excel 3d Bar Chart For Comparison Of Time Series PowerPoint Templates
Double Your Chances With Our data analysis in excel 3d bar chart for comparison of time series Powerpoint Templates . The Value Of Your Thoughts Will Increase Two-Fold.
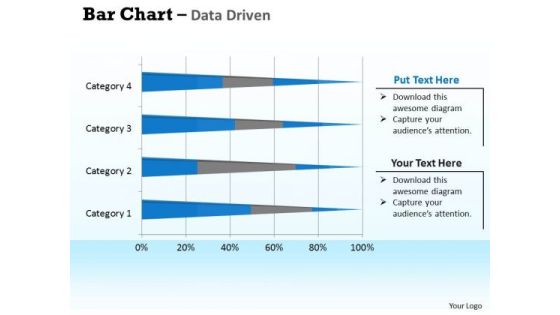
Data Analysis In Excel 3d Bar Chart For Interpretation PowerPoint Templates
Double Up Our data analysis in excel 3d bar chart for interpretation Powerpoint Templates With Your Thoughts. They Will Make An Awesome Pair.
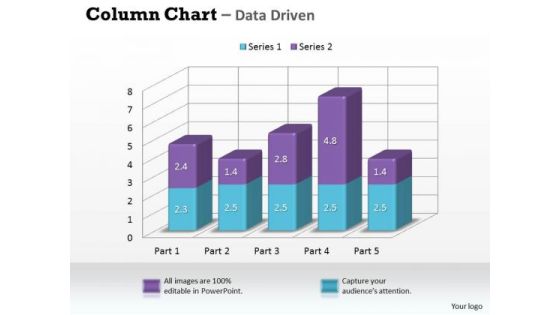
Data Analysis In Excel 3d Column Chart For Market Surveys PowerPoint Templates
Our data analysis in excel 3d column chart for market surveys Powerpoint Templates Leave No One In Doubt. Provide A Certainty To Your Views.
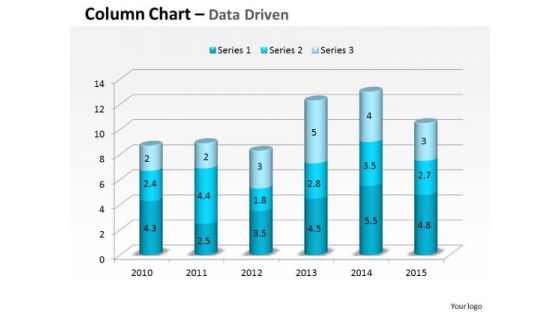
Data Analysis In Excel 3d Compare Yearly Business Performance PowerPoint Templates
Plan For All Contingencies With Our data analysis in excel 3d compare yearly business performance Powerpoint Templates . Douse The Fire Before It Catches.
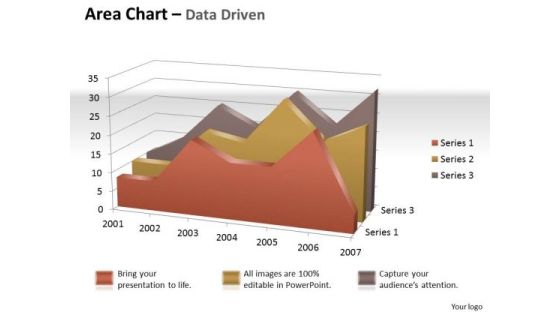
Data Analysis In Excel 3d Visual Display Of Area Chart PowerPoint Templates
Brace Yourself, Arm Your Thoughts. Prepare For The Hustle With Our data analysis in excel 3d visual display of area chart Powerpoint Templates .

Data Analysis In Excel Column Chart For Business Analytics PowerPoint Templates
Our data analysis in excel column chart for business analytics Powerpoint Templates Heighten Concentration. Your Audience Will Be On The Edge.

Data Analysis In Excel Column Chart For Business Project PowerPoint Templates
Edit Your Work With Our data analysis in excel column chart for business project Powerpoint Templates . They Will Help You Give The Final Form.

Data Analysis On Excel 3d Chart To Monitor Business Process PowerPoint Templates
Make Some Dough With Our data analysis on excel 3d chart to monitor business process Powerpoint Templates . Your Assets Will Rise Significantly.

Data Analysis On Excel 3d Chart With Sets Of PowerPoint Templates
Reduce The Drag With Our data analysis on excel 3d chart with sets of Powerpoint Templates . Give More Lift To Your Thoughts.
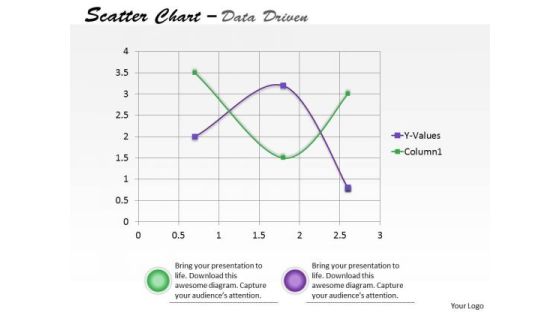
Data Analysis On Excel Driven Scatter Chart To Predict Future Movements PowerPoint Slides Templates
Our data analysis on excel driven scatter chart to predict future movements powerpoint slides Templates Enjoy Drama. They Provide Entertaining Backdrops.

Data Analysis On Excel Driven Stacked Area Chart PowerPoint Slides Templates
Be The Dramatist With Our data analysis on excel driven stacked area chart powerpoint slides Templates . Script Out The Play Of Words.

Data Analysis On Excel Driven Stock Chart For Business Growth PowerPoint Slides Templates
Add Some Dramatization To Your Thoughts. Our data analysis on excel driven stock chart for business growth powerpoint slides Templates Make Useful Props.

Data Analysis Programs 3d Bar Chart For Market Surveys PowerPoint Templates
Draw On The Experience Of Our data analysis programs 3d bar chart for market surveys Powerpoint Templates . They Imbibe From Past Masters.

Data Analysis Template Driven Ineract With Stock Chart PowerPoint Slides Templates
Drive Your Passion With Our data analysis template driven ineract with stock chart powerpoint slides Templates . Steer Yourself To Achieve Your Aims.

Data Analysis Template Driven Line Chart Business Graph PowerPoint Slides Templates
Bottle Your Thoughts In Our data analysis template driven line chart business graph powerpoint slides Templates . Pass It Around For Your Audience To Sip.
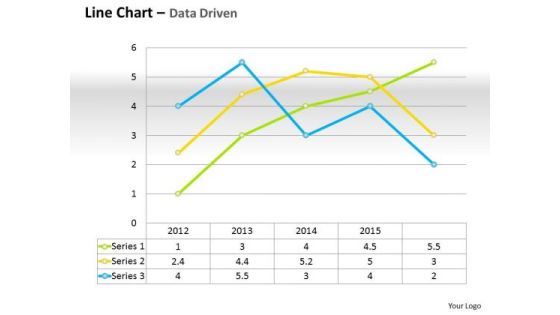
Data Analysis Template Driven Line Chart For Business Performance PowerPoint Slides Templates
Do Not Allow Things To Drift. Ring In Changes With Our data analysis template driven line chart for business performance powerpoint slides Templates .
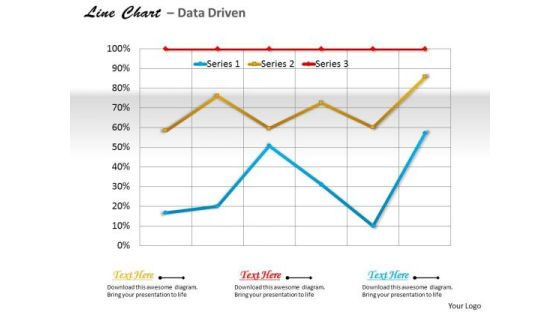
Data Analysis Template Driven Line Chart For Business Trends PowerPoint Slides Templates
Use Our data analysis template driven line chart for business trends powerpoint slides Templates As The Bit. Drill Your Thoughts Into Their Minds.
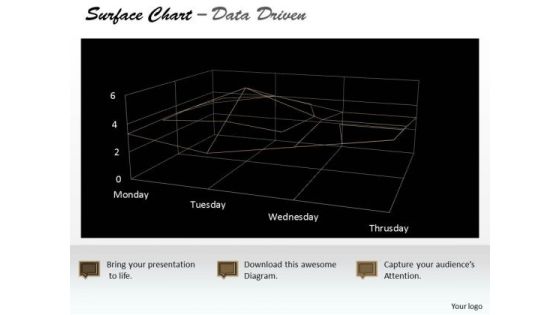
Data Analysis Template Driven Surface Chart Indicating Areas PowerPoint Slides Templates
Highlight Your Drive With Our data analysis template driven surface chart indicating areas powerpoint slides Templates . Prove The Fact That You Have Control.
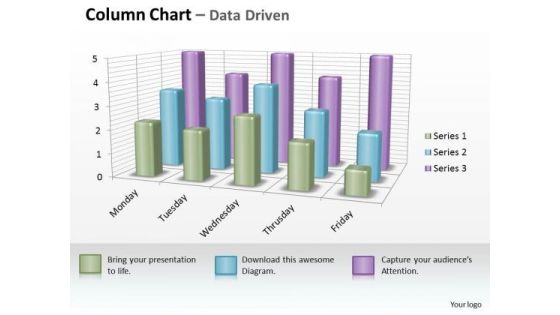
Examples Of Data Analysis Market 3d Business Inspection Procedure Chart PowerPoint Templates
However Dry Your Topic Maybe. Make It Catchy With Our examples of data analysis market 3d business inspection procedure chart Powerpoint Templates .
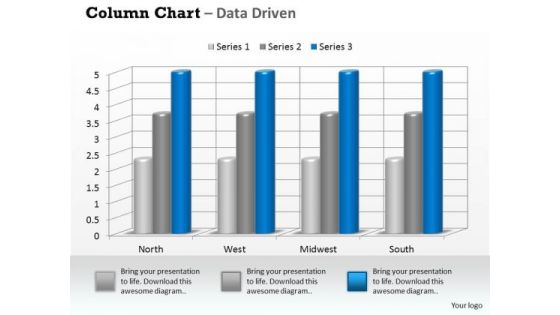
Examples Of Data Analysis Market 3d Business On Regular Intervals PowerPoint Templates
Drum It Out Loud And Clear On Our examples of data analysis market 3d business on regular intervals Powerpoint Templates . Your Words Will Ring In Their Ears.

Examples Of Data Analysis Market 3d Business Trend Series Chart PowerPoint Templates
Duct It Through With Our examples of data analysis market 3d business trend series chart Powerpoint Templates . Your Ideas Will Reach Into Their Minds Intact.

Examples Of Data Analysis Market Driven Plotting The Business Values PowerPoint Slides Templates
Ring The Duck With Our examples of data analysis market driven plotting the business values powerpoint slides Templates . Acquire The Points With Your Ideas.

Examples Of Data Analysis Market Driven Radar Chart To Compare PowerPoint Slides Templates
Rely On Our examples of data analysis market driven radar chart to compare powerpoint slides Templates In Any Duel. They Will Drive Home Your Point.
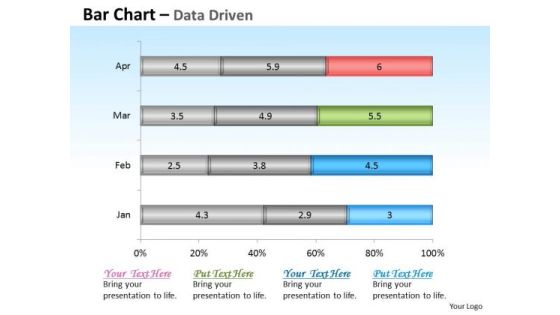
Financial Data Analysis Driven Base Bar Chart Design PowerPoint Slides Templates
Get The Domestics Right With Our financial data analysis driven base bar chart design powerpoint slides Templates . Create The Base For Thoughts To Grow.

Financial Data Analysis Driven Compare Market Share Of Brand PowerPoint Templates
Doll Up Your Thoughts With Our financial data analysis driven compare market share of brand Powerpoint Templates . They Will Make A Pretty Picture.
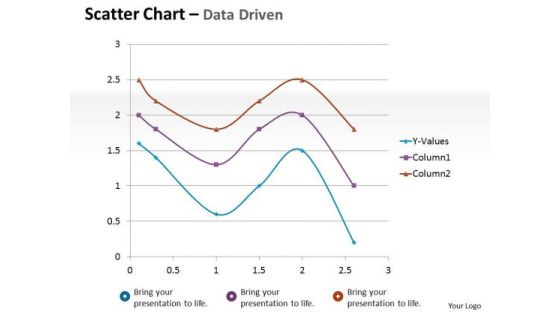
Financial Data Analysis Driven Scatter Chart Mathematical Diagram PowerPoint Slides Templates
Dominate Proceedings With Your Ideas. Our financial data analysis driven scatter chart mathematical diagram powerpoint slides Templates Will Empower Your Thoughts.
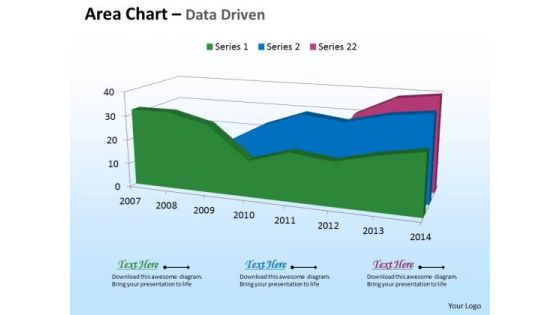
Microsoft Excel Data Analysis 3d Area Chart For Time Based PowerPoint Templates
Deliver The Right Dose With Our microsoft excel data analysis 3d area chart for time based Powerpoint Templates . Your Ideas Will Get The Correct Illumination.
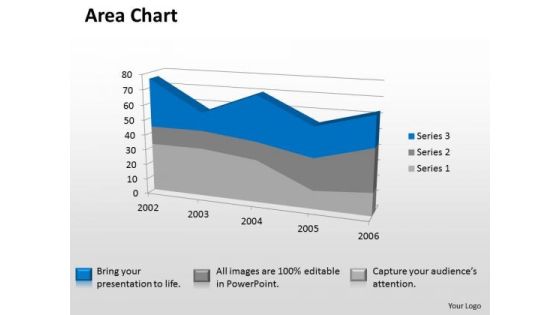
Microsoft Excel Data Analysis 3d Area Chart Showimg Change In Values PowerPoint Templates
Our microsoft excel data analysis 3d area chart showimg change in values Powerpoint Templates Deliver At Your Doorstep. Let Them In For A Wonderful Experience.
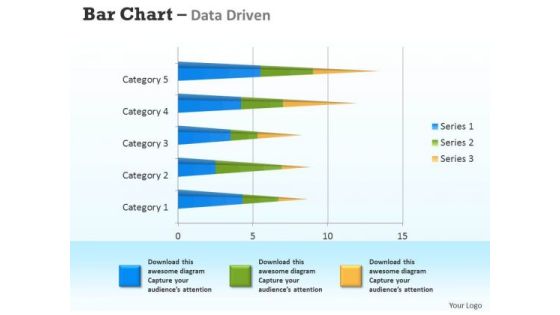
Microsoft Excel Data Analysis 3d Bar Chart For Analyzing Survey PowerPoint Templates
Connect The Dots With Our microsoft excel data analysis 3d bar chart for analyzing survey Powerpoint Templates . Watch The Whole Picture Clearly Emerge.

Microsoft Excel Data Analysis 3d Change In Business Process Chart PowerPoint Templates
Double Your Chances With Our microsoft excel data analysis 3d change in business process chart Powerpoint Templates . The Value Of Your Thoughts Will Increase Two-Fold.

Microsoft Excel Data Analysis Bar Chart To Compare Quantities PowerPoint Templates
Our microsoft excel data analysis bar chart to compare quantities Powerpoint Templates Leave No One In Doubt. Provide A Certainty To Your Views.
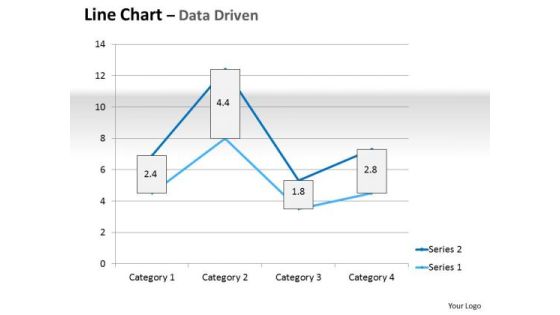
Multivariate Data Analysis Driven Line Chart Market Graph PowerPoint Slides Templates
Plan For All Contingencies With Our multivariate data analysis driven line chart market graph powerpoint slides Templates . Douse The Fire Before It Catches.
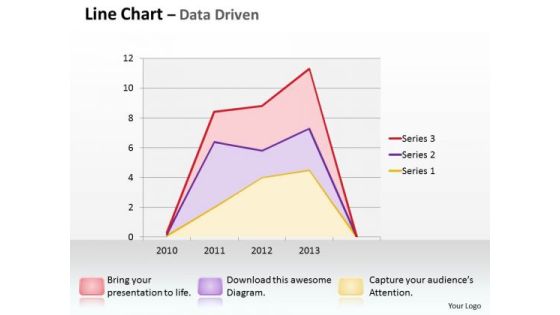
Multivariate Data Analysis Driven Line Chart Shows Revenue Trends PowerPoint Slides Templates
Good Camaraderie Is A Key To Teamwork. Our multivariate data analysis driven line chart shows revenue trends powerpoint slides Templates Can Be A Cementing Force.

Quantitative Data Analysis 3d Pie Chart For Business Process PowerPoint Templates
Put Them On The Same Page With Our quantitative data analysis 3d pie chart for business process Powerpoint Templates . Your Team Will Sing From The Same Sheet.

Quantitative Data Analysis Driven Economic With Column Chart PowerPoint Slides Templates
Add Some Dramatization To Your Thoughts. Our quantitative data analysis driven economic with column chart powerpoint slides Templates Make Useful Props.
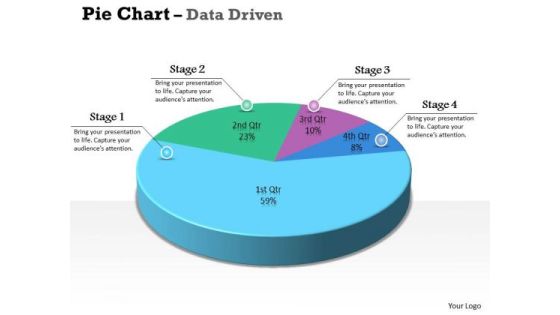
Data Analysis Excel 3d Pie Chart For Marketing Process PowerPoint Templates
Our data analysis excel 3d pie chart for marketing process Powerpoint Templates Team Are A Dogged Lot. They Keep At It Till They Get It Right.

Data Analysis Excel Driven Percentage Breakdown Pie Chart PowerPoint Slides Templates
Be A Donor Of Great Ideas. Display Your Charity On Our data analysis excel driven percentage breakdown pie chart powerpoint slides Templates.
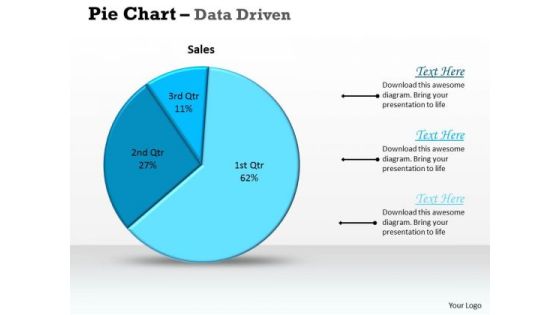
Data Analysis Excel Driven Pie Chart For Sales Process PowerPoint Slides Templates
Deliver The Right Dose With Our data analysis excel driven pie chart for sales process powerpoint slides Templates . Your Ideas Will Get The Correct Illumination.

Data Analysis In Excel 3d Bar Chart For Business Trends PowerPoint Templates
Connect The Dots With Our data analysis in excel 3d bar chart for business trends Powerpoint Templates . Watch The Whole Picture Clearly Emerge.
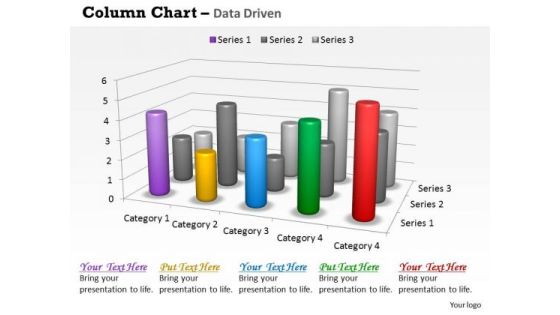
Data Analysis In Excel 3d Survey For Sales Chart PowerPoint Templates
Good Camaraderie Is A Key To Teamwork. Our data analysis in excel 3d survey for sales chart Powerpoint Templates Can Be A Cementing Force.

Data Analysis In Excel Area Chart For Business Process PowerPoint Templates
Your Grasp Of Economics Is Well Known. Help Your Audience Comprehend Issues With Our data analysis in excel area chart for business process Powerpoint Templates .

Data Analysis In Excel Column Chart Of Various Fields PowerPoint Templates
Land The Idea With Our data analysis in excel column chart of various fields Powerpoint Templates . Help It Grow With Your Thoughts.
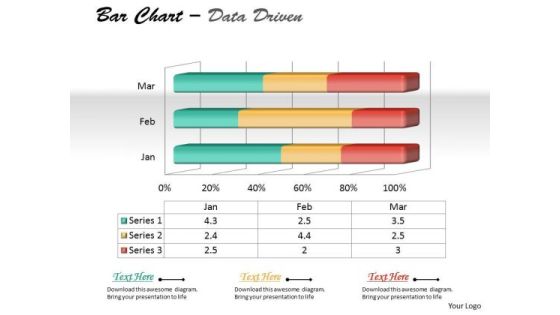
Data Analysis On Excel 3d Chart To Represent Quantitative Differences PowerPoint Templates
Draft It Out On Our data analysis on excel 3d chart to represent quantitative differences Powerpoint Templates . Give The Final Touches With Your Ideas.
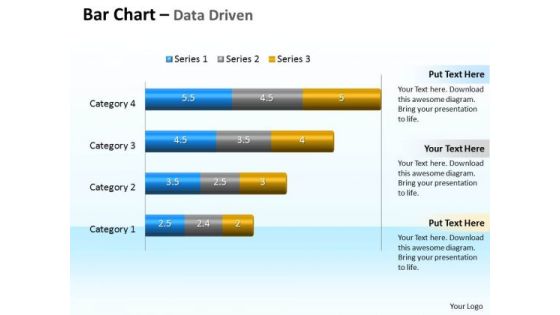
Data Analysis Programs 3d Bar Chart To Compare Categories PowerPoint Templates
Discover Decisive Moments With Our data analysis programs 3d bar chart to compare categories Powerpoint Templates . They Help Make That Crucial Difference.
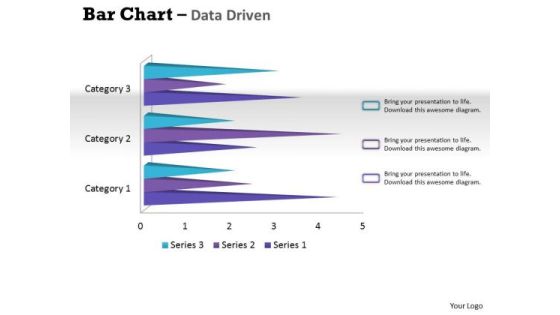
Data Analysis Techniques 3d Bar Chart For Financial Solutions PowerPoint Templates
Make Your Dreams A Reality With Our data analysis techniques 3d bar chart for financial solutions Powerpoint Templates . Your Ideas Will Begin To Take Shape.
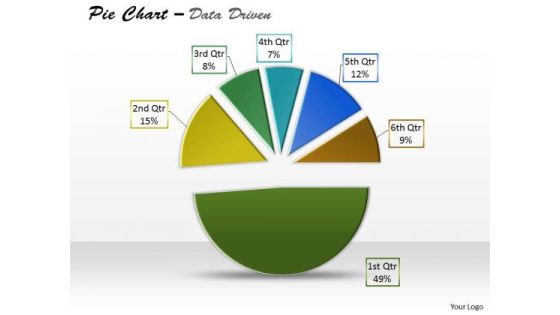
Data Analysis Template Driven Express Business Facts Pie Chart PowerPoint Slides Templates
Display Your Drive On Our data analysis template driven express business facts pie chart powerpoint slides Templates . Invigorate The Audience With Your Fervor.

Data Analysis Template Driven Stock Chart For Market Trends PowerPoint Slides Templates
Drive Your Team Along The Road To Success. Take The Wheel With Our data analysis template driven stock chart for market trends powerpoint slides Templates .
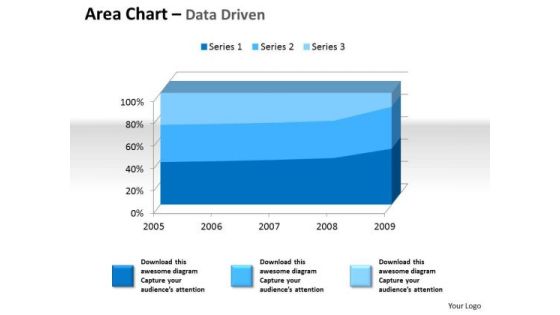
Examples Of Data Analysis Market 3d Area Chart For Quantiative PowerPoint Templates
Drum It Up With Our examples of data analysis market 3d area chart for quantiative Powerpoint Templates . Your Thoughts Will Raise The Tempo.
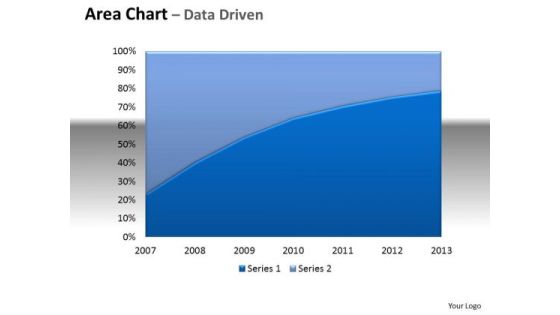
Financial Data Analysis Area Chart With Plotted Line Center PowerPoint Templates
Be The Doer With Our financial data analysis area chart with plotted line center Powerpoint Templates . Put Your Thoughts Into Practice.
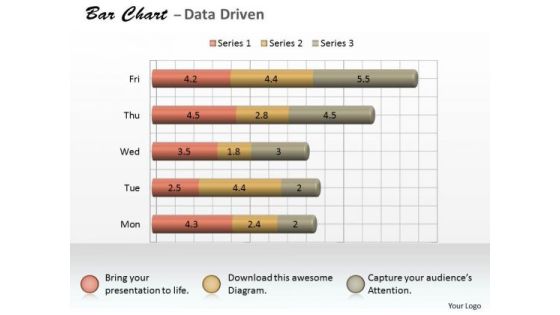
Microsoft Excel Data Analysis 3d Bar Chart As Research Tool PowerPoint Templates
Knock On The Door To Success With Our microsoft excel data analysis 3d bar chart as research tool Powerpoint Templates . Be Assured Of Gaining Entry.

Microsoft Excel Data Analysis 3d Chart For Business Observation PowerPoint Templates
Double Up Our microsoft excel data analysis 3d chart for business observation Powerpoint Templates With Your Thoughts. They Will Make An Awesome Pair.
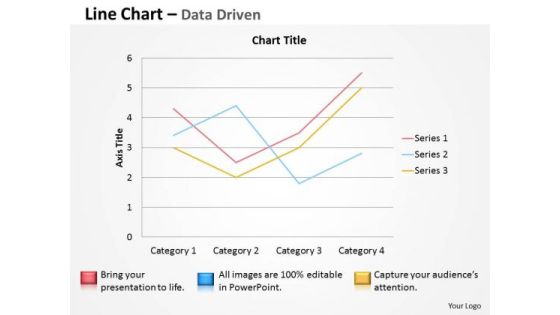
Multivariate Data Analysis Driven Line Chart To Demonstrate PowerPoint Slides Templates
Brace Yourself, Arm Your Thoughts. Prepare For The Hustle With Our multivariate data analysis driven line chart to demonstrate powerpoint slides Templates .
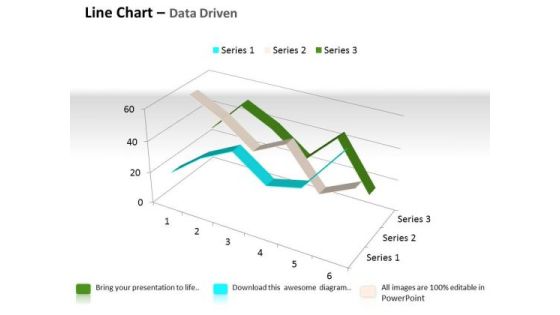
Quantitative Data Analysis 3d Line Chart For Comparison Of PowerPoint Templates
Touch Base With Our quantitative data analysis 3d line chart for comparison of Powerpoint Templates . Review Your Growth With Your Audience.

Quantitative Data Analysis Driven Economic Status Line Chart PowerPoint Slides Templates
Be The Dramatist With Our quantitative data analysis driven economic status line chart powerpoint slides Templates . Script Out The Play Of Words.

Personal Data Visualization On Computer Screen Ppt PowerPoint Presentation Show Layout Ideas
Presenting this set of slides with name personal data visualization on computer screen ppt powerpoint presentation show layout ideas. This is a one stage process. The stages in this process are data visualization icon, research analysis, business focus. This is a completely editable PowerPoint presentation and is available for immediate download. Download now and impress your audience.

Business Diagram Two Tablets With Growth Bar Graph Data Driven PowerPoint Slide
This business diagram has been designed with comparative charts on tablets. This slide suitable for data representation. You can also use this slide to present business reports and information. Use this diagram to present your views in a wonderful manner.

Data Analysis On Excel 3d Chart Shows Interrelated Sets Of PowerPoint Templates
Put Them On The Same Page With Our data analysis on excel 3d chart shows interrelated sets of Powerpoint Templates . Your Team Will Sing From The Same Sheet.

Data Analysis On Excel Driven Stock Chart For Market History PowerPoint Slides Templates
Draw Out The Best In You With Our data analysis on excel driven stock chart for market history powerpoint slides Templates . Let Your Inner Brilliance Come To The Surface.
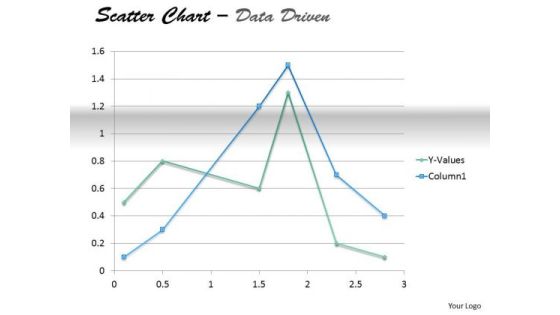
Examples Of Data Analysis Market Driven Present In Scatter Chart PowerPoint Slides Templates
Your Thoughts Will Take To Our examples of data analysis market driven present in scatter chart powerpoint slides Templates Like A Duck To Water. They Develop A Binding Affinity.
Business Diagram 3d Capsule With Multiple Icons For Business Data Flow PowerPoint Slide
This diagram has been designed with 3d graphic of capsule with multiple icons. This data driven PowerPoint slide can be used to give your presentations more effective look. It helps in clearly conveying your message to clients and audience.

Business Diagram 3d Thumb Chart And Tablet For Data Representation PowerPoint Slide
This business diagram displays graphic of 3d thumb up chart with icons on computer screen. This business slide contains the concept of business data representation. Use this diagram to build professional presentations for your viewers.
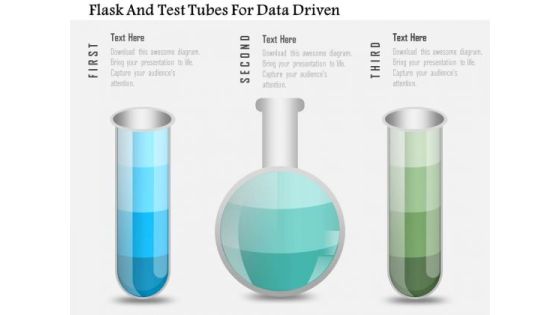
Business Diagram Flask And Test Tubes For Data Driven PowerPoint Slide
This data driven diagram has been designed with flask and test tubes. Download this diagram to give your presentations more effective look. It helps in clearly conveying your message to clients and audience.

Decision Support System Why We Need Data Warehouse Ppt Slides Good PDF
This slide represents the need for a data warehouse in the organization, such as data quality, single point for all data for all users, and the complicated problems that can be solved through a data warehouse. This is a Decision Support System Why We Need Data Warehouse Ppt Slides Good PDF template with various stages. Focus and dispense information on two stages using this creative set, that comes with editable features. It contains large content boxes to add your information on topics like Data Warehouse Offers, Complicated Problems, Data Quality. You can also showcase facts, figures, and other relevant content using this PPT layout. Grab it now.

Data Quality Auditing And Threats Reporting Process Ppt Icon Picture PDF
This slide covers auditing process of data quality and reporting risk detected. It includes framework depicting checkpoints needed to audit data quality for data warehouse and business intelligence projects. Presenting Data Quality Auditing And Threats Reporting Process Ppt Icon Picture PDF to dispense important information. This template comprises one stages. It also presents valuable insights into the topics including External Data, Customer Data, Legacy Data. This is a completely customizable PowerPoint theme that can be put to use immediately. So, download it and address the topic impactfully.

Various Stages Data Extraction Process Flow Chart Ppt PowerPoint Presentation Pictures Show PDF
Persuade your audience using this various stages data extraction process flow chart ppt powerpoint presentation pictures show pdf. This PPT design covers five stages, thus making it a great tool to use. It also caters to a variety of topics including interpretation evaluation, data mining, transformation, preprocessing, selection, target data, preprocessed data, transformed data, patterns, knowledge. Download this PPT design now to present a convincing pitch that not only emphasizes the topic but also showcases your presentation skills.

Decision Support System Checklist To Implement Data Warehouse In Company Slides PDF
This slide describes the checklist to implement a data warehouse in the company, including strategies to assess data, organization of data, tools to manage data, and so on. This is a Decision Support System Checklist To Implement Data Warehouse In Company Slides PDF template with various stages. Focus and dispense information on one stages using this creative set, that comes with editable features. It contains large content boxes to add your information on topics like Datas Consistency, Time Stamped, Operational Systems. You can also showcase facts, figures, and other relevant content using this PPT layout. Grab it now.

Decision Support System What Is Dependent Data Mart Ppt Layout PDF
This slide depicts the dependent data mart and how it can be established in two ways, such as access to both data warehouse and data mart or access to only data mart. This is a Decision Support System What Is Dependent Data Mart Ppt Layout PDF template with various stages. Focus and dispense information on one stages using this creative set, that comes with editable features. It contains large content boxes to add your information on topics like Operational Sources, Enterprise Data Warehouse, Dependent Department Datamarts. You can also showcase facts, figures, and other relevant content using this PPT layout. Grab it now.

Decision Support System What Is Operational Data Store Ppt Portfolio Example File PDF
This slide illustrates the operational data store and its architecture, including data sources such as unstructured and structured, ETL operations, and applications. This is a Decision Support System What Is Operational Data Store Ppt Portfolio Example File PDF template with various stages. Focus and dispense information on one stages using this creative set, that comes with editable features. It contains large content boxes to add your information on topics like Operational Data Store, Application, Data Sources, Enterprise Data Warehouse. You can also showcase facts, figures, and other relevant content using this PPT layout. Grab it now.

Decision Support System What Is Cloud Data Warehouse Ppt Visual Aids Pictures PDF
This slide depicts what a cloud data warehouse is and how it can store data from many data sources and is scalable as per the organizational needs. Presenting Decision Support System What Is Cloud Data Warehouse Ppt Visual Aids Pictures PDF to provide visual cues and insights. Share and navigate important information on four stages that need your due attention. This template can be used to pitch topics like Data Sources, Cloud Data Warehouse, Essential Component. In addtion, this PPT design contains high resolution images, graphics, etc, that are easily editable and available for immediate download.

Decision Support System What Is Hybrid Data Mart Ppt Outline Visual Aids PDF
This slide depicts the hybrid data mart and how data is integrated into this type of data mart other than data warehouse and valuable for ad hoc integration. Presenting Decision Support System What Is Hybrid Data Mart Ppt Outline Visual Aids PDF to provide visual cues and insights. Share and navigate important information on three stages that need your due attention. This template can be used to pitch topics like Operational Sources, Enterprise Data Warehouse, Dependent Department Datamarts. In addtion, this PPT design contains high resolution images, graphics, etc, that are easily editable and available for immediate download.

Real Time Data Processing Architecture For Management Systems Ppt Professional Slide Download PDF
This slide covers the real time data processing architecture for energy management systems which focuses on three tier such as data acquisition, processing and presentation with sources, integration, evaluation and data stream application. Persuade your audience using this ocessing Architecture For Management Systems Ppt Professional Slide Download PDF. This PPT design covers one stages, thus making it a great tool to use. It also caters to a variety of topics including Data Acquisition Tier, Data Processing Tier, Data Presentation Tier. Download this PPT design now to present a convincing pitch that not only emphasizes the topic but also showcases your presentation skills.
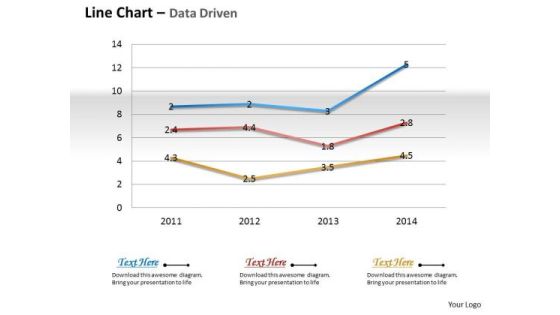
Business Data Analysis Chart Shows Changes Over The Time PowerPoint Templates
Document The Process On Our business data analysis chart shows changes over the time Powerpoint Templates. Make A Record Of Every Detail.

Data Analysis Excel Driven Multiple Series Scatter Chart PowerPoint Slides Templates
Your Listeners Will Never Doodle. Our data analysis excel driven multiple series scatter chart powerpoint slides Templates Will Hold Their Concentration.
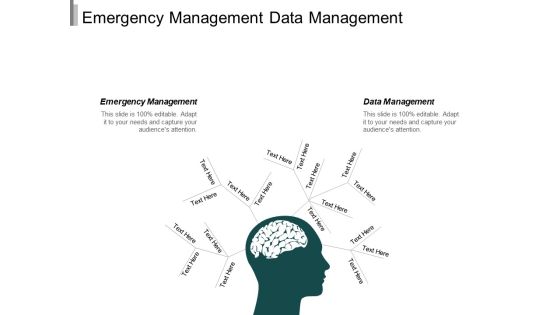
Emergency Management Data Management Management Facility Planning Ppt PowerPoint Presentation Infographics Graphics Tutorials
This is a emergency management data management management facility planning ppt powerpoint presentation infographics graphics tutorials. This is a two stage process. The stages in this process are emergency management, data management, management facility planning.

Decision Support System What Is Modern Data Warehouse Ppt Icon Outline PDF
This slide represents what a modern data warehouse is and how it supports SQL, machine learning, graphs, spatial processing, and analytical tools that help use data without transferring it. Presenting Decision Support System What Is Modern Data Warehouse Ppt Icon Outline PDF to provide visual cues and insights. Share and navigate important information on one stages that need your due attention. This template can be used to pitch topics like Data Warehouse, Analytics Data Mart, Reporting Tools. In addtion, this PPT design contains high resolution images, graphics, etc, that are easily editable and available for immediate download.

Decision Support System What Is Data Mart Ppt Icon Infographic Template PDF
This slide depicts the data mart type of data warehouse, its architecture, and how a single department manages it in an organization through limited sources of information. This is a Decision Support System What Is Data Mart Ppt Icon Infographic Template PDF template with various stages. Focus and dispense information on six stages using this creative set, that comes with editable features. It contains large content boxes to add your information on topics like External Sources, Data Feed, Spreadsheets. You can also showcase facts, figures, and other relevant content using this PPT layout. Grab it now.

Decision Support System Data Warehouse Architecture With Staging Area Diagrams PDF
This slide describes a data warehouse architecture with a staging area and how staging helps clean and process the information before entering it into the data warehouse. This is a Decision Support System Data Warehouse Architecture With Staging Area Diagrams PDF template with various stages. Focus and dispense information on one stages using this creative set, that comes with editable features. It contains large content boxes to add your information on topics like Data Sources, Staging Area, Operational System. You can also showcase facts, figures, and other relevant content using this PPT layout. Grab it now.

Reverse Proxy Server IT Data Center Proxy Server And Its Architecture Ppt Visual Aids Files PDF
This slide depicts the data center proxy server that uses fixed IP addresses and a direct connection to send and respond to requests through data centers. This is a reverse proxy server it data center proxy server and its architecture ppt visual aids files pdf template with various stages. Focus and dispense information on one stages using this creative set, that comes with editable features. It contains large content boxes to add your information on topics like residential, data center, proxy user, central, proxy server. You can also showcase facts, figures, and other relevant content using this PPT layout. Grab it now.
 Home
Home