Data

Strategies For Successful Database Access Governance Program Infographics PDF
This slide outlines the strategies for an effective data access governance program. The purpose of this slide is to demonstrate the techniques for adequate data access. The steps include discovering and segmenting sensitive data, assigning access controls, monitoring user behavior, and rechecking compliance requirements. Pitch your topic with ease and precision using this Strategies For Successful Database Access Governance Program Infographics PDF. This layout presents information on Steps, Description, Impact . It is also available for immediate download and adjustment. So, changes can be made in the color, design, graphics or any other component to create a unique layout.

Integrated Platform Services Enterprise Uses Graphics PDF
This slide showcases integrated platform services enterprise uses addressing a wide range of corporate integration requirements across numerous platforms and data sources. It also includes microservice integration, B2B integration, data integration, etc. Presenting Integrated Platform Services Enterprise Uses Graphics PDF to dispense important information. This template comprises five stages. It also presents valuable insights into the topics including Microservices Integration, B2B Integration, Data Integration. This is a completely customizable PowerPoint theme that can be put to use immediately. So, download it and address the topic impactfully.

Use Cases In Healthcare Improved Through AI Powered Automation Graphics PDF
This slide showcases situations where automated systems are used in healthcare sector. This template aims on creating efficiencies by automating tasks that improve accuracy of data. It includes information related to data entry, billing, processing, etc. Persuade your audience using this Use Cases In Healthcare Improved Through AI Powered Automation Graphics PDF. This PPT design covers four stages, thus making it a great tool to use. It also caters to a variety of topics including Administrative, Data Entry, Document Digitization, Billing And Processing. Download this PPT design now to present a convincing pitch that not only emphasizes the topic but also showcases your presentation skills.
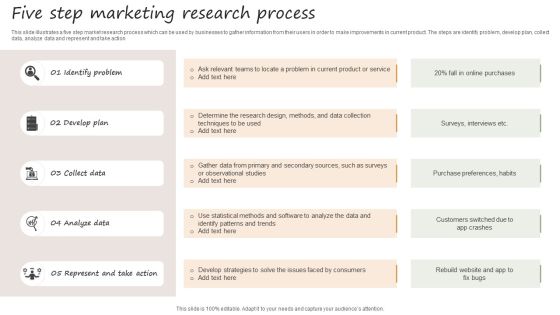
Five Step Marketing Research Process Formats PDF
This slide illustrates a five step market research process which can be used by businesses to gather information from their users in order to make improvements in current product. The steps are identify problem, develop plan, collect data, analyze data and represent and take action. Persuade your audience using this Five Step Marketing Research Process Formats PDF. This PPT design covers five stages, thus making it a great tool to use. It also caters to a variety of topics including Identify Problem, Develop Plan, Collect Data. Download this PPT design now to present a convincing pitch that not only emphasizes the topic but also showcases your presentation skills.

Various Stages Quality Assurance Process Model Ppt PowerPoint Presentation Outline Ideas PDF
Presenting this set of slides with name various stages quality assurance process model ppt powerpoint presentation outline ideas pdf. This is a one stage process. The stages in this process are third party data, reference data from database, review, data input, decision and report, report summary with highlighting inaccuracies, preliminary report, approved quality assurance processes, quality assurance process with recommendations, quality assurance process, continued assessment. This is a completely editable PowerPoint presentation and is available for immediate download. Download now and impress your audience.

Cloud Intelligence Framework For Application Consumption Determining The Suitable Software For Organization Icons PDF
The slide provides the key features comparison of various software that will help the company to achieve its objective of process automation and data security. Deliver and pitch your topic in the best possible manner with this cloud intelligence framework for application consumption determining the suitable software for organization icons pdf. Use them to share invaluable insights on process automation, data security, improve productivity, process automation and data security and impress your audience. This template can be altered and modified as per your expectations. So, grab it now.

Augmented Analytics Implementation IT Challenges Of Implementing Augmented Analytics Formats PDF
This slide represents the challenges to implementing augmented analytics. It includes technical debt, skills gap, unrealistic expectations, and lack of data governance. Technical Debt, Skills Gap, Unrealistic Expectations, Lack Data GovernanceDeliver an awe inspiring pitch with this creative Augmented Analytics Implementation IT Challenges Of Implementing Augmented Analytics Formats PDF bundle. Topics like Technical Debt, Skills Gap, Unrealistic Expectations, Lack Data Governance can be discussed with this completely editable template. It is available for immediate download depending on the needs and requirements of the user.

Augmented Analytics Implementation IT Checklist For Augmented Analytics Implementation Sample PDF
This slide depicts the organizations checklist for augmented analytics implementation, including automatic data identification, proving success before scaling AI analytics investments, demystifying and educating to build trust and data literacy. Deliver and pitch your topic in the best possible manner with this Augmented Analytics Implementation IT Checklist For Augmented Analytics Implementation Sample PDF. Use them to share invaluable insights on Checklist, Automatic Data Identification, Prove Success and impress your audience. This template can be altered and modified as per your expectations. So, grab it now.

Strategies To Improve B2b Consumer Response Surveys Themes PDF
This slide covers strategies to enhance B2B customers experience and feedback through surveys. It includes setting clear survey objectives, develop quality questions, get authentic customer data, use of data analytic tools and utilize all feedback survey methods. Persuade your audience using this Strategies To Improve B2b Consumer Response Surveys Themes PDF. This PPT design covers five stages, thus making it a great tool to use. It also caters to a variety of topics including Use Data Analytic Tools, Develop Quality Questions, Clear Survey Objectives. Download this PPT design now to present a convincing pitch that not only emphasizes the topic but also showcases your presentation skills.

Monthly Work Schedule With Task And Status Ppt PowerPoint Presentation Gallery Rules PDF
The following slide highlight the monthly work plan with task and survey. It showcases tasks, responsible person and status, where the tasks includes quarterly survey, stakeholder engagement with design survey, data verification, collect data, enter data, stakeholder meeting and quarterly meeting as sub activities. Persuade your audience using this Monthly Work Schedule With Task And Status Ppt PowerPoint Presentation Gallery Rules PDF. This PPT design covers four stages, thus making it a great tool to use. It also caters to a variety of topics including Stakeholder Engagement, Quarterly Survey, Responsible Person. Download this PPT design now to present a convincing pitch that not only emphasizes the topic but also showcases your presentation skills.

Four Key Practices Of Stream Processing Ppt PowerPoint Presentation Gallery Gridlines PDF
The following slide outlines some best practices which can be implemented by the organization for data ingestion. Use of artificial intelligence AI, automating the process, reducing the data storage space, make it self-services are the key practices which are highlighted in the slide. Persuade your audience using this Four Key Practices Of Stream Processing Ppt PowerPoint Presentation Gallery Gridlines PDF. This PPT design covers four stages, thus making it a great tool to use. It also caters to a variety of topics including Artificial Intelligence, Data Storage Space, Automating Process. Download this PPT design now to present a convincing pitch that not only emphasizes the topic but also showcases your presentation skills.

Organization Security Issues And Solution Assessment Ideas PDF
This slide showcases problems in firm related to security of crucial data important for organization. The issues include data breach, SPAM, phishing and insider threat. Persuade your audience using this Organization Security Issues And Solution Assessment Ideas PDF. This PPT design covers three stages, thus making it a great tool to use. It also caters to a variety of topics including Data Breach, SPAM And Phishing, Insider Threat. Download this PPT design now to present a convincing pitch that not only emphasizes the topic but also showcases your presentation skills.

Roadmap For 3 Level Web Page Analytics Tools Sample PDF
This slide represents roadmap showcasing 3 level website analytics tools. It includes enabling tools and analyst, advanced integration and data working for business. Persuade your audience using this Roadmap For 3 Level Web Page Analytics Tools Sample PDF. This PPT design covers three stages, thus making it a great tool to use. It also caters to a variety of topics including Data Type Database, Data Working For Business, Analytics And Integration. Download this PPT design now to present a convincing pitch that not only emphasizes the topic but also showcases your presentation skills.

Four Phases Workstreams For Managing Marketing Projects Guidelines PDF
This slide covers four workstreams for managing marketing projects. It involves workstreams such as infrastructure, business intelligence, data management and customer data integration. Persuade your audience using this Four Phases Workstreams For Managing Marketing Projects Guidelines PDF. This PPT design covers four stages, thus making it a great tool to use. It also caters to a variety of topics including Infrastructure Workstream, Business Intelligence, Data Management. Download this PPT design now to present a convincing pitch that not only emphasizes the topic but also showcases your presentation skills.
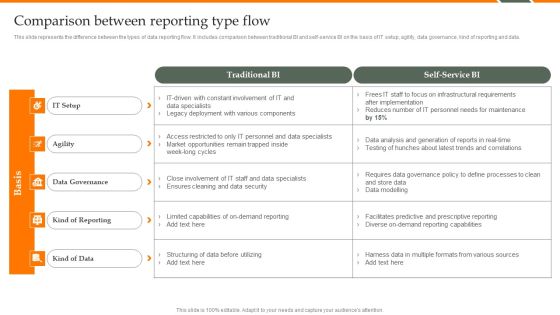
Human Resource Analytics Comparison Between Reporting Type Flow Demonstration PDF
This slide represents the difference between the types of data reporting flow. It includes comparison between traditional BI and self-service BI on the basis of IT setup, agility, data governance, kind of reporting and data. If your project calls for a presentation, then Slidegeeks is your go-to partner because we have professionally designed, easy-to-edit templates that are perfect for any presentation. After downloading, you can easily edit Human Resource Analytics Comparison Between Reporting Type Flow Demonstration PDF and make the changes accordingly. You can rearrange slides or fill them with different images. Check out all the handy templates.

Benefits Of RDBMS Summary PDF
This slide covers the advantages of RDBMS relational database management system for managing data. The purpose of this template is to define the features as well as uses of RDBMS. It includes details related to data integrity, scalability, security, etc.Persuade your audience using this v. This PPT design covers Six stages, thus making it a great tool to use. It also caters to a variety of topics including Data Integrity, Scalability, Simplicity. Download this PPT design now to present a convincing pitch that not only emphasizes the topic but also showcases your presentation skills.

Semantic Web Fundamentals Roadmap For Semantic Web Deployment Background PDF
This slide represents the roadmap for semantic web deployment and development, including the steps to be performed at each months interval. The steps include discovering data, integrating data with meaningful labels, validating, and exploring methods for data transformation. The best PPT templates are a great way to save time, energy, and resources. Slidegeeks have 100 percent editable powerpoint slides making them incredibly versatile. With these quality presentation templates, you can create a captivating and memorable presentation by combining visually appealing slides and effectively communicating your message. Download Semantic Web Fundamentals Roadmap For Semantic Web Deployment Background PDF from Slidegeeks and deliver a wonderful presentation.

Benefits Of Implementing RPA In Healthcare System Sample PDF
This slide covers provide some of the advantages of deploying robotic process automation in medical organization. It includes benefits such as easy data integration, data management, reliability, operating cost, data compilation, customer service, etc. Make sure to capture your audiences attention in your business displays with our gratis customizable Benefits Of Implementing RPA In Healthcare System Sample PDF. These are great for business strategies, office conferences, capital raising or task suggestions. If you desire to acquire more customers for your tech business and ensure they stay satisfied, create your own sales presentation with these plain slides.

Five Categories Of Cloud Migration Service Background PDF
This slide displays a breakdown of the google cloud migration service into five categories. The purpose is to define different phases of the migration process. It includes migration planning, bulk data migration, data migration over a network, server migration, and database migration. Persuade your audience using this Five Categories Of Cloud Migration Service Background PDF. This PPT design covers five stages, thus making it a great tool to use. It also caters to a variety of topics including Migration Planning, Data Migration, Network. Download this PPT design now to present a convincing pitch that not only emphasizes the topic but also showcases your presentation skills.
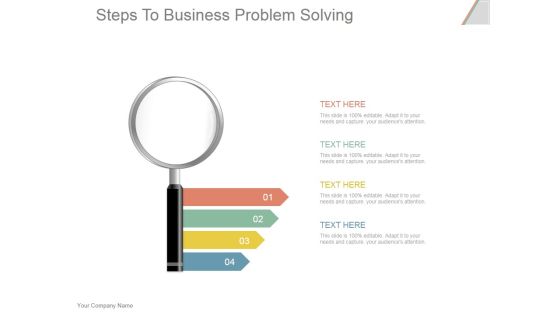
Steps To Business Problem Solving Ppt PowerPoint Presentation Deck
This is a steps to business problem solving ppt powerpoint presentation deck. This is a four stage process. The stages in this process are business, success, big data analysis, arrow, strategy.
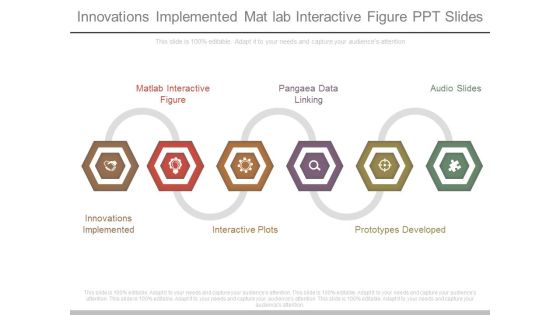
Innovations Implemented Mat Lab Interactive Figure Ppt Slides
This is a innovations implemented mat lab interactive figure ppt slides. This is a six stage process. The stages in this process are mat lab interactive figure, pangaea data linking, audio slides, innovations implemented, interactive plots, prototypes developed.

Business Statistics Ppt Layout Ppt Slide Templates
This is a business statistics ppt layout ppt slide templates. This is a five stage process. The stages in this process are statistics and data mining, operations research, information systems, domain knowledge, it database.

Cloud Computing Project Analysis Diagram Powerpoint Template
Our above PPT slide contains graphics of cloud with technology icons. This PowerPoint template may be used for project related to cloud computing. Use this diagram to impart more clarity to data and to create more sound impact on viewers.
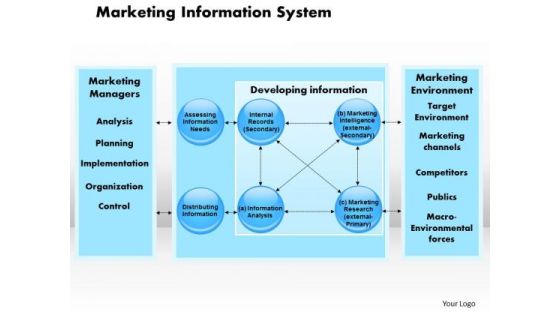
Business Framework Marketing Information System PowerPoint Presentation
This business framework PPt contains the graphic of marketing information system. This system contains the concept of delivering market related information. Use this system for your data based information representation in any presentation.

Business Diagram Four Thermometer For Entrepreneurship Statistics Presentation Template
Graphic of thermometers have been used to design this business diagram. Thermometers can be used to display entrepreneurship statistics. Use this diagram your data and information related topics in any presentation.
Business Diagram Two Icons Info Graphic Presentation Template
Two circular innovative icons has been used to decorate this power point diagram template. This diagram is info graphic for data representation. Use this info graphics for business and management related presentations.

Business Diagram Abstract Info Graphics 3 Steps Presentation Template
This slide displays info graphics three steps diagram. This info graphics template can be used for workflow layout. Simply add your data in this business diagram and create your own customized presentations.
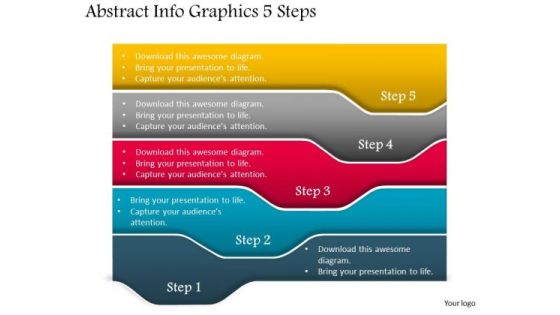
Business Diagram Abstract Info Graphics 5 Steps Presentation Template
This slide displays info graphics five steps diagram. This info graphics template can be used for workflow layout. Simply add your data in this business diagram and create your own customized presentations.

Business Diagram Three Paper Clips For Text Representation Presentation Template
Three paper clips are used to design this power point template slide. This PPT slide has been crafted for data representation techniques. Use this PPT slide for your business and marketing related presentations.
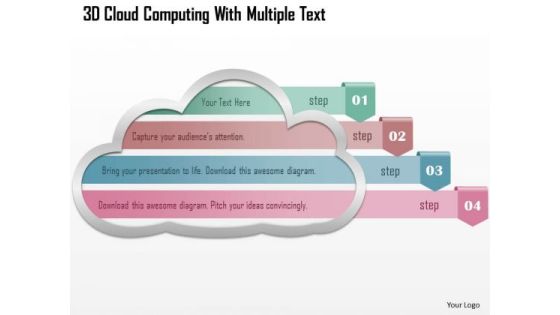
Business Diagram 3d Cloud Computing With Multiple Text PowerPoint Template
This power point template has been crafted with graphic of 3d clouds. This PPT slide contains the concept of cloud computing and data representation. This PPT can be used for cloud technology related presentations.

Business Diagram Four Colored Tablets With Text Boxes Presentation Template
Graphic of four colored tablets has been used to design this power point template diagram. This PPT diagram contains the concept of data and text representation. Use this PPT for marketing and business related presentations.

Business Diagram Four Balloons With Text Boxes PowerPoint Template
Graphic of four balloons style text box diagram has been used to design this power point template slide. This PPT slide contains the concept of business data flow. Use this PPT for your business and marketing related presentations.
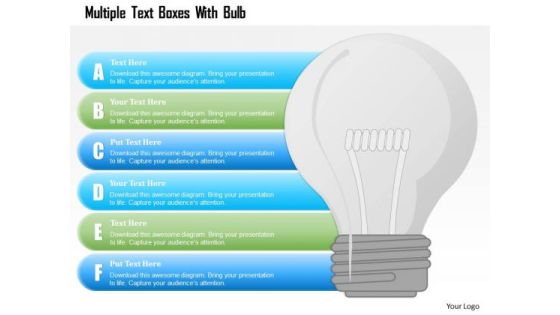
Busines Diagram Multiple Text Boxes With Bulb Presentation Template
This business diagram has been designed with graphic of multiple text boxes and bulb. This slide can be used for data representation and idea generation. Use this slide for your business and technology related presentations.
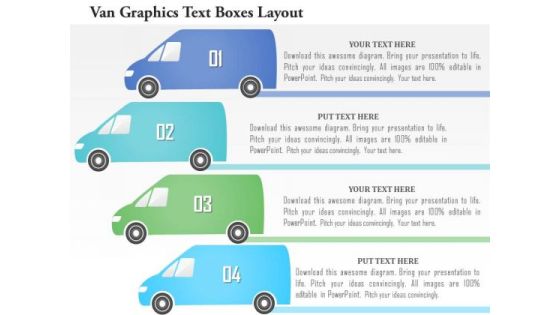
Business Diagram Van Graphics Text Boxes Layout Presentation Template
This business diagram has been designed with graphic of van style four text boxes. These text boxes are used to display data for any process. Download this diagram to build an exclusive presentation for your views.
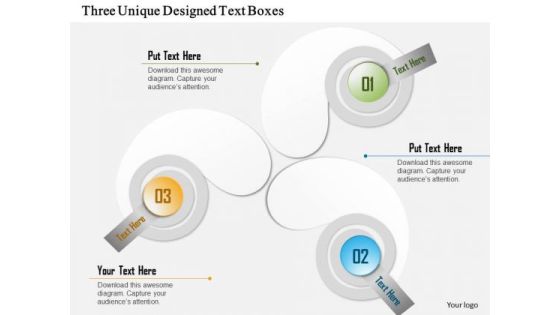
Three Unique Designed Text Boxes Presentation Template
Three unique designed text boxes are used to design this PPT. this PPT can be used for showing concept of data representation. Use this PPT and make an innovative presentation.

Four Horizontal Text Banners Powerpoint Template
This PowerPoint template has been designed with four horizontal text banners. This diagram is excellent visual tools for business presentations. Download this PPT slide to explain complex data immediately and clearly.
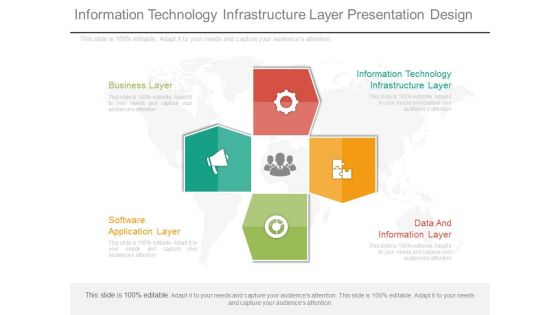
Information Technology Infrastructure Layer Presentation Design
This is an information technology infrastructure layer presentation design. This is a four stage process. The stages in this process are business layer, information technology infrastructure layer, data and information layer, software application layer.
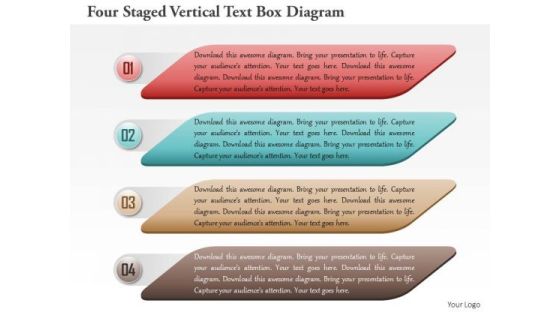
Business Diagram Four Staged Vertical Text Box Diagram Presentation Template
This PPT slide contains the concept of business data analysis. This Power Point template slide has been designed with graphic of four staged vertical text boxes diagram. Use this PPT slide and build an innovative presentation for your viewers.
Business Diagram Man Silhouette With Mobile And Text Boxes Presentation Template
This power point template slide has been crafted with graphic of businessman and mobile. This PPT contains the concept of data technology and communication. Use this PPT slide for business and internet related presentations.
Business Diagram Abstract Tree Graphic For Text Representation Presentation Template
This business diagram displays tree graphics with text boxes. This business slide contains the concept of data representation. Use this diagram to display business information more effectively and to build professional presentation for your viewers.

Business Diagram Five Staged Pencil Style Text Boxes Presentation Template
Our above slide displays five staged pencil style text boxes. Download our above diagram to express information in a visual way. Use this diagram and get good comments for data related presentations.
Business Diagram Six Numbers Human Face Text Layout Presentation Template
Graphic of six numeric tags and human face has been used to design this business diagram. Download our above diagram to express information in a visual way. Use this diagram and get good comments for data related presentations.

Board With Bar Graph For Financial Analysis Powerpoint Slides
You can download this PowerPoint template to display statistical data and analysis. This PPT slide contains display board with bar graph. Draw an innovative business idea using this professional diagram.

Business Diagram Laptop Made With Puzzle For Text Display Presentation Template
This Power Point template slide has been crafted with graphic of laptop which is made with puzzles. This PPT slide contains the concept of text representation. Use this PPT slide for business data representation.
Business Diagram Four Colored Gears Hexagon Text Boxes For Process Flow Presentation Template
Four colored gears hexagon text boxes are used to design this power point template. This diagram contains hexagons for data representation. Use this diagram to display business process workflows in any presentation.

Business Diagram Highway Signboard With Road And Text Boxes PowerPoint Template
Graphic of highway signboard with road and text has been used to craft this power point template diagram. This PPT contains the concept of transportation and data representation. Use this PPT for your business and management related presentations.
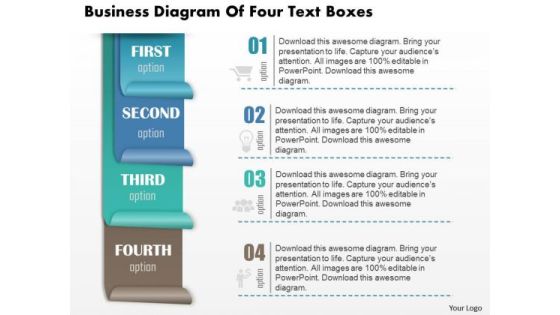
Business Diagram Of Four Text Boxes Presentation Slide Template
This business diagram power point slide has been crafted with four text boxes. Explain business data and calculation with this innovative diagram slide. Use this diagram slide for business and marketing presentations.
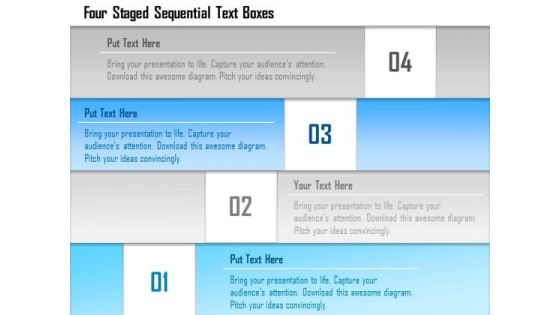
Business Diagram Four Staged Sequential Text Boxes Presentation Template
Four staged sequential stair designed text boxes are used to design this power point template. This PPT contains the concept of data flow. Use this PPT for your business and finance related presentations.
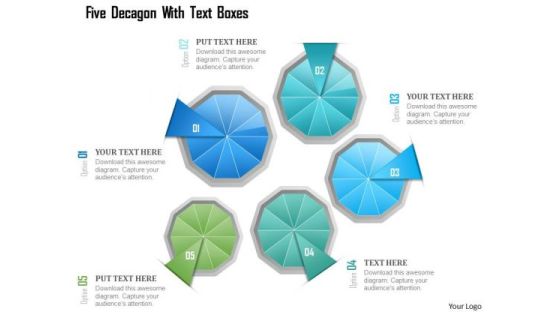
Busines Diagram Five Decagon With Text Boxes Presentation Template
This business diagram has been designed with graphic of five decagon and text boxes. This slide contains the concept of business data flow. Deliver amazing presentations to mesmerize your audience.

Busines Diagram Four Bulb Design For Text Representation Presentation Template
Four bulb design text diagram has been used to design this business slide. Use this diagram to display data in visual manner. This slide offers an excellent background to build professional presentations.

Business Diagram Of Two Text Boxes With Globe Presentation Template
This power point template has been designed with graphic of two text boxes and globe. This PPT contains the concept of global business data representation. Use this PPT for your global business related topics in any presentation.

Business Diagram Four Staged Semicircular Text Box Diagram PowerPoint Template
Four staged semicircular text boxes diagram has been used to design this power point template. This diagram template contains the concept of data and process flow. Use this PPT for your business and marketing related presentations.

Business Diagram Three Staged Text Representation Diagram Presentation Template
Display the concept of data flow in any presentation with this unique power point template. This PPT contains the graphic of three staged text boxes. Use this PPT for your business and management related presentations.
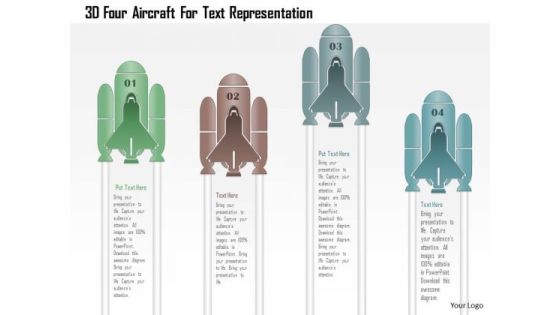
Business Diagram 3d Four Aircraft For Text Representation PowerPoint Template
Graphic of 3d four aircraft text boxes has been used to design this power point template. This PPT slide contains the concept of data flow. Use this PPT slide for business and sales related presentations.
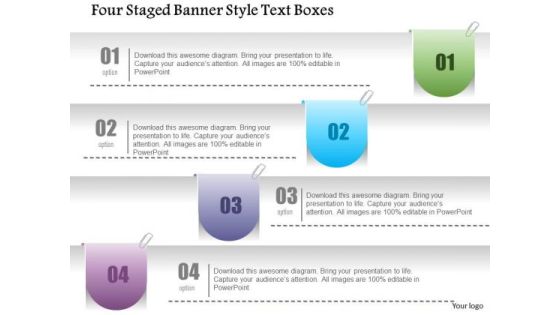
Business Diagram Four Staged Banner Style Text Boxes PowerPoint Template
Four staged banner style text boxes are used to craft this power point template slide. This PPT slide contains the concept of data updating and representation. Use this PPT and crate an impact on your viewers.

Business Diagram Three Colored Text Boxes Representation PowerPoint Template
Three colored text boxes diagram has been used to design this power point template. This PPT contains the concept of process based data representation. This PPT is suitable for business and sales related presentations.
Business Diagram Three Icons Arrow Text Boxes PowerPoint Template
Graphic of three icons and arrow text boxes are used to craft this power point template slide. This PPT contains the concept of business growth. This PPT slide is suitable for business and marketing data flow related presentations.
Four Sequential Text Banners With Icons Powerpoint Template
This PowerPoint template has been designed with four sequential text banners and icons. This diagram is excellent visual tools for business presentations. Download this PPT slide to explain complex data immediately and clearly.
Four Colored Text Boxes With Icons Powerpoint Slides
This PowerPoint template has been designed with graphics of four text boxes. Download this PPT slide to display percentage data display. Use this professional template to build an exclusive presentation.

Business Diagram Six Staged Ribbon Style Text Boxes Presentation Template
Graphic of four staged diagram has been used to design this power point template slide. This PPT slide contains the data flow. This PPT slide can be used for business and marketing related presentations.
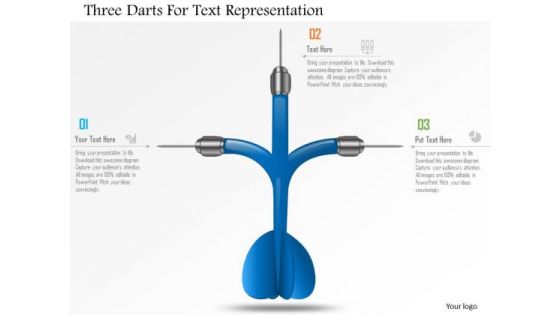
Business Diagram Three Darts For Text Representation Presentation Template
Graphic of three darts has been used to design this power point template. This PPT contains the concept of data representation. Use this PPT and build an exclusive presentation for your viewers.
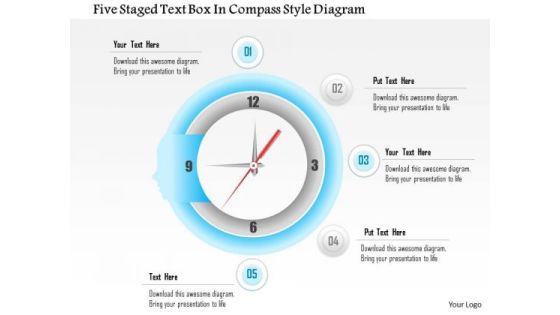
Business Diagram Five Staged Text Box In Compass Style Diagram Presentation Template
This Power Point template slide has been designed with graphic of five staged text boxes. This PPT slide contains the compass style diagram. This PPT slide can display data analysis. Use this PPT slide for your business presentations.
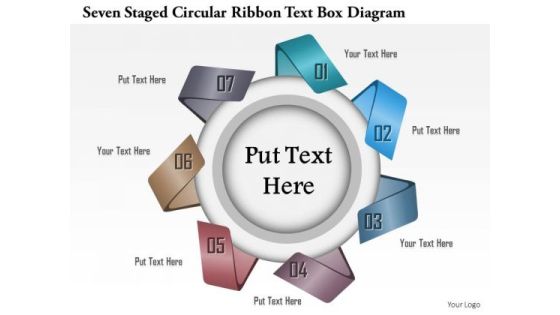
Business Diagram Seven Staged Circular Ribbon Text Box Diagram Presentation Template
This Power Point template slide has been used to display the concept of business data analysis. This PPT slide contains the graphic of seven staged circular ribbon style text boxes. Use this PPT slide for your business presentations.
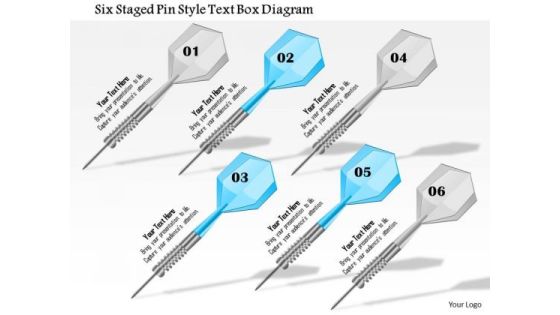
Business Diagram Six Staged Pin Style Text Box Diagram Presentation Template
This Power Point template slide has been crafted with graphic of six staged pin style text boxes. This PPT slide contain the concept of sales data analysis. Use this PPT slide for your business and sales related presentations.

Telehealth Management Of Tele Biomarkers Information Portrait PDF
This slide represents the digital biomarkers data management architecture, and its components include raw information from assays, data parsing, metadata, biomarker data, metadata cataloguing and harmonization, clinical data pipeline, and so on. Are you in need of a template that can accommodate all of your creative concepts This one is crafted professionally and can be altered to fit any style. Use it with Google Slides or PowerPoint. Include striking photographs, symbols, depictions, and other visuals. Fill, move around, or remove text boxes as desired. Test out color palettes and font mixtures. Edit and save your work, or work with colleagues. Download Telehealth Management Of Tele Biomarkers Information Portrait PDF and observe how to make your presentation outstanding. Give an impeccable presentation to your group and make your presentation unforgettable.

Business Diagram Five Staged Circular Process Diagram For Text Representation Presentation Template
Our above slide displays Five staged circular process diagram. Download our above diagram to express information in a visual way. Use this diagram and get good comments for data related presentations.

Business Diagram Four Staged Torn Paper For Text Display PowerPoint Template
Four staged torn paper style text boxes has been used to design this power point template. This PPT contains the concept of text representation for business process. Use this PPT and build quality presentation for data and process related topics.
Business Diagram Innovative Icons Infographic Presentation Template
Three circular innovative icons has been used to decorate this power point diagram template. This diagram is info graphic for data representation. Use this info graphics for business and management related presentations.

Biomarker Categorization Management Of Digital Biomarkers Information Pictures PDF
This slide represents the digital biomarkers data management architecture, and its components include raw information from assays, data parsing, metadata, biomarker data, metadata cataloguing and harmonization, clinical data pipeline, and so on. Explore a selection of the finest Biomarker Categorization Management Of Digital Biomarkers Information Pictures PDF here. With a plethora of professionally designed and pre made slide templates, you can quickly and easily find the right one for your upcoming presentation. You can use our Biomarker Categorization Management Of Digital Biomarkers Information Pictures PDF to effectively convey your message to a wider audience. Slidegeeks has done a lot of research before preparing these presentation templates. The content can be personalized and the slides are highly editable. Grab templates today from Slidegeeks.
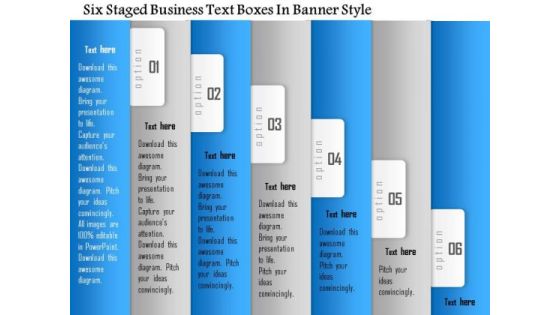
Business Diagram Six Staged Business Text Boxes In Banner Style Presentation Template
This Power Point template slide contains the concept of business data representation. This PPt slide has been designed with graphic of six staged business text boxes. Use this template slide and build innovative presentation for your viewers.
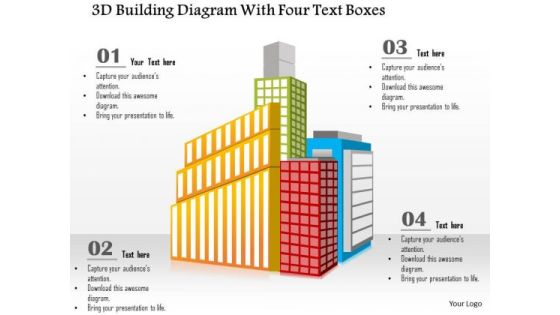
Busines Diagram 3d Building Diagram With Four Text Boxes Presentation Template
This business diagram has been designed with graphic of 3d building diagram and four text boxes. This business slide is useful for data representation. Use this diagram to make professional presentations.

Busines Diagram 3d Pencil With Multicolor And Text Boxes Presentation Template
This business diagram displays four text boxes around a pencil. This professional slide can be used for data display in visual manner. Download this diagram for your school and education related presentations.
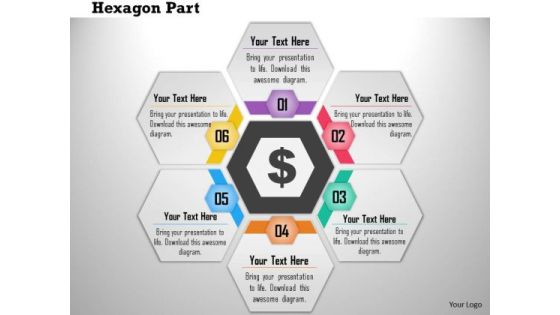
Business Diagram Six Hexagon Text Boxes In Cyclic Order Presentation Template
This PowerPoint template has been designed with graphic of six hexagon text boxes in cyclic order. This diagram can be used to depict data flow. Use this diagram to build exclusive presentation for your viewers.

Business Diagram Four Staged Road Sign Diagram For Text Representation Presentation Template
Four staged road sign diagram has been used to design this power point template. This PPT contains the concept of text and data representation. Use this PPT and build quality presentation for your viewers.

Business Diagram Three Hut Shaped Graphics For Text Representation Presentation Template
Three staged hut shaped graphics has been used to craft this power point template. This PPT contains the concept of text representation. Use this PPT for business and marketing data related presentations.
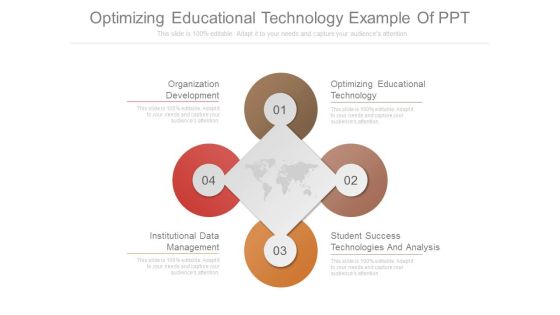
Optimizing Educational Technology Example Of Ppt
This is a optimizing educational technology example of ppt. This is a four stage process. The stages in this process are organization development, institutional data management, student success technologies and analysis, optimizing educational technology.

Digital Resilience Biomarker Technologies IT Management Of Digital Biomarkers Information Ideas PDF
This slide represents the digital biomarkers data management architecture, and its components include raw information from assays, data parsing, metadata, biomarker data, metadata cataloguing and harmonization, clinical data pipeline, and so on. Get a simple yet stunning designed Digital Resilience Biomarker Technologies IT Management Of Digital Biomarkers Information Ideas PDF. It is the best one to establish the tone in your meetings. It is an excellent way to make your presentations highly effective. So, download this PPT today from Slidegeeks and see the positive impacts. Our easy to edit Digital Resilience Biomarker Technologies IT Management Of Digital Biomarkers Information Ideas PDF can be your go to option for all upcoming conferences and meetings. So, what are you waiting for Grab this template today.

Business Diagram Five Staged Pin Style Text Box Diagram Presentation Template
This Power Point template slide has been designed with graphic of five staged pin style boxes. This PPT slide contains the concept of business data representation. Use this PPT slide for your business presentation.
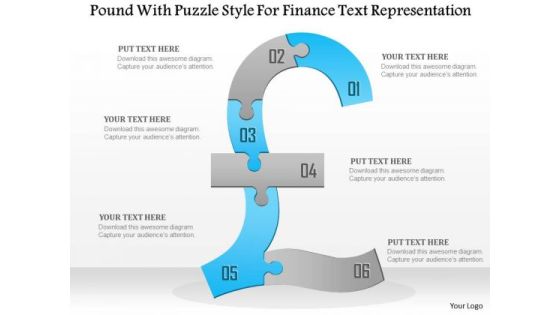
Business Diagram Pound With Puzzle Style For Finance Text Representation Presentation Template
This Power Point template slide has been used to display the concept of financial data representation. This PPT slide contains the graphic of pound in puzzle style. Use this PPT slide and make an exclusive presentation for financial topics.

Business Diagram Seven Staged Flower Petal Diagram For Text Representation Presentation Template
This business diagram displays seven staged flower petal diagram. This Power Point slide can be used for data representation. Use this PPT slide to show flow of activities in circular manner. Get professional with this exclusive business slide.
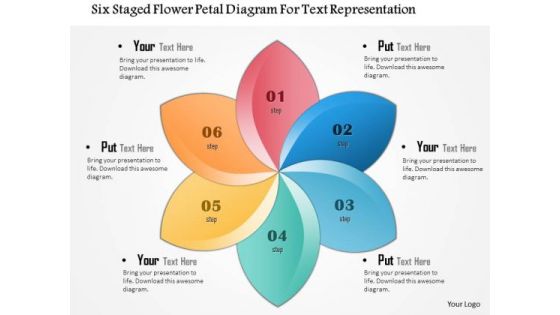
Business Diagram Six Staged Flower Petal Diagram For Text Representation Presentation Template
This business diagram displays six staged flower petal diagram. This Power Point slide can be used for data representation. Use this PPT slide to show flow of activities in circular manner. Get professional with this exclusive business slide.

Stock Photo Small And Big Cubes For Text Representation PowerPoint Slide
This Power Point template has been crafted with graphic of cubes. This image slide contains the concept data representations. Use this editable image slide for your business and marketing related topics and to impress your viewers.
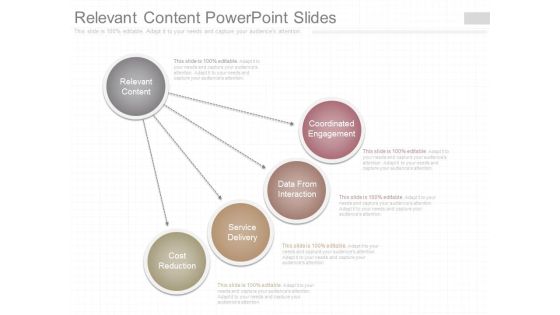
Relevant Content Powerpoint Slides
This is a relevant content powerpoint slides. This is a four stage process. The stages in this process are relevant content, coordinated engagement, data from interaction, service delivery, cost reduction.

Bulb With Business Analysis Icons Powerpoint Templates
This PowerPoint slide contains graphics of bulb diagram with icons. It helps to exhibit concepts of sales planning. Use this diagram to impart more clarity to data and to create more sound impact on viewers.

Predictive Analytics Steps Ppt PowerPoint Presentation Portfolio Template
This is a predictive analytics steps ppt powerpoint presentation portfolio template. This is a six stage process. The stages in this process are define project, benefits, stages, statistics, data analysis.

Business Diagram Four Staged Infographics Arrow Diagram Presentation Template
Graphic of four staged info graphics arrow diagram has been used to craft this power point template diagram. This PPT diagram contains the concept of data and text representation. Use this PPT for marketing and business related presentations.

Content Ppt PowerPoint Presentation File Display
This is a content ppt powerpoint presentation file display. This is a six stage process. The stages in this process are introduction, data analysis, cost of quality, quality control.

Content Ppt PowerPoint Presentation Show Slides
This is a content ppt powerpoint presentation show slides. This is a six stage process. The stages in this process are introduction, tools of quality management, data analysis, cost of quality, quality control.

Content Ppt PowerPoint Presentation Layouts Elements
This is a content ppt powerpoint presentation layouts elements. This is a six stage process. The stages in this process are introduction, data analysis, cost of quality, quality control, tools of quality management.

Content Ppt PowerPoint Presentation Pictures Background
This is a content ppt powerpoint presentation pictures background. This is a six stage process. The stages in this process are introduction, principles and certification, tools of quality management, data analysis, cost of quality, quality control.

Content Ppt PowerPoint Presentation Inspiration Microsoft
This is a Content Ppt PowerPoint Presentation Inspiration Microsoft. This is a six stage process. The stages in this process are introduction, principles and certification, tools of quality management, data analysis, cost of quality, quality control.

Optimizing Educational Technology Powerpoint Templates Microsoft
This is a optimizing educational technology powerpoint templates microsoft. This is a six stage process. The stages in this process are information security, technology and analytics, institutional data management, optimizing educational technology, it workforce hiring and retention, it funding models.

Pyramid For Financial Accounting Information Powerpoint Slides
This PowerPoint template has been designed with graphics of pyramid chart. This PPT slide can be used to prepare presentations for profit growth report and also for financial data analysis. You can download finance PowerPoint template to prepare awesome presentations.

Bars Displaying Percentage Growth PowerPoint Templates
Our above PPT slide contains bar graph displaying percentage growth. This diagram of bar graph helps to depict statistical information. Use this diagram to impart more clarity to data and to create more sound impact on viewers.

Bulb Infographic For Business Analysis Powerpoint Templates
This PowerPoint slide contains graphics of bulb diagram with icons. It helps to exhibit concepts of marketing strategy. Use this diagram to impart more clarity to data and to create more sound impact on viewers.

Business Analysis Tools Presentation Images
This is a business analysis tools presentation images. This is a eight stage process. The stages in this process are actionable insights and outcomes, management, organization, strategy, marketing, analysis, information and data assets, business contact and user experience.
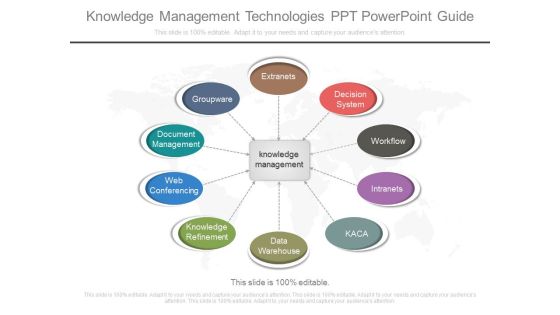
Knowledge Management Technologies Ppt Powerpoint Guide
This is a knowledge management technologies ppt powerpoint guide. This is a ten stage process. The stages in this process are extranets, groupware, document management, web conferencing, knowledge refinement, data warehouse, decision system, workflow, intranets, kaca, knowledge management.
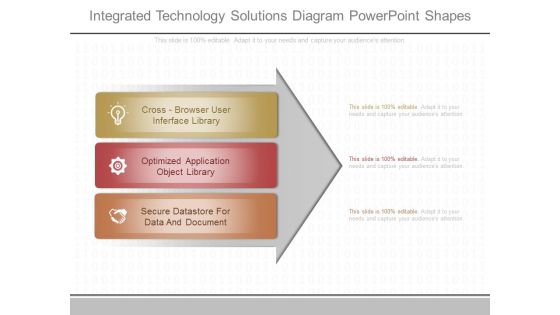
Integrated Technology Solutions Diagram Powerpoint Shapes
This is a integrated technology solutions diagram powerpoint shapes. This is a three stage process. The stages in this process are cross browser user interface library, optimized application object library, secure datastore for data and document.
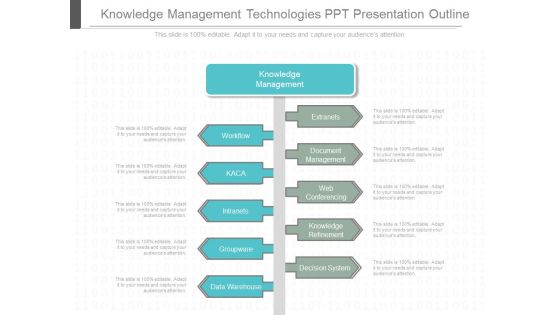
Knowledge Management Technologies Ppt Presentation Outline
This is a knowledge management technologies ppt presentation outline. This is a ten stage process. The stages in this process are knowledge management, workflow, kaca, intranets, groupware, data warehouse, extranets, document management, web conferencing, knowledge refinement, decision system.
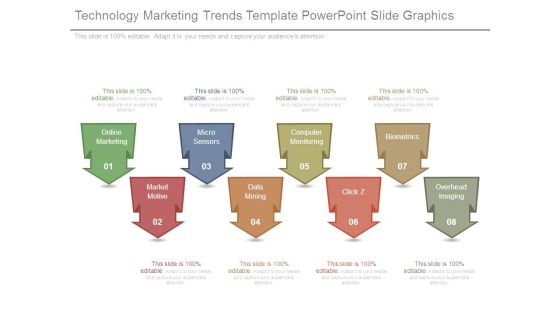
Technology Marketing Trends Template Powerpoint Slide Graphics
This is a technology marketing trends template powerpoint slide graphics. This is a eight stage process. The stages in this process are online marketing, market motive, micro sensors, data mining, computer monitoring, click z, biometrics, overhead imaging.
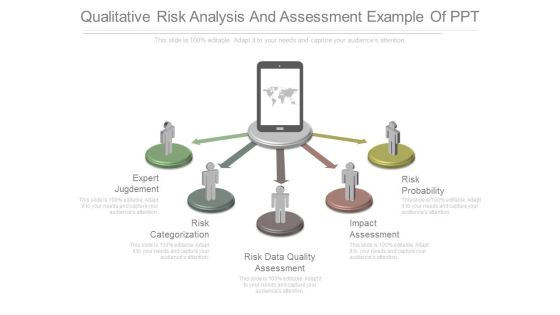
Qualitative Risk Analysis And Assessment Example Of Ppt
This is a qualitative risk analysis and assessment example of ppt. This is a five stage process. The stages in this process are expert jugdement, risk categorization, risk data quality assessment, impact assessment, risk probability.

Consumer Insights Outline Ppt PowerPoint Presentation Icon Example File
This is a consumer insights outline ppt powerpoint presentation icon example file. This is a six stage process. The stages in this process are research methodology, key statistics, data collection, need for consumer insights.

Professional Development Debt Management Online Marketing Employee Assessment Ppt PowerPoint Presentation Layouts Graphics Download
This is a professional development debt management online marketing employee assessment ppt powerpoint presentation layouts graphics download. This is a five stage process. The stages in this process are professional development plans, statistics data mining, performance rewards.

User Experience Management With Database Diagram Slides
This is a user experience management with database diagram slides. This is a six stage process. The stages in this process are web, harvesting, text database, linguistic analysis, refinement, fact database, data analysis, web ui, alerts, api, user experience.
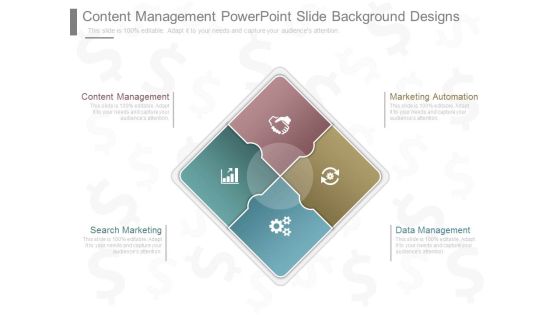
Content Management Powerpoint Slide Background Designs
This is a content management powerpoint slide background designs. This is a four stage process. The stages in this process are marketing automation, data management, content management, search marketing.

Best Practices To Ensure High Quality Integrated Logistics Efficiency Download PDF
This slide shows some of the best practices that must be followed by every company in order to enhance integrated logistics efficiency such as warehouse automation, robotics, internet of things, blockchain technology, data analytics and big data, cloud computing, autonomous vehicles etc. This is a best practices to ensure high quality integrated logistics efficiency download pdf template with various stages. Focus and dispense information on eight stages using this creative set, that comes with editable features. It contains large content boxes to add your information on topics like warehouse automation, robotics, internet of things, blockchain technology, data analytics and big data. You can also showcase facts, figures, and other relevant content using this PPT layout. Grab it now.
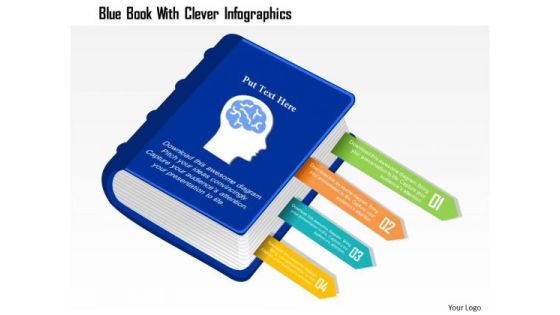
Business Diagram Blue Book With Clever Infographics Presentation Template
Graphic of blue book with clever info graphics has been used to craft this power point template. This PPT diagram contains the concept of educational data representation. Use this PPT for business and marketing related presentations.

Business Diagram 3d Circular Infographics With Target Achievement PowerPoint Template
This power point template has been crafted with graphic of 3d circular info graphics. This PPT slide contains the concept of data representation and target achievement. This PPT can be used for target and success related presentations.
Business Diagram Navigation Icon Around Circle Presentation Template
Five staged business info graphics been used to design this power point template. This diagram contains the concept of data representation. Use this diagram for business and finance related presentations

WMS Application To Increase Integrated Logistics Effectiveness Best Practices To Ensure High Quality Integrated Mockup PDF
This slide shows some of the best practices that must be followed by every company in order to enhance integrated logistics efficiency such as warehouse automation, robotics, internet of things, blockchain technology, data analytics and big data, cloud computing, autonomous vehicles etc. This is a wms application to increase integrated logistics effectiveness best practices to ensure high quality integrated mockup pdf template with various stages. Focus and dispense information on eight stages using this creative set, that comes with editable features. It contains large content boxes to add your information on topics like warehouse automation, robotics, internet of things, blockchain technology, data analytics and big data. You can also showcase facts, figures, and other relevant content using this PPT layout. Grab it now.
Cloud With Lock For Cloud Technology Powerpoint Template
This PowerPoint template contains graphics of cloud with lock. This PPT slide helps to portray concepts of cloud computing and data protection. Use this technology template design to illustrate your ability.

Stock Photo Clouds With Laptops For Cloud Technology PowerPoint Slide
This Power Point template has been crafted with graphic of cloud and laptop. Display the concept of cloud computing with this image slide. Use this professional image for your cloud technology and data transfer related topics.

Stock Photo Multiple Clouds With Colors For Technology PowerPoint Slide
Multiple clouds with colors are used to decorate this power point template. This PPT contains the concept of cloud computing and data technology. Use this PPT and build unique presentation for your viewers.

Introduction Of Information System Diagram Powerpoint Guide
This is a introduction of information system diagram powerpoint guide. This is a six stage process. The stages in this process are executive information systems, purpose, transaction processing systems, information processes, participants, data information.
Value Added Actionable Information Powerpoint Slide Influencers
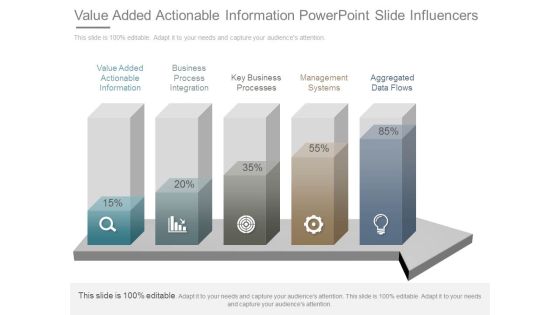
This is a value added actionable information powerpoint slide influencers. This is a five stage process. The stages in this process are value added actionable information, business process integration, key business processes , management systems, aggregated data flows.
Information Delivery Plan Template Example Ppt Presentation
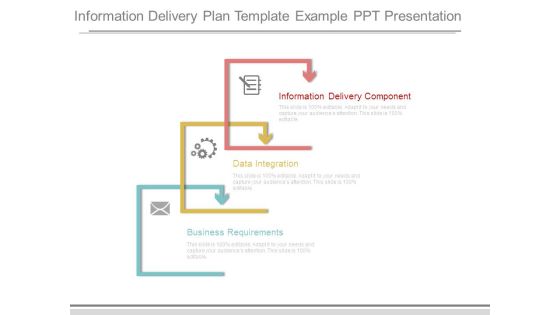
This is a information delivery plan template example ppt presentation. This is a three stage process. The stages in this process are information delivery component, data integration, business requirements.
Gap Analysis Approach Diagram Powerpoint Layout
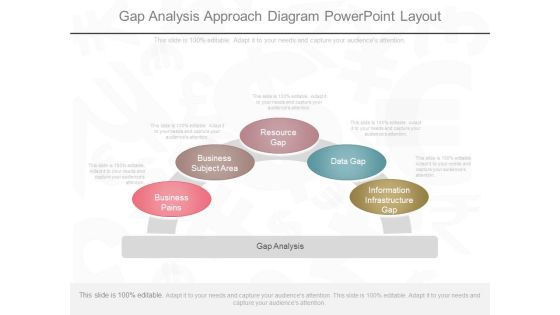
This is a gap analysis approach diagram powerpoint layout. This is a five stage process. The stages in this process are information infrastructure gap, data gap, resource gap, business subject area, business pains.

Accounting Cost Information Layout Powerpoint Templates
This is a accounting cost information layout powerpoint templates. This is a six stage process. The stages in this process are true costs, coat accounting, estimating, hourly cost rates, plant data collection, management system, production standards.

Marketing Information System Example Ppt Slide Themes
This is a marketing information system example ppt slide themes. This is a six stage process. The stages in this process are government resources, customers, sales force, marketing research, data analytics, interactive marketing.
Five Banners With Communication And Technology Icons Powerpoint Template
This PowerPoint template has been designed with five banners and communication technology icons. This diagram is excellent visual tools for business presentations. Download this PPT slide to explain complex data immediately and clearly.
Four Circle Steps For Process Analysis Powerpoint Slides
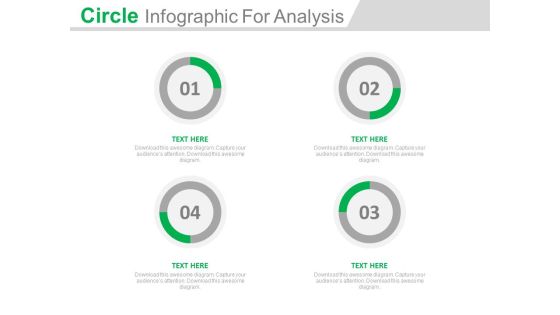
This innovative, stunningly beautiful dashboard has been designed for data visualization. It contains four circles steps for process analysis. This PowerPoint template helps to display your information in a useful, simple and orderly way.

Seed Funding Ppt PowerPoint Presentation Complete Deck With Slides
This is a seed funding ppt powerpoint presentation complete deck with slides. This is a one stage process. The stages in this process are tables, teamwork, technology, data analysis, marketing.

Cloud Technology Ecosystem And Tools Ppt Images Gallery
This is a cloud technology ecosystem and tools ppt images gallery. This is a nine stage process. The stages in this process are databases, storage, big four, specialized, infrastructure, data center, large analytic, service.
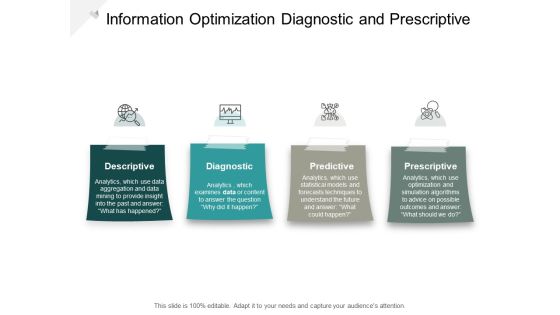
Information Optimization Diagnostic And Prescriptive Ppt PowerPoint Presentation Infographic Template Smartart Cpb
This is a information optimization diagnostic and prescriptive ppt powerpoint presentation infographic template smartart cpb. This is a four stage process. The stages in this process are data analysis, analytics architecture, analytics framework.

Real Estate Development Analysis Powerpoint Slides Show
This is a real estate development analysis powerpoint slides show. This is a five stage process. The stages in this process are development analysis, financial and economic analysis, environmental data impact analysis, customer base management analysis, real estate development analysis.

Market Research And Analysis Diagram Ppt Sample
This is a market research and analysis diagram ppt sample. This is a five stage process. The stages in this process are location analysis, data mining, sowt analysis, market research and analysis, competition analysis, marketing potential.
Pencil With Education And Technology Icons Powerpoint Templates
Our above PPT slide contains graphics of pencil diagram. This business diagram helps to display outline of business plan. Use this diagram to impart more clarity to data and to create more sound impact on viewers.

Customer Analysis Powerpoint Slide Presentation Examples
This is a customer analysis powerpoint slide presentation examples. This is a six stage process. The stages in this process are customer analysis, true capabilities analysis, market competitive analysis, data mining and profiting, segmenting and targeting, positioning and differentiating.

Market Competitive Analysis Powerpoint Slide Deck
This is a market competitive analysis powerpoint slide deck. This is a six stage process. The stages in this process are customer analysis, true capabilities analysis, market competitive analysis, positioning and differentiating, segmenting and targeting, data mining and profiting.

Competitor Analysis Strategic Applications Powerpoint Show
This is a competitor analysis strategic applications powerpoint show. This is a five stage process. The stages in this process are competitor analysis, implementation & monitoring, data acquisition, knowledge development tools, strategic applications.
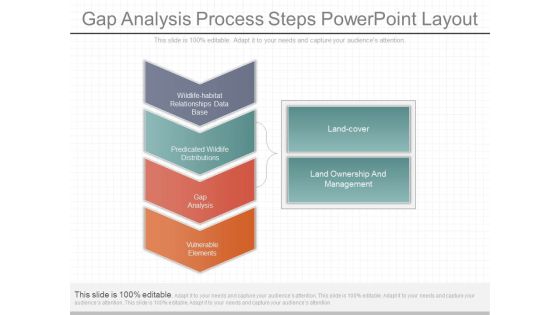
Gap Analysis Process Steps Powerpoint Layout
This is a gap analysis process steps powerpoint layout. This is a six stage process. The stages in this process are wildlife habitat relationships data base, predicated wildlife distributions, gap analysis, vulnerable elements, land cover, land ownership and management.

Gear Infographic For Business Analysis PowerPoint Templates
Our above slide contains diagram of gear infographic. This gear infographic slide helps to exhibit business analysis. Use this diagram to impart more clarity to data and to create more sound impact on viewers.
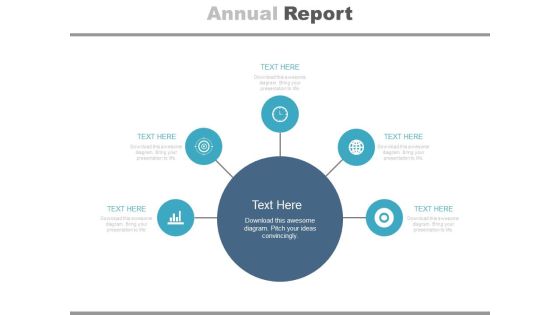
Diagram For Market Research Analysis Powerpoint Slides
This PowerPoint template has been designed with circular infographic diagram. It can be used to display steps for market research and also for financial data analysis. You can download finance PowerPoint template to prepare awesome presentations.

Financial Analysis Basics Ppt Slide Examples
This is a financial analysis basics ppt slide examples. This is a three stage process. The stages in this process are reduce uncertainty, apply analytical tools, involves data transform.
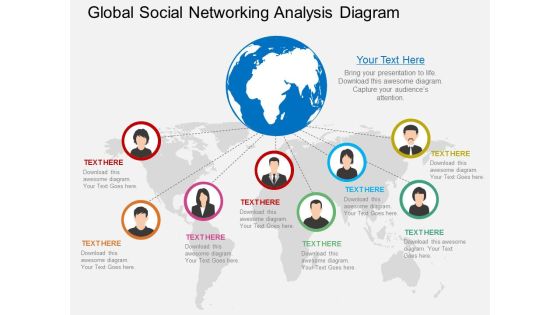
Global Social Networking Analysis Diagram Powerpoint Template
Our above PowerPoint slide contains diagram of globe with people pictures. Download this business slide to illustrate social networking. Use this diagram to impart more clarity to data and to create more sound impact on viewers.
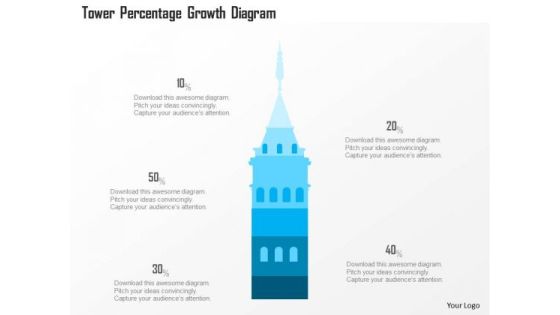
Business Diagram Tower Percentage Growth Diagram Presentation Template
This power point diagram slide has been crafted with graphic of 3d blue tower and text boxes. This PPT slide contains the concept of data and text representations. Use this PPT slide for your business and management related presentations.

Product Roadmap Template 2 Ppt PowerPoint Presentation Infographic Template Information
This is a product roadmap template 2 ppt powerpoint presentation infographic template information. This is a six stage process. The stages in this process are product launch, tech support portal, bootstrap upgrade, data logging module, chrome support.

Business Diagram Global Business And Marketing Agenda Diagram Presentation Template
Display the concept of global agenda and marketing agenda in your business presentation. This PPT slide contains the graphic of text boxes. Use this PPT slide for your business and marketing data related presentations.

Competitive Analysis Scatter Chart Radar Chart Ppt PowerPoint Presentation Infographics
This is a competitive analysis scatter chart radar chart ppt powerpoint presentation infographics. This is a eight stage process. The stages in this process are users interface, data import, example, pricing, support, update, tutorials, easy to use.

Strategic Analysis Business Value Example Of Ppt Presentation
This is a strategic analysis business value example of ppt presentation. This is an eight stage process. The stages in this process are strategic analysis, business value, process analysis, production support, operational analysis, data analysis agile, product management, tactical analysis.
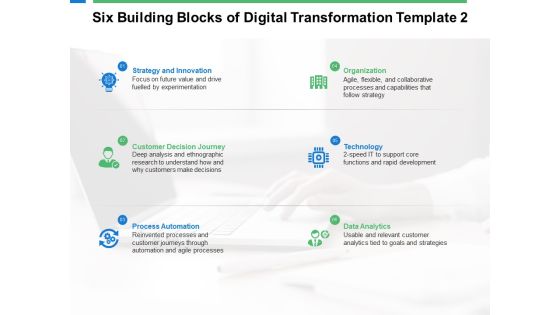
Six Building Blocks Of Digital Transformation Technology Ppt PowerPoint Presentation Infographic Template Guide
This is a six building blocks of digital transformation technology ppt powerpoint presentation infographic template guide. This is a six stage process. The stages in this process are process automation, organization, technology, data and analytics, strategy and innovation.

Measurement Of Portfolio Analysis Ppt PowerPoint Presentation Clipart
This is a measurement of portfolio analysis ppt powerpoint presentation clipart. This is a two stage process. The stages in this process are your current portfolio, holding, current weight, current value, data analysis.

Measurement Of Portfolio Analysis Ppt PowerPoint Presentation Topics
This is a measurement of portfolio analysis ppt powerpoint presentation topics. This is a ten stage process. The stages in this process are data analysis, holding, current weight, current value.

Pie Charts For Financial Ratio Analysis Powerpoint Slides
This PowerPoint template has been designed with diagram of pie charts. This PPT slide can be used to prepare presentations for profit growth report and also for financial data analysis. You can download finance PowerPoint template to prepare awesome presentations.

Process Of Web Security Testing And Analysis Ppt Design
This is a process of web security testing and analysis ppt design. This is a six stage process. The stages in this process are error handing, controlled access, session management, network security, server and code management, data access.

Competitive Analysis Template 6 Scatter Chart Ppt PowerPoint Presentation Shapes
This is a competitive analysis template 6 scatter chart ppt powerpoint presentation shapes. This is a one stage process. The stages in this process are users interface, data import, example, pricing, support update, tutorials, easy to use.

Competitive Analysis Scatter Chart Template 2 Ppt PowerPoint Presentation Files
This is a competitive analysis scatter chart template 2 ppt powerpoint presentation files. This is a nine stage process. The stages in this process are users interface, data import, example, pricing, support, update.

Competitive Analysis Template 6 Scatter Chart Ppt PowerPoint Presentation Slides
This is a competitive analysis template 6 scatter chart ppt powerpoint presentation slides. This is a eight stage process. The stages in this process are users interface, data import, example, pricing, support, update, tutorials, easy to use, table.

Competitive Analysis Template 7 Bubble Chart Ppt PowerPoint Presentation Deck
This is a competitive analysis template 7 bubble chart ppt powerpoint presentation deck. This is a six stage process. The stages in this process are users interface, data import, example, pricing, support, update, tutorials, easy to use, table.

Competitive Analysis Scatter Chart Radar Chart Ppt PowerPoint Presentation Model
This is a competitive analysis scatter chart radar chart ppt powerpoint presentation model. This is a eight stage process. The stages in this process are users interface, data import, example, pricing, support, update, tutorials, easy to use.
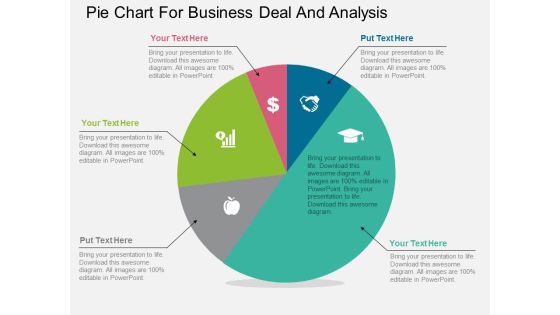
Pie Chart For Business Deal And Analysis Powerpoint Template
Our above PPT slide contains diagram of pentagon infographic. It helps to display steps of corporate marketing. Use this diagram to impart more clarity to data and to create more sound impact on viewers.

BI Implementation To Enhance Hiring Process Business Intelligence Hybrid Architecture Framework Structure PDF
This slide represents the hybrid architecture including both technologies of data mart and OLAP cubes. It includes key recommendations such as implementation of data marts as part of data security for data aggregation etc.Slidegeeks is here to make your presentations a breeze with BI Implementation To Enhance Hiring Process Business Intelligence Hybrid Architecture Framework Structure PDF With our easy-to-use and customizable templates, you can focus on delivering your ideas rather than worrying about formatting. With a variety of designs to choose from, you are sure to find one that suits your needs. And with animations and unique photos, illustrations, and fonts, you can make your presentation pop. So whether you are giving a sales pitch or presenting to the board, make sure to check out Slidegeeks first.
Illustration For Business Steps With Icons Powerpoint Template
Our above PowerPoint slide contains graphics of four text boxes with icons. Download this business slide to illustrate four business steps. Use this diagram to impart more clarity to data and to create more sound impact on viewers.
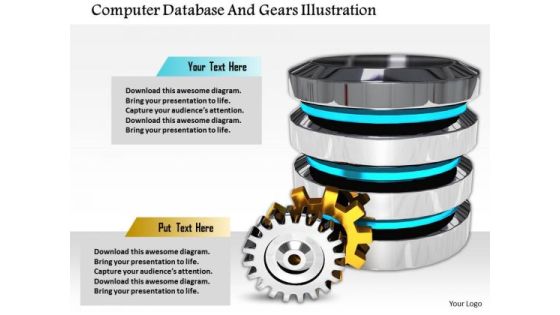
Stock Photo Computer Database And Gears Illustration PowerPoint Slide
This image slide has graphics of database icon with gears. This image contains data base icon to present topics like communication, strategy, technology etc. You can use this layout to display your content in an interesting, eye-catching manner.

Stock Photo Golden Dollar Symbol With Pie Graph PowerPoint Slide
This Power Point template has been crafted with graphic of golden dollar symbol and pie chart on a tablet. Display the concept of financial data analysis with this image. Use this image to present financial reports in business presentations.

Battery Icons For Business Growth Levels Powerpoint Template
Levels of business growth can be displayed with this diagram. This PowerPoint template contains graphics of seven battery icons. You can use this design for data analysis in business presentations

Business Diagram Four Design For Concept Coding Presentation Template
Four colorful text boxes has been used to craft this power point template. This PPT diagram contains the concept of coding and data representation. Use this PPT for business and technology related presentations.
Business Diagram Iphone With Wi Fi Signal Infographic Presentation Template
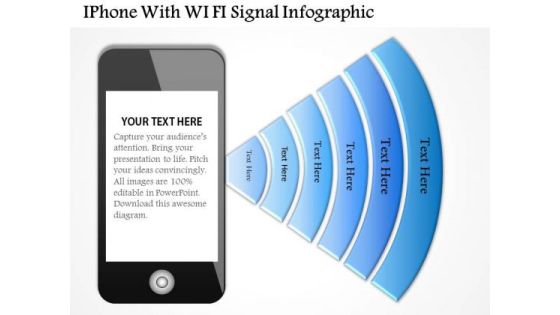
This business diagram has been designed with graphic of iphone and wi-fi symbol. This diagram template contains the concept of data communication and technology. Use this diagram template for your business and technology related presentations.

Stock Photo Blue Cloud With Code Lock PowerPoint Slide
Graphic of blue cloud and code lock has been used to design this PPT. This PPT contains the concept data safety on cloud technology. Use this image template for your cloud technology related presentation.

1G To 5G Wireless Communication System IT Overview Of 2 5 Generation And 2 75 Generation Systems Clipart PDF
This slide represents the overview of 2.5G and 2.75G communication systems, including the technologies deployed in these systems, such as GPRS, enhanced data GSM evolution, EDGE, and CDMA2000 for faster data rates and can deliver a data rate up to 384 kbps. Presenting 1G To 5G Wireless Communication System IT Overview Of 2 5 Generation And 2 75 Generation Systems Clipart PDF to provide visual cues and insights. Share and navigate important information on one stages that need your due attention. This template can be used to pitch topics like Data Rate, Popular Technology, Evolution. In addtion, this PPT design contains high resolution images, graphics, etc, that are easily editable and available for immediate download.

Cloud Computing Scalability Multi Platform Cloud Backup Solution Mockup PDF
This slide covers the data backup solution process where data is accessible and has database storage with several data centers. it also work at the highest level for efficiency and performance at the data center. Explore a selection of the finest Cloud Computing Scalability Multi Platform Cloud Backup Solution Mockup PDF here. With a plethora of professionally designed and pre-made slide templates, you can quickly and easily find the right one for your upcoming presentation. You can use our Cloud Computing Scalability Multi Platform Cloud Backup Solution Mockup PDF to effectively convey your message to a wider audience. Slidegeeks has done a lot of research before preparing these presentation templates. The content can be personalized and the slides are highly editable. Grab templates today from Slidegeeks.

Business Diagram Human Hand Indicating On Multiple Apps PowerPoint Template
Graphic of human hand with multiple apps has been used to craft this PPT. This PPT diagram contains the concept of app usage. Use this PPT for your technology and data related topics in any presentation.

Cloud Computing Wifi Safety Upload Social Network Ppt Slides Graphics
This power point icon template has been designed with graphic of cloud computing, wifi and social network. These icons can be used for data upload safety features and social networking. Use these icons for social network and technology related presentations.

Business Diagram Three Different Pie Charts For Result Analysis Presentation Template
Three different pie charts are used to designed this power point template slide. This PPT slide contains the concept of result analysis. Use this PPT slide for your data and process related presentations.

Competitive Analysis Scatter Chart Radar Chart Ppt PowerPoint Presentation Portfolio Templates
This is a competitive analysis scatter chart radar chart ppt powerpoint presentation portfolio templates. This is a eight stage process. The stages in this process are users interface, data import, example, pricing, support.

Competitive Analysis Template 6 Scatter Chart Ppt PowerPoint Presentation Icon Example Topics
This is a competitive analysis template 6 scatter chart ppt powerpoint presentation icon example topics. This is a eight stage process. The stages in this process are users interface, data import, example, pricing, support, update, tutorials, easy to use.
Histogram Financial Analysis Vector Icon Ppt PowerPoint Presentation Layouts File Formats Cpb
This is a histogram financial analysis vector icon ppt powerpoint presentation layouts file formats cpb. This is a three stage process. The stages in this process are bar chart icon, bar graph icon, data chart icon.
Three Bars For Financial Analysis Vector Icon Ppt PowerPoint Presentation Pictures Background Cpb
This is a three bars for financial analysis vector icon ppt powerpoint presentation pictures background cpb. This is a three stage process. The stages in this process are bar chart icon, bar graph icon, data chart icon.

Cloud Based Computing Analysis Multi Platform Cloud Backup Solution Rules PDF
This slide covers the data backup solution process where data is accessible and has database storage with several data centers. it also work at the highest level for efficiency and performance at the data center. This Cloud Based Computing Analysis Multi Platform Cloud Backup Solution Rules PDF is perfect for any presentation, be it in front of clients or colleagues. It is a versatile and stylish solution for organizing your meetings. The Cloud Based Computing Analysis Multi Platform Cloud Backup Solution Rules PDF features a modern design for your presentation meetings. The adjustable and customizable slides provide unlimited possibilities for acing up your presentation. Slidegeeks has done all the homework before launching the product for you. So, dont wait, grab the presentation templates today
Business Diagram Loudspeaker With Icons Dialogue Box Presentation Template
Graphic of loudspeaker and icons of dialogue box has been used to design this business diagram. This diagram contains the concept of business information communication. Use this diagram for data communication related presentation.
Business Diagram Loudspeaker With Web Icons Dialogue Box Presentation Template
Graphics of loudspeaker and icons of web with dialogue box have been used to design this business diagram. This diagram contains the concept of business information communication. Use this diagram for data communication related presentation.
Business Diagram Five Staged Gear Diagram For Process Control Presentation Template
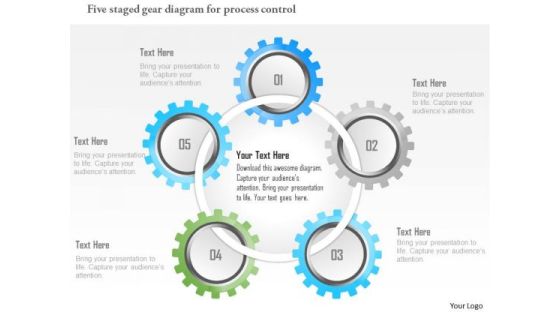
Our above slide displays five staged gear diagram for process control. Download our above diagram to express information in a visual way. Use this diagram and get good comments for data related presentations.
Point To Point Communication In Internet Web Ppt PowerPoint Presentation Icon Styles
This is a point to point communication in internet web ppt powerpoint presentation icon styles. This is a five stage process. The stages in this process are data feed, web feed, information feed.

Product Feeds In Internet Marketing Ppt PowerPoint Presentation File Slide
This is a product feeds in internet marketing ppt powerpoint presentation file slide. This is a six stage process. The stages in this process are data feed, web feed, information feed.

Stock Photo 3d Laptops Graphic Connected With Server PowerPoint Slide
Graphic of 3d laptop and servers has been used to design this power point template. This image template contains the concept of data transfer with networking. This image template can be used to show the networking related presentations.
Presentation Outline Ppt PowerPoint Presentation Gallery Templates
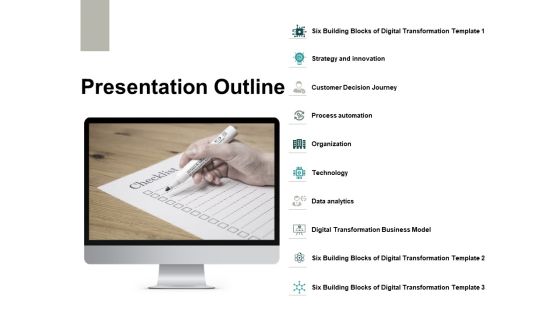
This is a presentation outline ppt powerpoint presentation gallery templates. This is a ten stage process. The stages in this process are technology, organization, data analytics, process automation, strategy.
Business Diagram Five Linear Pie Charts For Result Analysis Presentation Template
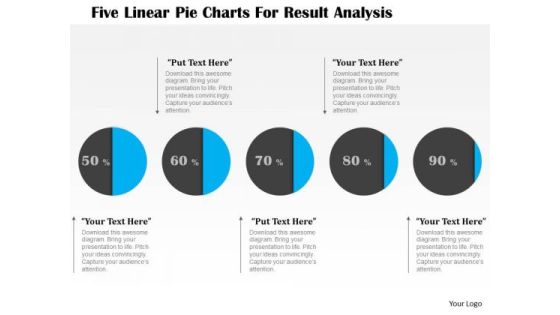
This business diagram displays graphic of five staged process flow diagram. This PPT slide contains the concept of business data representation. Use this diagram to build professional presentation for your viewers.

Business Layer Presentation Background Images
This is a business layer presentation background images. This is a four stage process. The stages in this process are information technology infrastructure layer, data and information layer, software application layer, business layer.

BI Implementation To Enhance Hiring Process Key Business Intelligence Trends For 2022 Elements PDF
This slide represents the current trends of the process through which enterprises uses technologies to analyze current and historical data for improving decision making and having competitive advantage. It includes BI trends for 2022 such as AI, data security, data visualization, data quality management etc.The best PPT templates are a great way to save time, energy, and resources. Slidegeeks have 100 precent editable powerpoint slides making them incredibly versatile. With these quality presentation templates, you can create a captivating and memorable presentation by combining visually appealing slides and effectively communicating your message. Download BI Implementation To Enhance Hiring Process Key Business Intelligence Trends For 2022 Elements PDF from Slidegeeks and deliver a wonderful presentation.
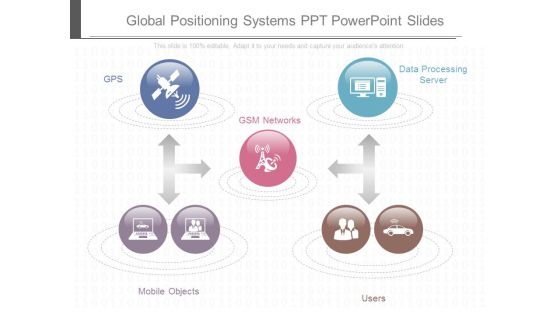
Global Positioning Systems Ppt Powerpoint Slides
This is a global positioning systems ppt powerpoint slides. This is a five stage process. The stages in this process are gps, data processing server, gsm networks, mobile objects, users.
 Home
Home