Data Report

Crm Sales Rep Dashboard Ppt PowerPoint Presentation Influencers
This is a crm sales rep dashboard ppt powerpoint presentation influencers. This is a three stage process. The stages in this process are opp duration by pipeline, actual vs goal, opportunities est close next 25 days.
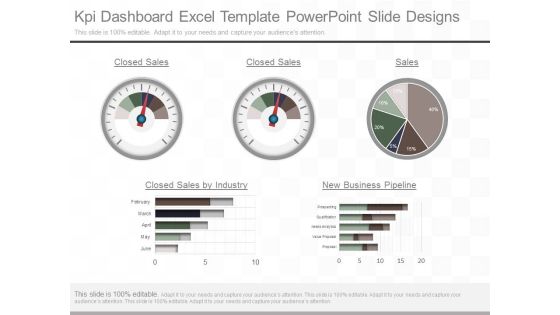
Kpi Dashboard Excel Template Powerpoint Slide Designs
This is a kpi dashboard excel template powerpoint slide designs. This is a five stage process. The stages in this process are closed sales, closed sales, sales, closed sales by industry, new business pipeline, february, march april, may, june, prospecting, qualification, needs analytics, value proposal, proposal.

Dashboard To Track Customers Account Statements Ppt Layouts Styles PDF
This slide covers overview of customers account based on different bank products used by customers. It includes elements such as statements for cash and loan accounts, credit cards, expense and budget analysis, bill payments, etc. If you are looking for a format to display your unique thoughts, then the professionally designed Dashboard To Track Customers Account Statements Ppt Layouts Styles PDF is the one for you. You can use it as a Google Slides template or a PowerPoint template. Incorporate impressive visuals, symbols, images, and other charts. Modify or reorganize the text boxes as you desire. Experiment with shade schemes and font pairings. Alter, share or cooperate with other people on your work. Download Dashboard To Track Customers Account Statements Ppt Layouts Styles PDF and find out how to give a successful presentation. Present a perfect display to your team and make your presentation unforgettable.

Agile QA Procedure Quality Control Kpi Dashboard Topics PDF
This slide shows the quality control dashboard to monitor the effectiveness of agile quality assurance model. It includes KPIs namely test execution summary, defect severity distribution, module wise text execution and defect severity index. Deliver an awe inspiring pitch with this creative agile qa procedure quality control kpi dashboard topics pdf bundle. Topics like quality control kpi dashboard can be discussed with this completely editable template. It is available for immediate download depending on the needs and requirements of the user.

Steps To Conduct Competitor Analysis Organic Keywords Analysis Seo Dashboard Designs PDF
This slide showcases a SEO dashboard for analyzing competitors top ranking organic keywords. It highlights elements such as organic search, organic traffic, organic keywords, top keywords, top 10 competitors, country and traffic. Whether you have daily or monthly meetings, a brilliant presentation is necessary. Steps To Conduct Competitor Analysis Organic Keywords Analysis Seo Dashboard Designs PDF can be your best option for delivering a presentation. Represent everything in detail using Steps To Conduct Competitor Analysis Organic Keywords Analysis Seo Dashboard Designs PDF and make yourself stand out in meetings. The template is versatile and follows a structure that will cater to your requirements. All the templates prepared by Slidegeeks are easy to download and edit. Our research experts have taken care of the corporate themes as well. So, give it a try and see the results.

Clear Point Strategy Dashboard Ppt Presentation
This is a clear point strategy dashboard ppt presentation. This is a four stage process. The stages in this process are financial perspective, internal processes perspective, learning and growth perspective, customer perspective.
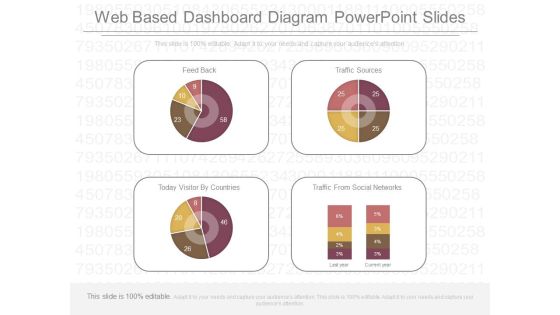
Web Based Dashboard Diagram Powerpoint Slides
This is a web based dashboard diagram powerpoint slides. This is a four stage process. The stages in this process are feed back, traffic sources, today visitor by countries, traffic from social networks.
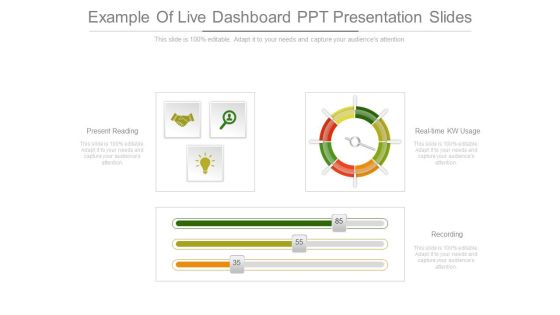
Example Of Live Dashboard Ppt Presentation Slides
This is a example of live dashboard ppt presentation slides. This is a three stage process. The stages in this process are present reading, real time kw usage, recording.
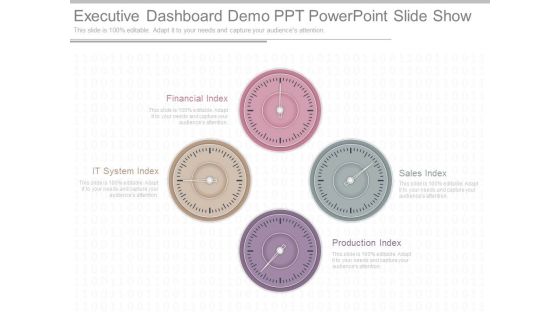
Executive Dashboard Demo Ppt Powerpoint Slide Show
This is a executive dashboard demo ppt powerpoint slide show. This is a four stage process. The stages in this process are financial index, it system index, production index, sales index.
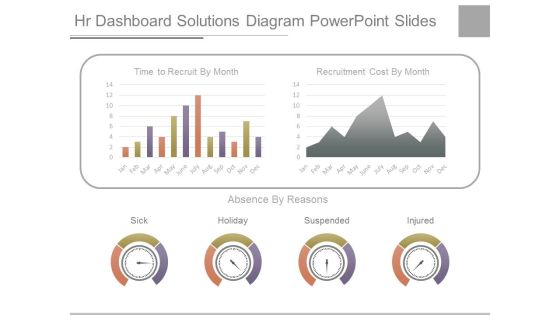
Hr Dashboard Solutions Diagram Powerpoint Slides
This is a hr dashboard solutions diagram powerpoint slides. This is a two stage process. The stages in this process are time to recruit by month, recruitment cost by month, sick, holiday, suspended, injured.

Project Management Kpi Dashboard Diagram Powerpoint Images
This is a project management kpi dashboard diagram powerpoint images. This is a four stage process. The stages in this process are project budget, project goals, project task management, project schedule.

Competitive Intelligence Dashboard Diagram Ppt Slides
This is a competitive intelligence dashboard diagram ppt slides. This is a four stage process. The stages in this process are monthly sales, inventory turns, customer complaints, company, subject area.
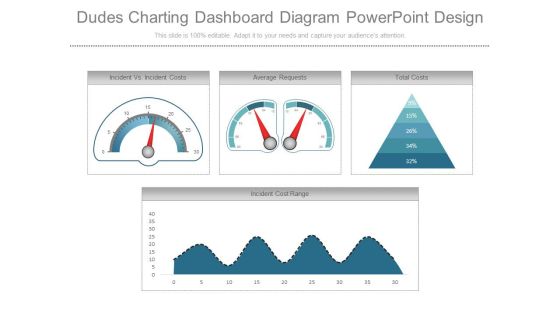
Dudes Charting Dashboard Diagram Powerpoint Design
This is a dudes charting dashboard diagram powerpoint design. This is a four stage process. The stages in this process are incident vs incident costs, average requests, total costs, incident cost range.
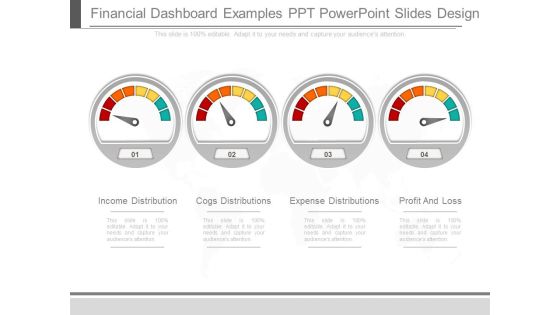
Financial Dashboard Examples Ppt Powerpoint Slides Design
This is a financial dashboard examples ppt powerpoint slides design. This is a four stage process. The stages in this process are income distribution, cogs distributions, expense distributions, profit and loss.
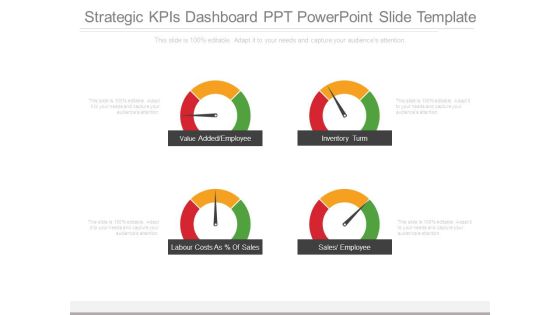
Strategic Kpis Dashboard Ppt Powerpoint Slide Template
This is a strategic kpis dashboard ppt powerpoint slide template. This is a four stage process. The stages in this process are value added employee, inventory turn, labour costs as of sales, sales employee.
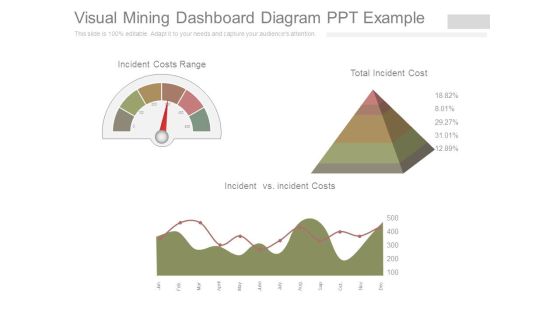
Visual Mining Dashboard Diagram Ppt Example
This is a visual mining dashboard diagram ppt example. This is a three stage process. The stages in this process are incident costs range, incident vs incident costs, total incident cost.

Executive Dashboards Systems Example Of Ppt Presentation
This is a executive dashboards systems example of ppt presentation. This is a five stage process. The stages in this process are schedule management, resource management, document management, inventory management, meeting management.
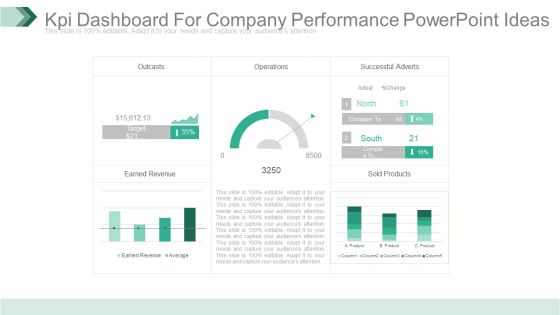
Kpi Dashboard For Company Performance Powerpoint Ideas
This is a kpi dashboard for company performance powerpoint ideas. This is a five stage process. The stages in this process are outcasts, operations, successful adverts, earned revenue, sold products.

Dashboards For Lead Scoring Powerpoint Topics
This is a dashboards for lead scoring powerpoint topics. This is a four stage process. The stages in this process are number of scoring rules, projects completed, adoption of lead scoring solutions chosen, number of dimensions.

Kpi Dashboard For Operations Powerpoint Slide Images
This is a kpi dashboard for operations powerpoint slide images. This is a four stage process. The stages in this process are outcasts, earned revenue, operations, successful adverts, sold products.

Project Dashboard Ppt PowerPoint Presentation Professional Show
This is a project dashboard ppt powerpoint presentation professional show. This is a six stage process. The stages in this process are primary resources, timeline, objective, main focus, key discussion items.
Improving Brand Awareness Through WOM Marketing Dashboard For Tracking Marketing Activities At Social Media Platform Diagrams PDF
This slide covers information regarding the dashboard for tracking essential marketing activities at social media platform in terms of social traffic and conversion, referral traffic by site, key social media metrics. Deliver an awe inspiring pitch with this creative improving brand awareness through wom marketing dashboard for tracking marketing activities at social media platform diagrams pdf bundle. Topics like dashboard for tracking marketing activities at social media platform can be discussed with this completely editable template. It is available for immediate download depending on the needs and requirements of the user.
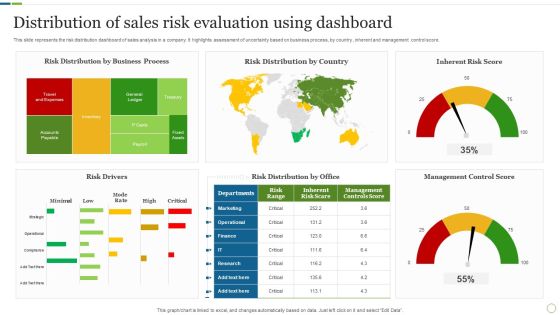
Distribution Of Sales Risk Evaluation Using Dashboard Brochure PDF
This slide represents the risk distribution dashboard of sales analysis in a company. It highlights assessment of uncertainty based on business process, by country , inherent and management control score. Showcasing this set of slides titled Distribution Of Sales Risk Evaluation Using Dashboard Brochure PDF. The topics addressed in these templates are Risk Drivers, Management Control Score, Inherent Risk Score. All the content presented in this PPT design is completely editable. Download it and make adjustments in color, background, font etc. as per your unique business setting.
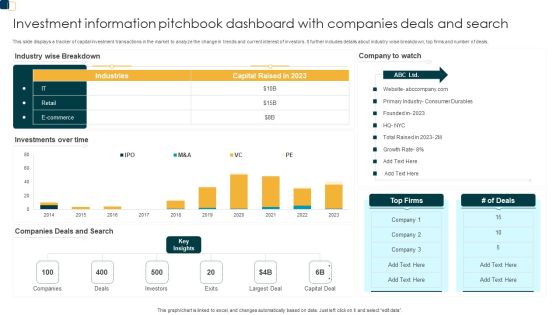
Investment Information Pitchbook Dashboard With Companies Deals And Search Introduction PDF
Showcasing this set of slides titled Investment Information Pitchbook Dashboard With Companies Deals And Search Introduction PDF. The topics addressed in these templates are Dashboard With Companies, Deals And Search. All the content presented in this PPT design is completely editable. Download it and make adjustments in color, background, font etc. as per your unique business setting.

Sales Quarterly Performance Review System With Future Agenda Slides PDF
This slide shows sales department quarterly business review QBR with agenda. It provides information about units sold, opportunity to win, market coverage, product focus, market readiness, etc. Showcasing this set of slides titled Sales Quarterly Performance Review System With Future Agenda Slides PDF. The topics addressed in these templates are Sales, Scorecard Metrics, Overall QBR Observations. All the content presented in this PPT design is completely editable. Download it and make adjustments in color, background, font etc. as per your unique business setting.

Kpi Metrics Dashboard To Analyze The Effectiveness Of New Product Launch Launching New Beverage Product Diagrams PDF
The following slide outlines key performance indicator KPI dashboard which can be used to measure the success of product launch. The kpis are total units, revenue, average selling price ASP, number of penetrated planned customers etc. Create an editable Kpi Metrics Dashboard To Analyze The Effectiveness Of New Product Launch Launching New Beverage Product Diagrams PDF that communicates your idea and engages your audience. Whether you are presenting a business or an educational presentation, pre-designed presentation templates help save time. Kpi Metrics Dashboard To Analyze The Effectiveness Of New Product Launch Launching New Beverage Product Diagrams PDF is highly customizable and very easy to edit, covering many different styles from creative to business presentations. Slidegeeks has creative team members who have crafted amazing templates. So, go and get them without any delay.
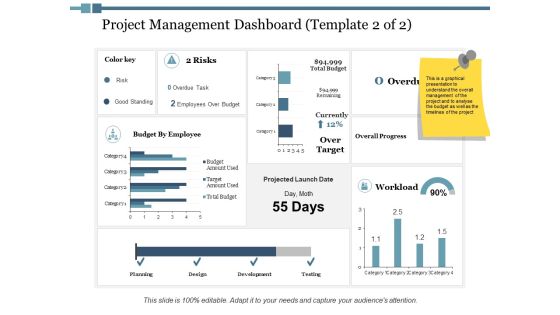
Project Management Dashboard Workload Ppt PowerPoint Presentation Inspiration Show
This is a project management dashboard workload ppt powerpoint presentation inspiration show. This is a four stage process. The stages in this process are finance, marketing, management, investment, analysis.

Change Management Performance Dashboard Ppt PowerPoint Presentation Professional Slides
This is a change management performance dashboard ppt powerpoint presentation professional slides. This is a three stage process. The stages in this process are finance, marketing, management, investment, analysis.
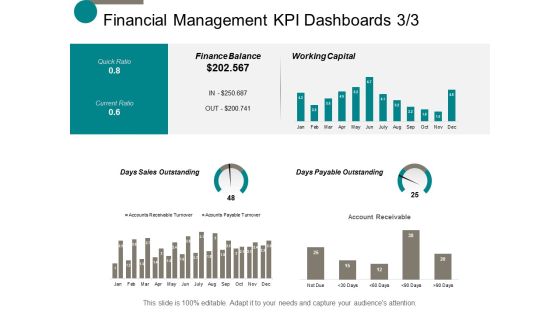
Financial Management Kpi Dashboards Finance Ppt Powerpoint Presentation Ideas Brochure
This is a financial management kpi dashboards finance ppt powerpoint presentation ideas brochure. This is a six stage process. The stages in this process are finance, marketing, management, investment, analysis.
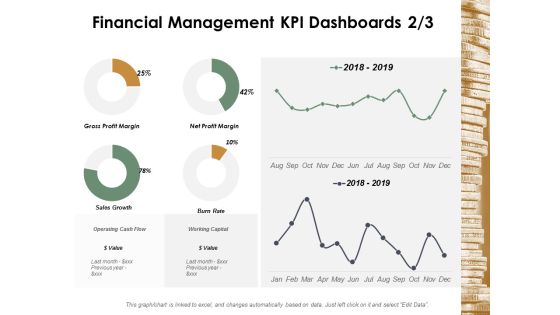
Financial Management Kpi Dashboards Management Ppt Powerpoint Presentation Slides Tips
This is a financial management kpi dashboards management ppt powerpoint presentation slides tips. This is a six stage process. The stages in this process are finance, marketing, management, investment, analysis.
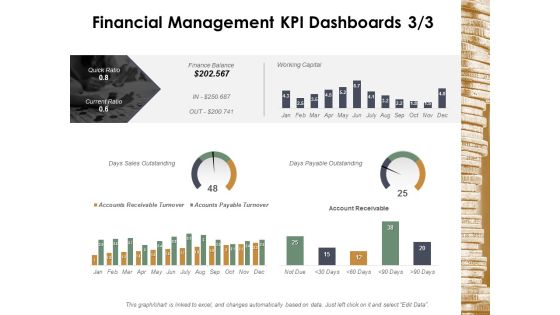
Financial Management Kpi Dashboards Marketing Ppt Powerpoint Presentation Professional Portrait
This is a financial management kpi dashboards marketing ppt powerpoint presentation professional portrait. This is a six stage process. The stages in this process are finance, marketing, management, investment, analysis.
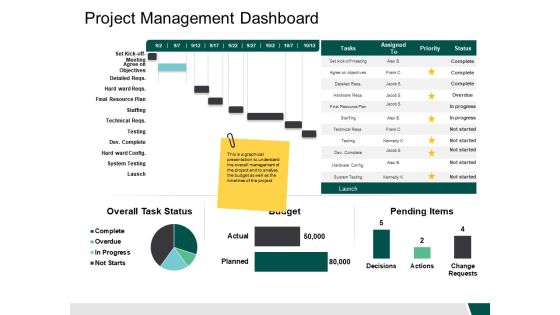
Project Management Dashboard Budget Ppt PowerPoint Presentation Slides Templates
This is a project management dashboard budget ppt powerpoint presentation slides templates. This is a two stage process. The stages in this process are finanace, management, strategy, analysis, marketing.
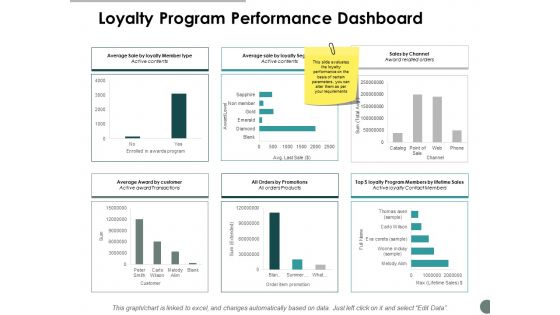
Loyalty Program Performance Dashboard Ppt Powerpoint Presentation Professional Templates
This is a loyalty program performance dashboard ppt powerpoint presentation professional templates. This is a six stage process. The stages in this process are finance, marketing, management, investment, analysis.

Employee Engagement Dashboard Ppt PowerPoint Presentation Professional File Formats
This is a employee engagement dashboard ppt powerpoint presentation professional file formats. This is a four stage process. The stages in this process are finance, marketing, management, investment, analysis.

Marketing Management Dashboard Marketing Ppt PowerPoint Presentation Slides Graphics
This is a marketing management dashboard marketing ppt powerpoint presentation slides graphics. This is a three stage process. The stages in this process are finance, marketing, management, investment, analysis.
Marketing Management Dashboard Planning Ppt PowerPoint Presentation Layouts Icons
This is a marketing management dashboard planning ppt powerpoint presentation layouts icons. This is a four stage process. The stages in this process are finance, marketing, management, investment, analysis.

Marketing Management Dashboard Stratgegy Ppt PowerPoint Presentation Summary Samples
This is a marketing management dashboard stratgegy ppt powerpoint presentation summary samples. This is a four stage process. The stages in this process are finance, marketing, management, investment, analysis.

Marketing Management Dashboard Ppt PowerPoint Presentation Portfolio Layout Ideas
This is a marketing management dashboard ppt powerpoint presentation portfolio layout ideas. This is a four stage process. The stages in this process are finance, marketing, management, investment, analysis.

Inventory And Logistics Dashboard Ppt PowerPoint Presentation Gallery Clipart
This is a inventory and logistics dashboard ppt powerpoint presentation gallery clipart. This is a four stage process. The stages in this process are finance, marketing, management, investment, analysis.
Inventory Delivery On Time Dashboards Ppt PowerPoint Presentation Icon Template
This is a inventory delivery on time dashboards ppt powerpoint presentation icon template. This is a three stage process. The stages in this process are finance, marketing, management, investment, analysis.

Inventory Planning Kpi Dashboard Ppt PowerPoint Presentation Model Show
This is a inventory planning kpi dashboard ppt powerpoint presentation model show. This is a four stage process. The stages in this process are finance, marketing, management, investment, analysis.
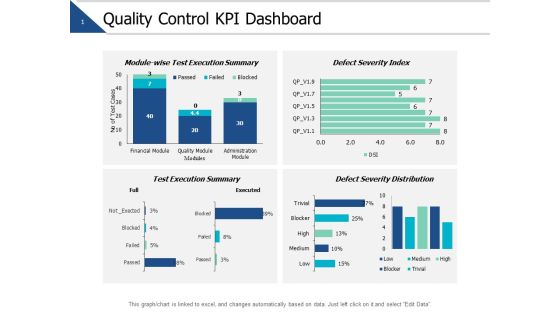
Quality Control Kpi Dashboard Ppt PowerPoint Presentation Show Portrait
This is a quality control kpi dashboard ppt powerpoint presentation show portrait. This is a four stage process. The stages in this process are finance, marketing, management, investment, analysis.
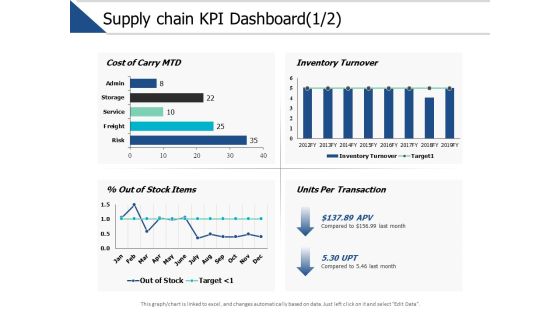
Supply Chain Kpi Dashboard Management Ppt PowerPoint Presentation Model Picture
This is a supply chain kpi dashboard management ppt powerpoint presentation model picture. This is a three stage process. The stages in this process are finance, marketing, management, investment, analysis.

Inventory And Logistics Dashboard Ppt PowerPoint Presentation Professional Styles
This is a inventory and logistics dashboard ppt powerpoint presentation professional styles. This is a four stage process. The stages in this process are finance, marketing, management, investment, analysis.
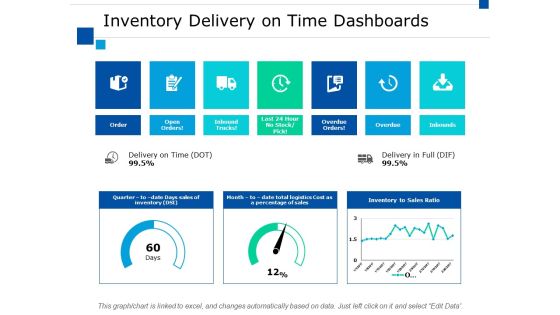
Inventory Delivery On Time Dashboards Ppt PowerPoint Presentation Slides Download
This is a inventory delivery on time dashboards ppt powerpoint presentation slides download. This is a seven stage process. The stages in this process are finance, marketing, management, investment, analysis.

Inventory Planning Kpi Dashboard Ppt PowerPoint Presentation Summary Layout Ideas
This is a inventory planning kpi dashboard ppt powerpoint presentation summary layout ideas. This is a two stage process. The stages in this process are finance, marketing, management, investment, analysis.

Project Management Monthly Growth Dashboard Ppt PowerPoint Presentation Pictures Guide
This is a project management monthly growth dashboard ppt powerpoint presentation pictures guide. This is a four stage process. The stages in this process are finance, marketing, management, investment, analysis.
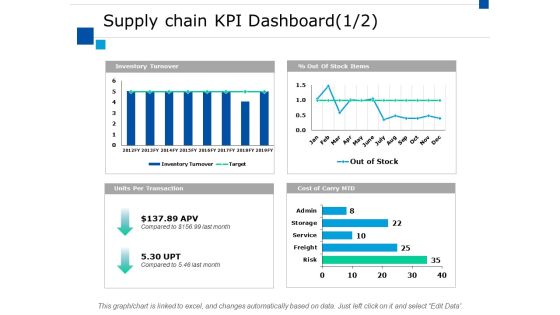
Supply Chain Kpi Dashboard Ppt PowerPoint Presentation Styles Clipart
This is a supply chain kpi dashboard ppt powerpoint presentation styles clipart. This is a four stage process. The stages in this process are finance, marketing, analysis, investment, million.
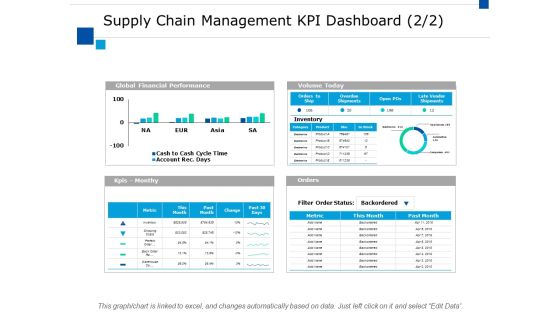
Supply Chain Management Kpi Dashboard Ppt PowerPoint Presentation File Slides
This is a supply chain management kpi dashboard ppt powerpoint presentation file slides. This is a four stage process. The stages in this process are finance, marketing, analysis, investment, million.

Loyalty Program Performance Dashboard Ppt Powerpoint Presentation Gallery Inspiration
This is a loyalty program performance dashboard ppt powerpoint presentation gallery inspiration. This is a six stage process. The stages in this process are finance, marketing, analysis, investment, strategy.

Deployment Of Automated Production Technology Smart Manufacturing Dashboard To Track Production Quality Template PDF
This slide represents smart manufacturing dashboard. It covers production volume, downtime causes, top product sold item, sales revenue, active machinery etc.Explore a selection of the finest Deployment Of Automated Production Technology Smart Manufacturing Dashboard To Track Production Quality Template PDF here. With a plethora of professionally designed and pre-made slide templates, you can quickly and easily find the right one for your upcoming presentation. You can use our Deployment Of Automated Production Technology Smart Manufacturing Dashboard To Track Production Quality Template PDF to effectively convey your message to a wider audience. Slidegeeks has done a lot of research before preparing these presentation templates. The content can be personalized and the slides are highly editable. Grab templates today from Slidegeeks.

Implementing Smart Manufacturing Technology To Increase Productivity Smart Manufacturing Dashboard For Inventory Management Introduction PDF
This slide represents smart manufacturing dashboard for inventory management. It includes inventory carrying cost, inventory turnover, inventory to sales ratio etc. Explore a selection of the finest Implementing Smart Manufacturing Technology To Increase Productivity Smart Manufacturing Dashboard For Inventory Management Introduction PDF here. With a plethora of professionally designed and pre-made slide templates, you can quickly and easily find the right one for your upcoming presentation. You can use our Implementing Smart Manufacturing Technology To Increase Productivity Smart Manufacturing Dashboard For Inventory Management Introduction PDF to effectively convey your message to a wider audience. Slidegeeks has done a lot of research before preparing these presentation templates. The content can be personalized and the slides are highly editable. Grab templates today from Slidegeeks.
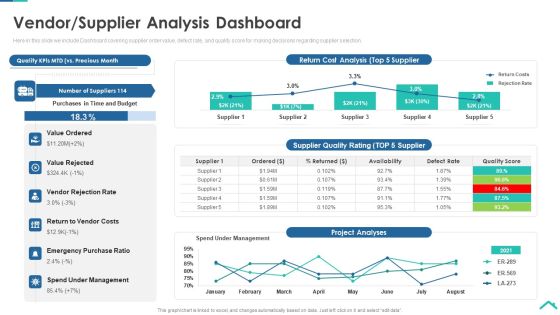
Risk Analysis Strategies For Real Estate Construction Project Vendor Supplier Analysis Dashboard Sample PDF
Here in this slide we include Dashboard covering supplier order value, defect rate, and quality score for making decisions regarding supplier selection. Deliver an awe inspiring pitch with this creative risk analysis strategies for real estate construction project vendor supplier analysis dashboard sample pdf bundle. Topics like value ordered, value rejected, vendor rejection rate, return to vendor costs, emergency purchase ratio, spend under management can be discussed with this completely editable template. It is available for immediate download depending on the needs and requirements of the user.
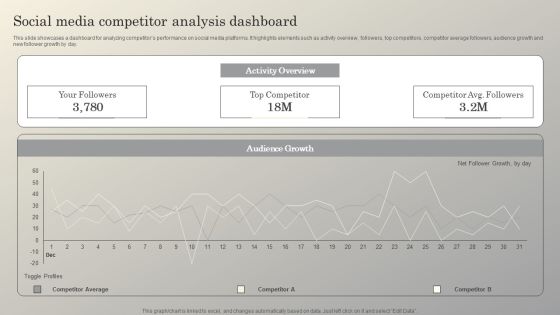
Steps To Conduct Competitor Analysis Social Media Competitor Analysis Dashboard Brochure PDF
This slide showcases a dashboard for analyzing competitors performance on social media platforms. It highlights elements such as activity overview, followers, top competitors, competitor average followers, audience growth and new follower growth by day. Find a pre-designed and impeccable Steps To Conduct Competitor Analysis Social Media Competitor Analysis Dashboard Brochure PDF. The templates can ace your presentation without additional effort. You can download these easy-to-edit presentation templates to make your presentation stand out from others. So, what are you waiting for Download the template from Slidegeeks today and give a unique touch to your presentation.

Men At Work Business As Usual Graph Discussion PowerPoint Templates Ppt Backgrounds For Slides
We present our men at work business as usual graph discussion PowerPoint templates PPT backgrounds for slides.Use our Business PowerPoint Templates because Watching this your Audience will Grab their eyeballs, they wont even blink. Download and present our People PowerPoint Templates because Our PowerPoint Templates and Slides are effectively colour coded to prioritise your plans They automatically highlight the sequence of events you desire. Present our Success PowerPoint Templates because You can Stir your ideas in the cauldron of our PowerPoint Templates and Slides. Cast a magic spell on your audience. Present our Finance PowerPoint Templates because Our PowerPoint Templates and Slides help you meet the demand of the Market. Just browse and pick the slides that appeal to your intuitive senses. Download and present our Success PowerPoint Templates because You canTake a leap off the starting blocks with our PowerPoint Templates and Slides. They will put you ahead of the competition in quick time.Use these PowerPoint slides for presentations relating to 3d, accounting, achievement, ascending, bar, briefcase, businessman,businessmen, clipboard, colleagues, colourful, corporate, data, decisions,diagram, discuss, figure, finance, financial, forecast, gains, graph, green, group,growth, illustration, improvement, increasing, information, leader, leadership, men,performance, planning, presentation, profit, progress, projection, red, rising,series, show, statistics, strategy, success, team, teamwork, tie, yellow. The prominent colors used in the PowerPoint template are Blue , White, Green. We assure you our men at work business as usual graph discussion PowerPoint templates PPT backgrounds for slides help you meet deadlines which are an element of today's workplace. Just browse and pick the slides that appeal to your intuitive senses. You can be sure our bar PowerPoint templates and PPT Slides are topically designed to provide an attractive backdrop to any subject. Use our men at work business as usual graph discussion PowerPoint templates PPT backgrounds for slides effectively help you save your valuable time. We assure you our bar PowerPoint templates and PPT Slides will help them to explain complicated concepts. Use our men at work business as usual graph discussion PowerPoint templates PPT backgrounds for slides provide great value for your money. Be assured of finding the best projection to highlight your words. Professionals tell us our clipboard PowerPoint templates and PPT Slides will generate and maintain the level of interest you desire. They will create the impression you want to imprint on your audience.
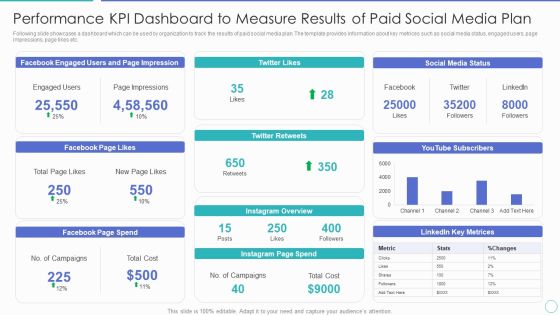
Performance KPI Dashboard To Measure Results Of Paid Social Media Plan Ppt PowerPoint Presentation Gallery Format Ideas PDF
Following slide showcases a dashboard which can be used by organization to track the results of paid social media plan. The template provides information about key metrices such as social media status, engaged users, page impressions, page likes etc. Pitch your topic with ease and precision using this performance kpi dashboard to measure results of paid social media plan ppt powerpoint presentation gallery format ideas pdf. This layout presents information on social media status, instagram page spend, facebook page spend, facebook page likes. It is also available for immediate download and adjustment. So, changes can be made in the color, design, graphics or any other component to create a unique layout.
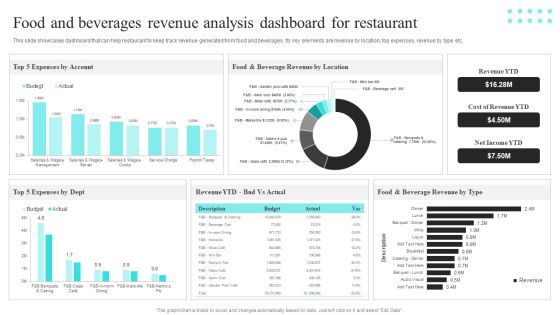
Strategic Promotional Guide For Restaurant Business Advertising Food And Beverages Revenue Analysis Dashboard Template PDF
This slide showcases dashboard that can help restaurant to keep track revenue generated from food and beverages. Its key elements are revenue by location, top expenses, revenue by type etc. This Strategic Promotional Guide For Restaurant Business Advertising Food And Beverages Revenue Analysis Dashboard Template PDF from Slidegeeks makes it easy to present information on your topic with precision. It provides customization options, so you can make changes to the colors, design, graphics, or any other component to create a unique layout. It is also available for immediate download, so you can begin using it right away. Slidegeeks has done good research to ensure that you have everything you need to make your presentation stand out. Make a name out there for a brilliant performance.

Micro Chip Blood Glucose Monitoring Dashboard Pictures PDF
This slide demonstrates the dashboard for monitoring the glucose level in blood-based on insulin onboard, carb intake, physical activity. Deliver an awe inspiring pitch with this creative Micro Chip Blood Glucose Monitoring Dashboard Pictures PDF bundle. Topics like Insulin Onboard, Carb Intake, Current Reading, Carb History can be discussed with this completely editable template. It is available for immediate download depending on the needs and requirements of the user.

ISO 9001 Quality Assurance Software Accreditation Business Quality Management And Audit Schedule Dashboard Infographics PDF
This template covers Quality management system dashboard including KPIs such as outstanding actions, scheduled audits, item to attend to, and immediate actions required. Deliver an awe inspiring pitch with this creative ISO 9001 Quality Assurance Software Accreditation Business Quality Management And Audit Schedule Dashboard Infographics PDF bundle. Topics like Customer Satisfaction, Management Review Meeting, Business Continuity can be discussed with this completely editable template. It is available for immediate download depending on the needs and requirements of the user.
ISO 9001 Standard For Quality Control Business Quality Management And Audit Schedule Dashboard Icons PDF
This template covers quality management system dashboard including kpis such as outstanding actions, scheduled audits, item to attend to, and immediate actions required Deliver an awe inspiring pitch with this creative ISO 9001 Standard For Quality Control Business Quality Management And Audit Schedule Dashboard Icons PDF bundle. Topics like Customer Satisfaction, Management Review Meeting Due, Business Continuity can be discussed with this completely editable template. It is available for immediate download depending on the needs and requirements of the user.
Total Productive Management At Workplace Production Process Analytics Dashboard Icons PDF
This slide covers the dashboard of production process analytics dashboard that focuses on process cycle, defect types, completion count, etc. Deliver an awe inspiring pitch with this creative total productive management at workplace production process analytics dashboard icons pdf bundle. Topics like type of defect, process cycle time by user, process time statistics by user can be discussed with this completely editable template. It is available for immediate download depending on the needs and requirements of the user.

Dashboard For Pharmaceutical Device Sales Performance Graphics PDF
This slide showcases sales performance dashboard od medical instruments. It includes elements such as the shipping information, order information and payment information. Showcasing this set of slides titled Dashboard For Pharmaceutical Device Sales Performance Graphics PDF. The topics addressed in these templates are Pharmaceutical Device, Sales Performance. All the content presented in this PPT design is completely editable. Download it and make adjustments in color, background, font etc. as per your unique business setting.
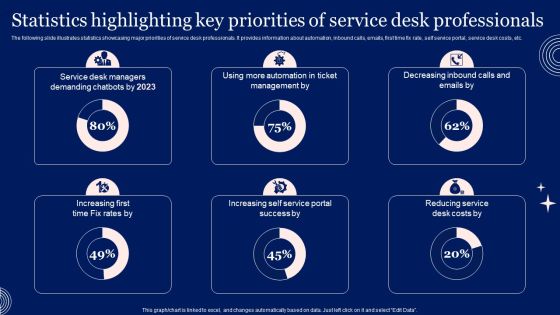
Implementing Advanced Service Help Desk Administration Program Statistics Highlighting Key Priorities Of Service Desk Infographics PDF
The following slide illustrates statistics showcasing major priorities of service desk professionals. It provides information about automation, inbound calls, emails, first time fix rate, self service portal, service desk costs, etc. From laying roadmaps to briefing everything in detail, our templates are perfect for you. You can set the stage with your presentation slides. All you have to do is download these easy-to-edit and customizable templates. Implementing Advanced Service Help Desk Administration Program Statistics Highlighting Key Priorities Of Service Desk Infographics PD will help you deliver an outstanding performance that everyone would remember and praise you for. Do download this presentation today.
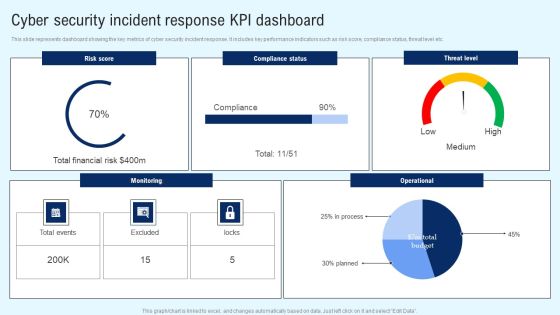
Implementing Cyber Security Incident Cyber Security Incident Response KPI Dashboard Clipart PDF
This slide represents dashboard showing the key metrics of cyber security incident response. It includes key performance indicators such as risk score, compliance status, threat level etc. There are so many reasons you need a Implementing Cyber Security Incident Cyber Security Incident Response KPI Dashboard Clipart PDF. The first reason is you cannot spend time making everything from scratch, Thus, Slidegeeks has made presentation templates for you too. You can easily download these templates from our website easily.

Safety Measurement Dashboard With Key Kpis And Severity Sample PDF
This slide represents the dashboard showing performance measurement analysis of safety team of an organization. It includes details related to incidents, critical incidents and its cost, severity, type of incident and their consequence. Showcasing this set of slides titled Safety Measurement Dashboard With Key Kpis And Severity Sample PDF. The topics addressed in these templates are Incidents, Critical Incidents, Day Since Last Incident. All the content presented in this PPT design is completely editable. Download it and make adjustments in color, background, font etc. as per your unique business setting.
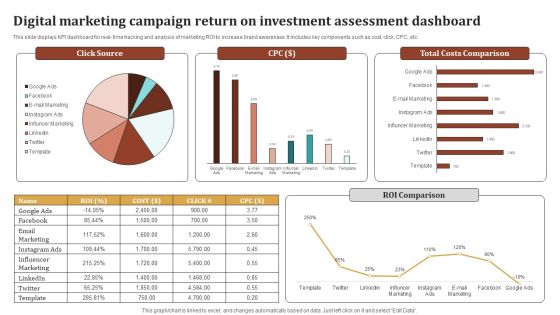
Digital Marketing Campaign Return On Investment Assessment Dashboard Ideas PDF
This slide displays KPI dashboard for real- time tracking and analysis of marketing ROI to increase brand awareness. It includes key components such as cost, click, CPC, etc. Showcasing this set of slides titled Digital Marketing Campaign Return On Investment Assessment Dashboard Ideas PDF. The topics addressed in these templates are Influencer Marketing, Email Marketing, Total Costs Comparison, Roi Comparison. All the content presented in this PPT design is completely editable. Download it and make adjustments in color, background, font etc. as per your unique business setting.
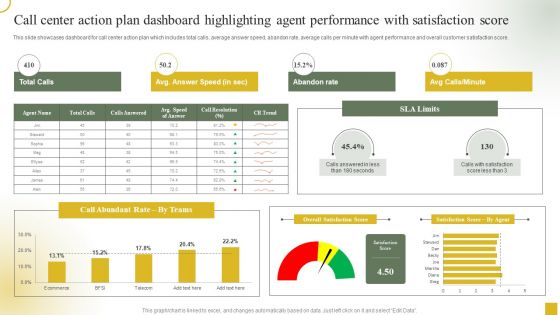
Call Center Action Plan Dashboard Highlighting Agent Performance With Satisfaction Score Information PDF
This slide showcases dashboard for call center action plan which includes total calls, average answer speed, abandon rate, average calls per minute with agent performance and overall customer satisfaction score. If you are looking for a format to display your unique thoughts, then the professionally designed Call Center Action Plan Dashboard Highlighting Agent Performance With Satisfaction Score Information PDF is the one for you. You can use it as a Google Slides template or a PowerPoint template. Incorporate impressive visuals, symbols, images, and other charts. Modify or reorganize the text boxes as you desire. Experiment with shade schemes and font pairings. Alter, share or cooperate with other people on your work. Download Call Center Action Plan Dashboard Highlighting Agent Performance With Satisfaction Score Information PDF and find out how to give a successful presentation. Present a perfect display to your team and make your presentation unforgettable.
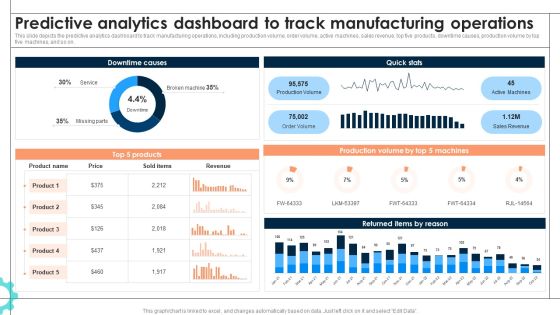
Intelligent Manufacturing Predictive Analytics Dashboard To Track Manufacturing Operations Information PDF
This slide depicts the predictive analytics dashboard to track manufacturing operations, including production volume, order volume, active machines, sales revenue, top five products, downtime causes, production volume by top five machines, and so on. If you are looking for a format to display your unique thoughts, then the professionally designed Intelligent Manufacturing Predictive Analytics Dashboard To Track Manufacturing Operations Information PDF is the one for you. You can use it as a Google Slides template or a PowerPoint template. Incorporate impressive visuals, symbols, images, and other charts. Modify or reorganize the text boxes as you desire. Experiment with shade schemes and font pairings. Alter, share or cooperate with other people on your work. Download Intelligent Manufacturing Predictive Analytics Dashboard To Track Manufacturing Operations Information PDF and find out how to give a successful presentation. Present a perfect display to your team and make your presentation unforgettable.
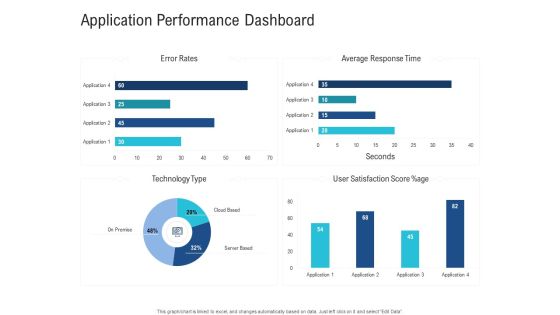
Enhance Enterprise Application Performance Application Performance Dashboard Microsoft PDF
Deliver an awe-inspiring pitch with this creative enhance enterprise application performance application performance dashboard microsoft pdf bundle. Topics like technology, server, satisfaction score, cloud based, average response can be discussed with this completely editable template. It is available for immediate download depending on the needs and requirements of the user.
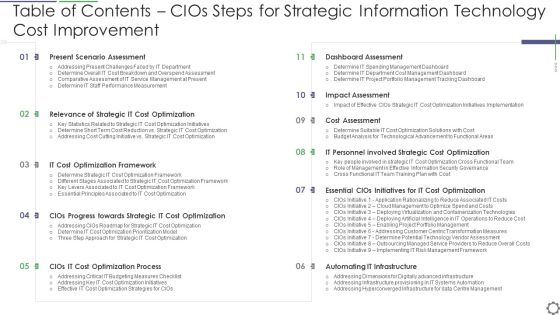
Table Of Contents Cios Steps For Strategic Information Technology Cost Improvement Demonstration PDF
Deliver an awe inspiring pitch with this creative table of contents cios steps for strategic information technology cost improvement demonstration pdf bundle. Topics like dashboard assessment, impact assessment, cost assessment, automating it infrastructure can be discussed with this completely editable template. It is available for immediate download depending on the needs and requirements of the user.

Kpi Service Dashboard Ppt Powerpoint Slide Designs
This is a kpi service dashboard ppt powerpoint slide designs. This is a four stage process. The stages in this process are service requests resolved within target, service requests by priority, service requests by category, calls offered, jan, feb, mar, apr, may, june, july, aug, sep, oct, nov, dec.
Effective Lead Generation For Higher Conversion Rates Dashboard For Tracking Sessions And Leads By Source Introduction PDF
This slide covers the KPI dashboard for analyzing metrics such as offline sources, direct traffic, organic search, email marketing, paid search, referral, social media, email open, etc. Are you in need of a template that can accommodate all of your creative concepts This one is crafted professionally and can be altered to fit any style. Use it with Google Slides or PowerPoint. Include striking photographs, symbols, depictions, and other visuals. Fill, move around, or remove text boxes as desired. Test out color palettes and font mixtures. Edit and save your work, or work with colleagues. Download Effective Lead Generation For Higher Conversion Rates Dashboard For Tracking Sessions And Leads By Source Introduction PDF and observe how to make your presentation outstanding. Give an impeccable presentation to your group and make your presentation unforgettable.

Smartphone Game Development And Advertising Technique Dashboard For Measuring P2E Web 3 Game Website Information PDF
Are you in need of a template that can accommodate all of your creative concepts This one is crafted professionally and can be altered to fit any style. Use it with Google Slides or PowerPoint. Include striking photographs, symbols, depictions, and other visuals. Fill, move around, or remove text boxes as desired. Test out color palettes and font mixtures. Edit and save your work, or work with colleagues. Download Smartphone Game Development And Advertising Technique Dashboard For Measuring P2E Web 3 Game Website Information PDF and observe how to make your presentation outstanding. Give an impeccable presentation to your group and make your presentation unforgettable.

Digital Dashboard Resource Kit Ppt Powerpoint Slides Design
This is a digital dashboard resource kit ppt powerpoint slides design. This is a four stage process. The stages in this process are sales rate, progress, profits, safety.

High Low Risk Level Dashboard Powerpoint Slide Clipart
This is a high low risk level dashboard powerpoint slide clipart. This is a three stage process. The stages in this process are high, medium, low.

Dashboard For Product Quality Ppt PowerPoint Presentation Ideas
This is a dashboard for product quality ppt powerpoint presentation ideas. This is a five stage process. The stages in this process are bad, poor, average, good, excellent.

5 Stages Parallel Dimension Lines Business Plan Format Outline PowerPoint Templates
We present our 5 stages parallel dimension lines business plan format outline PowerPoint templates.Use our Arrows PowerPoint Templates because Our PowerPoint Templates and Slides come in all colours, shades and hues. They help highlight every nuance of your views. Use our Signs PowerPoint Templates because You can Connect the dots. Fan expectations as the whole picture emerges. Download our Shapes PowerPoint Templates because Our PowerPoint Templates and Slides will let you Illuminate the road ahead to Pinpoint the important landmarks along the way. Download our Metaphors-Visual Concepts PowerPoint Templates because It can be used to Set your controls for the heart of the sun. Our PowerPoint Templates and Slides will be the propellant to get you there. Present our Business PowerPoint Templates because Our PowerPoint Templates and Slides offer you the needful to organise your thoughts. Use them to list out your views in a logical sequence.Use these PowerPoint slides for presentations relating to arrow, background, bar, barcode, black, checkout, code, control, data, design, digit, encode, goods, growth, identification, impact, industrial, information, inventory, isolated, item, laser, line, merchandise, number, optical, package, parallel, pattern, price, product, read, register, scan, sell, stripe, structure, supermarket, symbol, technology, texture, universal, vertical, white, width. The prominent colors used in the PowerPoint template are Blue, Green, Yellow. We assure you our 5 stages parallel dimension lines business plan format outline PowerPoint templates will help them to explain complicated concepts. People tell us our black PowerPoint templates and PPT Slides will make you look like a winner. Customers tell us our 5 stages parallel dimension lines business plan format outline PowerPoint templates will generate and maintain the level of interest you desire. They will create the impression you want to imprint on your audience. Presenters tell us our checkout PowerPoint templates and PPT Slides have awesome images to get your point across. People tell us our 5 stages parallel dimension lines business plan format outline PowerPoint templates provide you with a vast range of viable options. Select the appropriate ones and just fill in your text. We assure you our black PowerPoint templates and PPT Slides are effectively colour coded to prioritise your plans They automatically highlight the sequence of events you desire.
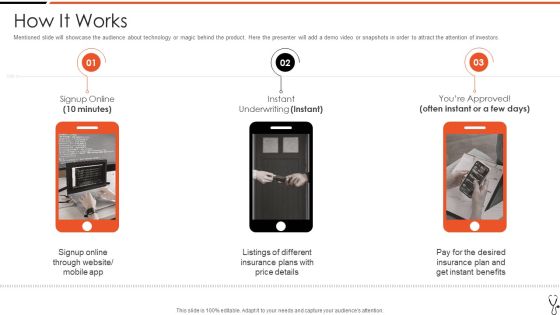
Technology Led Insurance Sector How It Works Topics PDF
Mentioned slide will showcase the audience about technology or magic behind the product. Here the presenter will add a demo video or snapshots in order to attract the attention of investors. This is a technology led insurance sector how it works topics pdf template with various stages. Focus and dispense information on three stages using this creative set, that comes with editable features. It contains large content boxes to add your information on topics like underwriting, insurance, plans, details, benefits. You can also showcase facts, figures, and other relevant content using this PPT layout. Grab it now.

Deploying Cloud Technology Cloud Platform Dashboard For Tracking Project Team Activities Ppt Inspiration Summary PDF
The following slide depicts project team task tracking cloud dashboard. It provides information about hours worked, projects worked, time spent, daily limit, product design, weekly activity, etc. Create an editable Deploying Cloud Technology Cloud Platform Dashboard For Tracking Project Team Activities Ppt Inspiration Summary PDF that communicates your idea and engages your audience. Whether you are presenting a business or an educational presentation, pre-designed presentation templates help save time. Deploying Cloud Technology Cloud Platform Dashboard For Tracking Project Team Activities Ppt Inspiration Summary PDF is highly customizable and very easy to edit, covering many different styles from creative to business presentations. Slidegeeks has creative team members who have crafted amazing templates. So, go and get them without any delay.

Case Competition Petroleum Sector Issues Table Of Contents Ppt Gallery Samples PDF
Deliver an awe inspiring pitch with this creative case competition petroleum sector issues table of contents ppt gallery samples pdf bundle. Topics like key performance indicator, management strategies, growth prospective, production dashboard, protect environment can be discussed with this completely editable template. It is available for immediate download depending on the needs and requirements of the user.

Evolving BI Infrastructure Addressing Cyber Risk Management Dashboard Background PDF
This slide portrays information regarding the dashboard that firm will use to manage cyber risks. The dashboard will provide clear picture of risk prevailing and how they are treated to technical engineers and board level executives. Deliver an awe inspiring pitch with this creative evolving bi infrastructure addressing cyber risk management dashboard background pdf bundle. Topics like risk rating breakdown, risk heat map, action plan breakdown, risk analysis progress can be discussed with this completely editable template. It is available for immediate download depending on the needs and requirements of the user.

Intelligent Infrastructure Addressing Cyber Risk Management Dashboard Formats PDF
This slide portrays information regarding the dashboard that firm will use to manage cyber risks. The dashboard will provide clear picture of risk prevailing and how they are treated to technical engineers and board level executives. Deliver and pitch your topic in the best possible manner with this Intelligent Infrastructure Addressing Cyber Risk Management Dashboard Formats PDF. Use them to share invaluable insights on Risk Analysis Progress, Risk Rating Breakdown, Risk Heat Map, Action Plan Breakdown and impress your audience. This template can be altered and modified as per your expectations. So, grab it now.
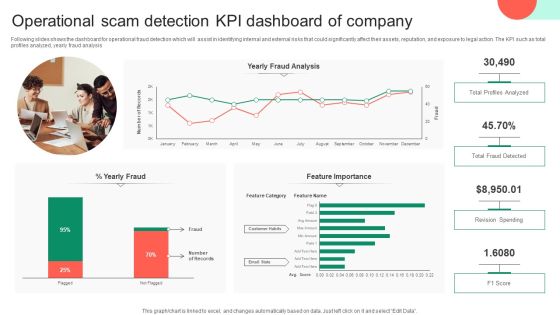
Operational Scam Detection KPI Dashboard Of Company Topics PDF
Following slides shows the dashboard for operational fraud detection which will assist in identifying internal and external risks that could significantly affect their assets, reputation, and exposure to legal action. The KPI such as total profiles analyzed, yearly fraud analysis. Pitch your topic with ease and precision using this Operational Scam Detection KPI Dashboard Of Company Topics PDF. This layout presents information on Profiles Analyzed, Operational Scam Detection, Kpi Dashboard Of Company. It is also available for immediate download and adjustment. So, changes can be made in the color, design, graphics or any other component to create a unique layout.

Business Intelligence KPI Dashboard Ppt PowerPoint Presentation Complete Deck With Slides
Improve your presentation delivery using this Business Intelligence KPI Dashboard Ppt PowerPoint Presentation Complete Deck With Slides. Support your business vision and objectives using this well-structured PPT deck. This template offers a great starting point for delivering beautifully designed presentations on the topic of your choice. Comprising sixteen this professionally designed template is all you need to host discussion and meetings with collaborators. Each slide is self-explanatory and equipped with high-quality graphics that can be adjusted to your needs. Therefore, you will face no difficulty in portraying your desired content using this PPT slideshow. This PowerPoint slideshow contains every important element that you need for a great pitch. It is not only editable but also available for immediate download and utilization. The color, font size, background, shapes everything can be modified to create your unique presentation layout. Therefore, download it now.

Digitization Framework For Technology Advancement Dashboard For Digital Enablement Ideas PDF
The purpose of this slide is to provide information regarding the dashboard that will determine digital enablement efforts of the firm in the areas of strategy, customer experience, organizational alignment, people and culture, etc. There are so many reasons you need a Digitization Framework For Technology Advancement Dashboard For Digital Enablement Ideas PDF. The first reason is you can not spend time making everything from scratch, Thus, Slidegeeks has made presentation templates for you too. You can easily download these templates from our website easily.

Team Displaying Sales Quarterly Performance Review System Icon Summary PDF
Presenting Team Displaying Sales Quarterly Performance Review System Icon Summary PDF to dispense important information. This template comprises four stages. It also presents valuable insights into the topics including Team Displaying, Sales Quarterly, Performance Review System, Icon. This is a completely customizable PowerPoint theme that can be put to use immediately. So, download it and address the topic impactfully.

Dashboards Major KPI Key Performance Indicators Of A Railway Company Formats PDF
Deliver an awe inspiring pitch with this creative dashboards major kpi key performance indicators of a railway company formats pdf bundle. Topics like revenue, employees, dashboards can be discussed with this completely editable template. It is available for immediate download depending on the needs and requirements of the user.

Dashboards Major KPI Key Performance Indicators Of A Railway Company Professional PDF
Deliver an awe inspiring pitch with this creative dashboards major kpi key performance indicators of a railway company professional pdf bundle. Topics like dashboards positive train control ptc implementation by freight and passenger trains can be discussed with this completely editable template. It is available for immediate download depending on the needs and requirements of the user.
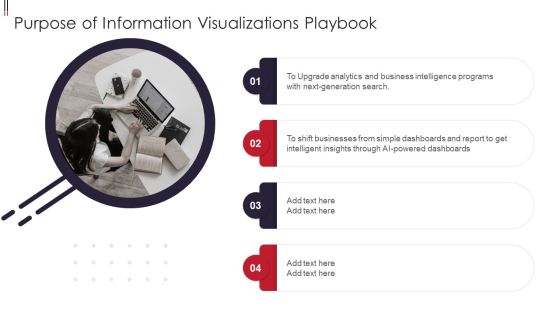
Information Visualizations Playbook Purpose Of Information Visualizations Playbook Demonstration PDF
This is a Information Visualizations Playbook Purpose Of Information Visualizations Playbook Demonstration PDF template with various stages. Focus and dispense information on four stages using this creative set, that comes with editable features. It contains large content boxes to add your information on topics like Analytics And Business, Dashboards. You can also showcase facts, figures, and other relevant content using this PPT layout. Grab it now.

ITSM Ticketing Tool Dashboard With Activity Status Guidelines PDF
This slide depicts information technology service management ITSM ticketing tool dashboard with activity status. It provides information about open tickets, closed tickets, requests, desktop support, alert level, completed tickets, etc. Crafting an eye catching presentation has never been more straightforward. Let your presentation shine with this tasteful yet straightforward ITSM Ticketing Tool Dashboard With Activity Status Guidelines PDF template. It offers a minimalistic and classy look that is great for making a statement. The colors have been employed intelligently to add a bit of playfulness while still remaining professional. Construct the ideal ITSM Ticketing Tool Dashboard With Activity Status Guidelines PDF that effortlessly grabs the attention of your audience Begin now and be certain to wow your customers.

HRMS Execution Plan Time And Attendance Management System Information PDF
This slide covers application of time management software. It also includes key features such as absence management, blackout dates, calendar view, expense management, leave request analysis dashboard, etc. Are you searching for a HRMS Execution Plan Time And Attendance Management System Information PDF that is uncluttered, straightforward, and original Its easy to edit, and you can change the colors to suit your personal or business branding. For a presentation that expresses how much effort you have put in, this template is ideal With all of its features, including tables, diagrams, statistics, and lists, its perfect for a business plan presentation. Make your ideas more appealing with these professional slides. Download HRMS Execution Plan Time And Attendance Management System Information PDF from Slidegeeks today.

3 Stages Parallel Arrow Structure Business Plan Basics PowerPoint Slides
We present our 3 stages parallel arrow structure business plan basics PowerPoint Slides.Download our Arrows PowerPoint Templates because It will Strengthen your hand with your thoughts. They have all the aces you need to win the day. Use our Signs PowerPoint Templates because you should Whip up a frenzy with our PowerPoint Templates and Slides. They will fuel the excitement of your team. Present our Shapes PowerPoint Templates because You aspire to touch the sky with glory. Let our PowerPoint Templates and Slides provide the fuel for your ascent. Present our Metaphors-Visual Concepts PowerPoint Templates because It can Conjure up grand ideas with our magical PowerPoint Templates and Slides. Leave everyone awestruck by the end of your presentation. Use our Business PowerPoint Templates because They will bring a lot to the table. Their alluring flavours will make your audience salivate.Use these PowerPoint slides for presentations relating to arrow, background, bar, barcode, black, checkout, code, control, data, design, digit, encode, goods, growth, identification, impact, industrial, information, inventory, isolated, item, laser, line, merchandise, number, optical, package, parallel, pattern, price, product, read, register, scan, sell, stripe, structure, supermarket, symbol, technology, texture, universal, vertical, white, width. The prominent colors used in the PowerPoint template are Blue, Green, Yellow. We assure you our 3 stages parallel arrow structure business plan basics PowerPoint Slides are effectively colour coded to prioritise your plans They automatically highlight the sequence of events you desire. People tell us our checkout PowerPoint templates and PPT Slides effectively help you save your valuable time. Customers tell us our 3 stages parallel arrow structure business plan basics PowerPoint Slides are incredible easy to use. Presenters tell us our black PowerPoint templates and PPT Slides will make the presenter look like a pro even if they are not computer savvy. People tell us our 3 stages parallel arrow structure business plan basics PowerPoint Slides will impress their bosses and teams. We assure you our checkout PowerPoint templates and PPT Slides provide great value for your money. Be assured of finding the best projection to highlight your words.

Business Assessment Outline Business Management Dashboards Customers Ppt Styles Graphics Pictures PDF
Deliver an awe-inspiring pitch with this creative business assessment outline business management dashboards customers ppt styles graphics pictures pdf bundle. Topics like revenue, compared to previous year, new customers, avg. revenue per customer, compared to previous year, cac vs customer lifetime value, customer aquisition cost, target achievement can be discussed with this completely editable template. It is available for immediate download depending on the needs and requirements of the user.
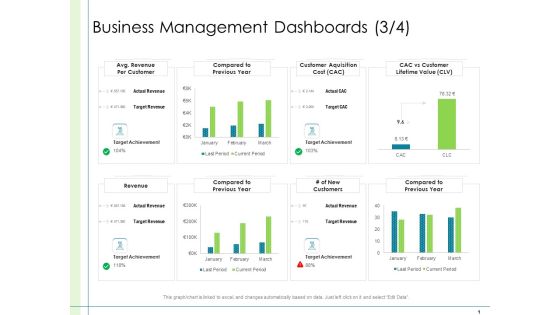
In Depth Business Assessment Business Management Dashboards Target Ppt PowerPoint Presentation Infographic Template Inspiration PDF
Deliver and pitch your topic in the best possible manner with this in depth business assessment business management dashboards target ppt powerpoint presentation infographic template inspiration pdf. Use them to share invaluable insights on avg revenue per customer, compared to previous year, customer aquisition cost, cac vs customer lifetime value, target achievement, compared to previous year, revenue, actual revenue, target revenue and impress your audience. This template can be altered and modified as per your expectations. So, grab it now.
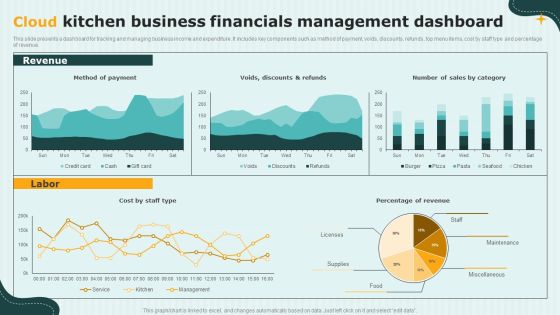
International Cloud Kitchen Industry Analysis Cloud Kitchen Business Financials Management Dashboard Template PDF
This slide presents a dashboard for tracking and managing business income and expenditure. It includes key components such as method of payment, voids, discounts, refunds, top menu items, cost by staff type and percentage of revenue. Do you have to make sure that everyone on your team knows about any specific topic I yes, then you should give International Cloud Kitchen Industry Analysis Cloud Kitchen Business Financials Management Dashboard Template PDF a try. Our experts have put a lot of knowledge and effort into creating this impeccable International Cloud Kitchen Industry Analysis Cloud Kitchen Business Financials Management Dashboard Template PDF. You can use this template for your upcoming presentations, as the slides are perfect to represent even the tiniest detail. You can download these templates from the Slidegeeks website and these are easy to edit. So grab these today
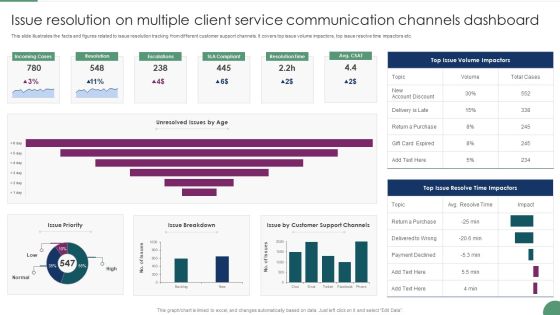
Issue Resolution On Multiple Client Service Communication Channels Dashboard Microsoft PDF
This slide illustrates the facts and figures related to issue resolution tracking from different customer support channels. It covers top issue volume impactors, top issue resolve time impactors etc. Pitch your topic with ease and precision using this Issue Resolution On Multiple Client Service Communication Channels Dashboard Microsoft PDF This layout presents information on Incoming Cases, Resolution, Escalations. It is also available for immediate download and adjustment. So, changes can be made in the color, design, graphics or any other component to create a unique layout.
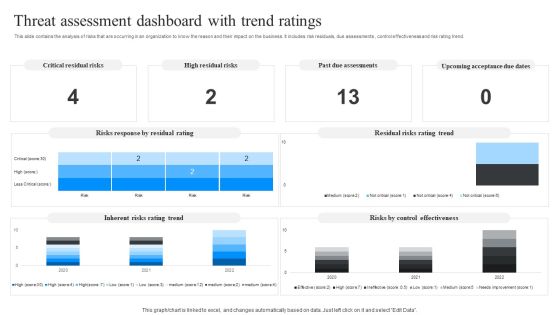
Threat Assessment Dashboard With Trend Ratings Ppt Model Vector PDF
This slide contains the analysis of risks that are occurring in an organization to know the reason and their impact on the business. It includes risk residuals, due assessments , control effectiveness and risk rating trend. Showcasing this set of slides titled Threat Assessment Dashboard With Trend Ratings Ppt Model Vector PDF. The topics addressed in these templates are Critical Residual Risks, High Residual Risks, Past Due Assessments. All the content presented in this PPT design is completely editable. Download it and make adjustments in color, background, font etc. as per your unique business setting.

Customer Relationship Management Software KPI Dashboard Application Deployment Project Plan Infographics PDF
This slide represents the dashboard showing details related to customer relationship management software. It includes details related to outbound sales, contracts closed, average contract value etc. From laying roadmaps to briefing everything in detail, our templates are perfect for you. You can set the stage with your presentation slides. All you have to do is download these easy to edit and customizable templates. Customer Relationship Management Software KPI Dashboard Application Deployment Project Plan Infographics PDF will help you deliver an outstanding performance that everyone would remember and praise you for. Do download this presentation today.
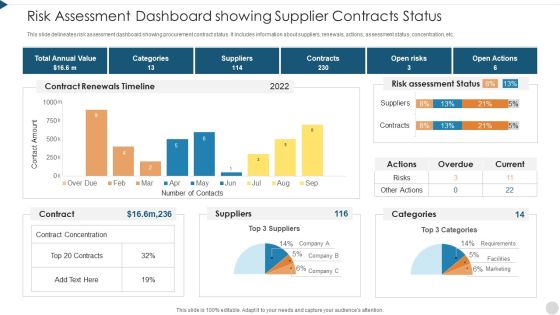
Risk Assessment Dashboard Showing Supplier Contracts Status Template PDF
This slide delineates risk assessment dashboard showing procurement contract status. It includes information about suppliers, renewals, actions, assessment status, concentration, etc. Showcasing this set of slides titled risk assessment dashboard showing supplier contracts status template pdf. The topics addressed in these templates are risk assessment dashboard showing supplier contracts status. All the content presented in this PPT design is completely editable. Download it and make adjustments in color, background, font etc. as per your unique business setting.

Incident Management Dashboard With Injury Type Diagrams PDF
This shows the dashboard for visually presenting information regarding incident type, cause category, monthly trends and location of occurrence. Showcasing this set of slides titled incident management dashboard with injury type diagrams pdf. The topics addressed in these templates are incident management dashboard with injury type. All the content presented in this PPT design is completely editable. Download it and make adjustments in color, background, font etc. as per your unique business setting.
Digital Insurance Dashboard With Enrollment Status Icons PDF
This slide illustrates digital insurance dashboard with customer enrollment status. It provides information about revenue, enrollment by age, enrollment level, etc. Showcasing this set of slides titled Digital Insurance Dashboard With Enrollment Status Icons PDF. The topics addressed in these templates are Digital Insurance Dashboard With Enrollment Status. All the content presented in this PPT design is completely editable. Download it and make adjustments in color, background, font etc. as per your unique business setting.

Affiliate Marketing KPI Dashboard With Click Through Rate Slides PDF
The following slide showcases a comprehensive affiliate marketing KPI dashboard. Information covered in this slide is related to total sales , commission, clicks, sessions, click through rate, etc. Showcasing this set of slides titled Affiliate Marketing KPI Dashboard With Click Through Rate Slides PDF. The topics addressed in these templates are Sales, Dashboard, Commission. All the content presented in this PPT design is completely editable. Download it and make adjustments in color, background, font etc. as per your unique business setting.
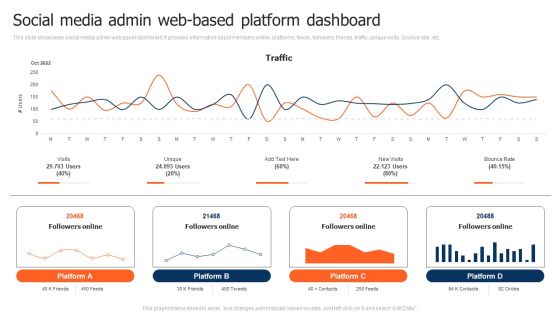
Social Media Admin Web Based Platform Dashboard Demonstration PDF
This slide showcases social media admin web panel dashboard. It provides information about members online, platforms, feeds, followers, friends, traffic, unique visits, bounce rate, etc. Showcasing this set of slides titled Social Media Admin Web Based Platform Dashboard Demonstration PDF. The topics addressed in these templates are Social Media Admin, Web Based Platform Dashboard. All the content presented in this PPT design is completely editable. Download it and make adjustments in color, background, font etc. as per your unique business setting.
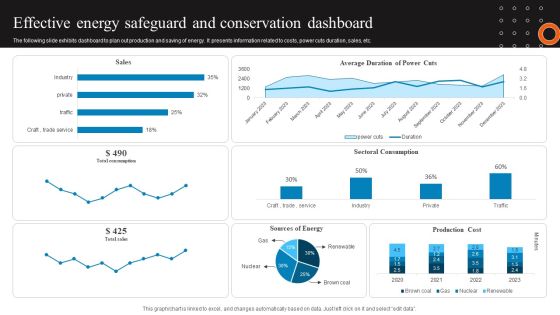
Effective Energy Safeguard And Conservation Dashboard Graphics PDF
The following slide exhibits dashboard to plan out production and saving of energy. It presents information related to costs, power cuts duration, sales, etc. Showcasing this set of slides titled Effective Energy Safeguard And Conservation Dashboard Graphics PDF. The topics addressed in these templates are Average Duration, Effective Energy Safeguard, Conservation Dashboard. All the content presented in this PPT design is completely editable. Download it and make adjustments in color, background, font etc. as per your unique business setting.
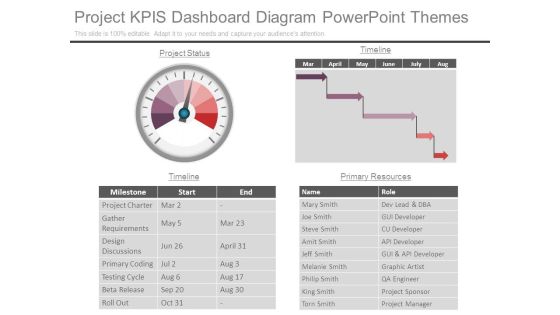
Project Kpis Dashboard Diagram Powerpoint Themes
This is a project kpis dashboard diagram powerpoint themes. This is a one stage process. The stages in this process are project status, timeline, name, role, milestone, start, end, primary resources, project charter, gather requirements, design discussions, primary coding, testing cycle, beta release, roll out, mary smith, joe smith, steve smith, amit smith, jeff smith, melanie smith, philip smith, king smith, torn smith, dev lead and dba, gui developer, cu developer, api developer, gui and api developer, graphic artist, qa engineer, project sponsor, project manager.

Alarm Clock Dashboard Design For Time Management Powerpoint Slides
This PowerPoint template has been designed with graphics of alarm clock. You may use this dashboard slide design for topics like time management. This PPT slide is powerful tool to describe your ideas.
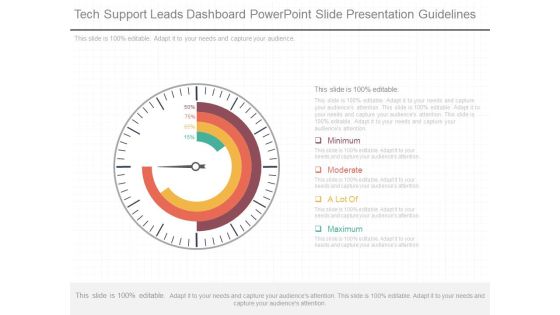
Tech Support Leads Dashboard Powerpoint Slide Presentation Guidelines
This is a tech support leads dashboard powerpoint slide presentation guidelines. This is a four stage process. The stages in this process are minimum, moderate, a lot of, maximum.

Bi Dashboard Design For Solutions Ppt Powerpoint Slides
This is a bi dashboard design for solutions ppt powerpoint slides. This is a four stage process. The stages in this process are total understand, total brands, total revenue, total sales.

Daily Executive Dashboards For Web Ppt Presentation Ideas
This is a daily executive dashboards for web ppt presentation ideas. This is a six stage process. The stages in this process are homepage, login, purchase ticket, email confirmation, ecommerce website, revenue per minute.

Dashboard Design And Development For Travel Diagram Background
This is a dashboard design and development for travel diagram background. This is a five stage process. The stages in this process are number of trips, sales, delayed flights, regional load, flight expense.
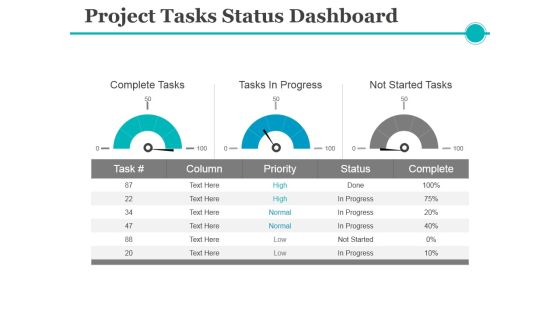
Project Tasks Status Dashboard Ppt PowerPoint Presentation File Graphics Download
This is a project tasks status dashboard ppt powerpoint presentation file graphics download. This is a three stage process. The stages in this process are complete tasks, tasks in progress, not started tasks.

Sales Performance Dashboard Ppt PowerPoint Presentation Ideas Portfolio
This is a sales performance dashboard ppt powerpoint presentation ideas portfolio. This is a three stage process. The stages in this process are revenue, new customers, gross profit, customer satisfaction, sales comparison.
Sales Performance Dashboard Ppt PowerPoint Presentation Pictures Icons
This is a sales performance dashboard ppt powerpoint presentation pictures icons. This is a six stage process. The stages in this process are top selling plans, top opportunities, new customer, sales funnel, top sales reps.

Strategy To Enhance Buyer Intimacy Customer Experience Dashboard Ppt Styles Ideas PDF
Mentioned slide provides comprehensive statistics for measuring and evaluating customer experience level with respect to brand persona. It covers customer satisfaction index, rewards member index etc. Deliver an awe inspiring pitch with this creative strategy to enhance buyer intimacy customer experience dashboard ppt styles ideas pdf bundle. Topics like customer experience dashboard can be discussed with this completely editable template. It is available for immediate download depending on the needs and requirements of the user.
Deploying B2C Social Media Dashboard To Track Social Media Engagement Activity Icons PDF
This slide focuses on dashboard that depicts tracking status of social media engagement activities that covers subscribers, followers, likes, channel views, clicks and likes, shares, posts, etc.Deliver and pitch your topic in the best possible manner with this Deploying B2C Social Media Dashboard To Track Social Media Engagement Activity Icons PDF. Use them to share invaluable insights on Instagram Overview, Twitter Statistics, Channel Views and impress your audience. This template can be altered and modified as per your expectations. So, grab it now.
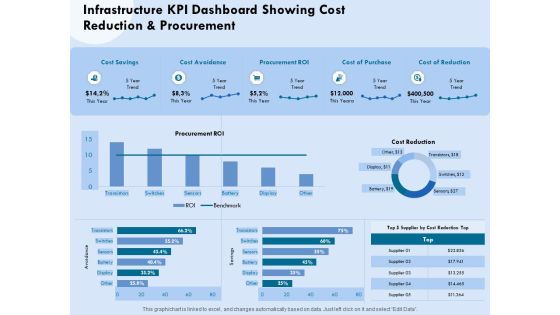
Functional Analysis Of Business Operations Infrastructure KPI Dashboard Showing Cost Reduction Elements PDF
Presenting this set of slides with name functional analysis of business operations infrastructure kpi dashboard showing cost reduction elements pdf. The topics discussed in these slides are cost savings, cost avoidance, procurement, cost of purchase, cost of reduction. This is a completely editable PowerPoint presentation and is available for immediate download. Download now and impress your audience.

Functional Analysis Of Business Operations Infrastructure KPI Dashboard Showing Project Revenue Clipart PDF
Presenting this set of slides with name functional analysis of business operations infrastructure kpi dashboard showing project revenue clipart pdf. The topics discussed in these slides are revenue, project, employee, construction, price. This is a completely editable PowerPoint presentation and is available for immediate download. Download now and impress your audience.
Functional Analysis Of Business Operations Infrastructure KPI Dashboard Showing Resource Allocation Icons PDF
Presenting this set of slides with name functional analysis of business operations infrastructure kpi dashboard showing resource allocation icons pdf. The topics discussed in these slides are project financial, resource allocation, timeline. This is a completely editable PowerPoint presentation and is available for immediate download. Download now and impress your audience.
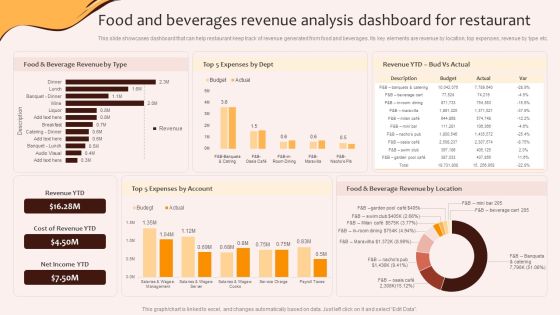
Digital Marketing Plan For Restaurant Business Food And Beverages Revenue Analysis Dashboard Template PDF
This slide showcases dashboard that can help restaurant keep track of revenue generated from food and beverages. Its key elements are revenue by location, top expenses, revenue by type etc.The best PPT templates are a great way to save time, energy, and resources. Slidegeeks have 100precent editable powerpoint slides making them incredibly versatile. With these quality presentation templates, you can create a captivating and memorable presentation by combining visually appealing slides and effectively communicating your message. Download Digital Marketing Plan For Restaurant Business Food And Beverages Revenue Analysis Dashboard Template PDF from Slidegeeks and deliver a wonderful presentation.
Contents Employee Productivity Management Addressing Appraisal Tracking And Management Dashboard Introduction PDF
This slide provides information about appraisal tracking and management dashboard for tracking feedback and appraisal status. Deliver an awe inspiring pitch with this creative Contents Employee Productivity Management Addressing Appraisal Tracking And Management Dashboard Introduction PDF bundle. Topics like Appraisals Consolidation, Appraisals Release, Appraisals Final can be discussed with this completely editable template. It is available for immediate download depending on the needs and requirements of the user.
 Home
Home