Data Report
Modifying Banking Functionalities Dashboard Tracking Customer Retention Rate Information PDF
This slide contains dashboard that will allow bank to track the retention rate of customer within span of 6 months. Number of accounts that are successfully retained by the bank. It will also bank in tracking accounts that are cancelled. Deliver and pitch your topic in the best possible manner with this enhancing financial institution operations dashboard tracking customer retention rate ideas pdf. Use them to share invaluable insights on dashboard tracking customer retention rate and impress your audience. This template can be altered and modified as per your expectations. So, grab it now.

Co Variety Advertisement Various Campaigns Performance Analysis Dashboard Elements PDF
This slide provides information regarding the analysis of various campaigns that are initiated by firm with the help of partners in terms of total impressions, total clicks, etc. Deliver and pitch your topic in the best possible manner with this co variety advertisement various campaigns performance analysis dashboard elements pdf. Use them to share invaluable insights on various campaigns performance analysis dashboard and impress your audience. This template can be altered and modified as per your expectations. So, grab it now.
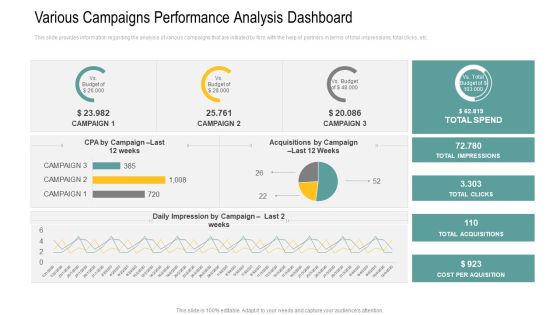
Various Campaigns Performance Analysis Dashboard Ppt Layouts Deck PDF
This slide provides information regarding the analysis of various campaigns that are initiated by firm with the help of partners in terms of total impressions, total clicks, etc. Deliver and pitch your topic in the best possible manner with this various campaigns performance analysis dashboard ppt layouts deck pdf. Use them to share invaluable insights on various campaigns performance analysis dashboard and impress your audience. This template can be altered and modified as per your expectations. So, grab it now.
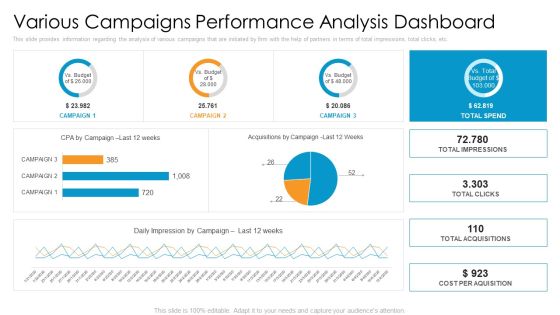
Partner Advertisement Strategy Various Campaigns Performance Analysis Dashboard Ideas PDF
This slide provides information regarding the analysis of various campaigns that are initiated by firm with the help of partners in terms of total impressions, total clicks, etc. Deliver an awe-inspiring pitch with this creative partner advertisement strategy various campaigns performance analysis dashboard ideas pdf bundle. Topics like various campaigns performance analysis dashboard can be discussed with this completely editable template. It is available for immediate download depending on the needs and requirements of the user.
Various Campaigns Performance Analysis Dashboard Ppt Icon Graphic Images PDF
This slide provides information regarding the analysis of various campaigns that are initiated by firm with the help of partners in terms of total impressions, total clicks, etc. Deliver and pitch your topic in the best possible manner with this various campaigns performance analysis dashboard ppt icon graphic images pdf. Use them to share invaluable insights on various campaigns performance analysis dashboard and impress your audience. This template can be altered and modified as per your expectations. So, grab it now.
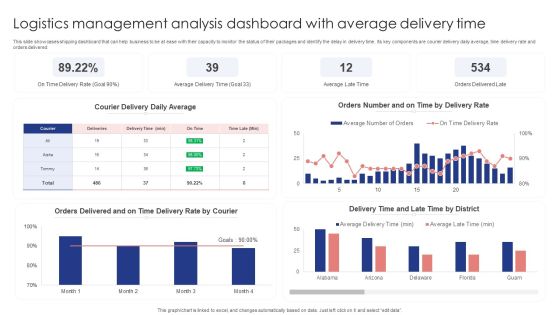
Logistics Management Analysis Dashboard With Average Delivery Time Themes PDF
This slide showcases shipping dashboard that can help business to be at ease with their capacity to monitor the status of their packages and identify the delay in delivery time. Its key components are courier delivery daily average, time delivery rate and orders delivered. Showcasing this set of slides titled Logistics Management Analysis Dashboard With Average Delivery Time Themes PDF. The topics addressed in these templates are Courier Delivery Daily Average, Delivery Rate, Orders Delivered. All the content presented in this PPT design is completely editable. Download it and make adjustments in color, background, font etc. as per your unique business setting.

Dashboard For Inbound Marketing Efforts Marketing Tactics To Enhance Business Graphics PDF
The following slide displays key metrics that can help the organization to measure effectiveness of inbound marketing strategy, these can be cost per conversion, clicks, impressions, etc. If you are looking for a format to display your unique thoughts, then the professionally designed Dashboard For Inbound Marketing Efforts Marketing Tactics To Enhance Business Graphics PDF is the one for you. You can use it as a Google Slides template or a PowerPoint template. Incorporate impressive visuals, symbols, images, and other charts. Modify or reorganize the text boxes as you desire. Experiment with shade schemes and font pairings. Alter, share or cooperate with other people on your work. Download Dashboard For Inbound Marketing Efforts Marketing Tactics To Enhance Business Graphics PDF and find out how to give a successful presentation. Present a perfect display to your team and make your presentation unforgettable.
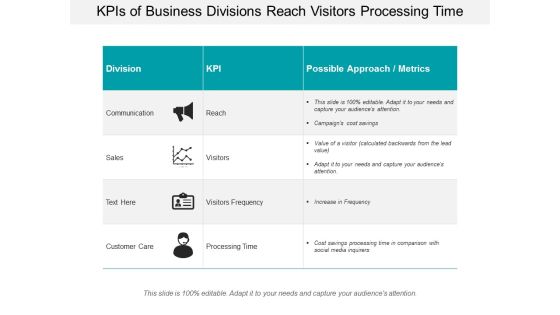
Kpis Of Business Divisions Reach Visitors Processing Time Ppt PowerPoint Presentation Slides Outfit
This is a kpis of business divisions reach visitors processing time ppt powerpoint presentation slides outfit. This is a three stage process. The stages in this process are kpi proposal, kpi plan, kpi scheme.
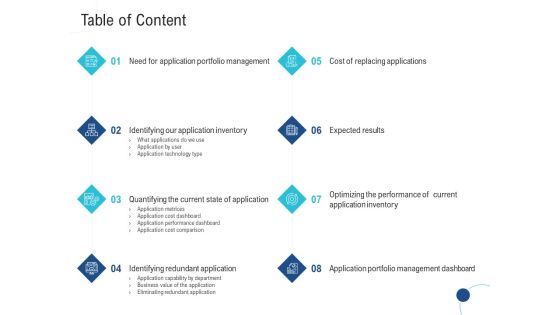
Enhance Enterprise Application Performance Table Of Content Ppt Infographic Template Example File
Deliver and pitch your topic in the best possible manner with this enhance enterprise application performance table of content ppt infographic template example file. Use them to share invaluable insights on portfolio management, technology, performance dashboard, optimizing, business and impress your audience. This template can be altered and modified as per your expectations. So, grab it now.

Table Of Content Enhancing Hospital Software System Metrics Pictures PDF
Deliver an awe inspiring pitch with this creative table of content enhancing hospital software system metrics pictures pdf bundle. Topics like risk management framework, management system, dashboards and metrics can be discussed with this completely editable template. It is available for immediate download depending on the needs and requirements of the user.

Business Risk Assessment Dashboard Highlighted On Monitor Screen Summary PDF
Persuade your audience using this Business Risk Assessment Dashboard Highlighted On Monitor Screen Summary PDF This PPT design covers four stages, thus making it a great tool to use. It also caters to a variety of topics including Business Risk, Assessment Dashboard Highlighted, Monitor Screen Download this PPT design now to present a convincing pitch that not only emphasizes the topic but also showcases your presentation skills.

Dashboard To Measure Business Financial Performance Summary PDF
This slide shows the dashboard to measure business financial performance which focuses on revenues, debt to equity, net profit margin, gross profit margin and return on equity. Are you searching for a Dashboard To Measure Business Financial Performance Summary PDF that is uncluttered, straightforward, and original Its easy to edit, and you can change the colors to suit your personal or business branding. For a presentation that expresses how much effort youve put in, this template is ideal With all of its features, including tables, diagrams, statistics, and lists, its perfect for a business plan presentation. Make your ideas more appealing with these professional slides. Download Dashboard To Measure Business Financial Performance Summary PDF from Slidegeeks today.

Key Performance Of Business Statistics For Quarterly Sales Review Formats PDF
This slide displays sales KPI to measure the performance and effectiveness of sales activities in organization. It includes information about sales growth, customer acquisition cost and churn rate, lead conversion ratio, etc. Presenting Key Performance Of Business Statistics For Quarterly Sales Review Formats PDF to dispense important information. This template comprises six stages. It also presents valuable insights into the topics including Sales Growth, Customer Acquisition Cost, Customer Churn Rate, Opportunity To Win Ratio, Lead Conversion Ratio. This is a completely customizable PowerPoint theme that can be put to use immediately. So, download it and address the topic impactfully.
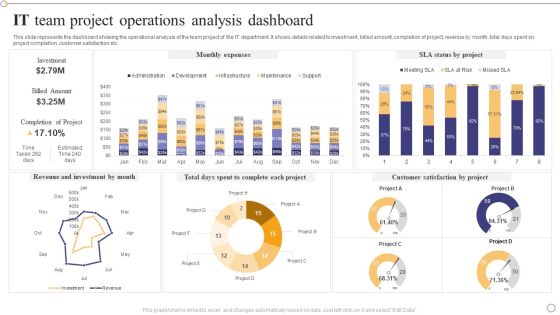
IT Team Project Operations Analysis Dashboard Clipart PDF
This slide represents the dashboard showing the operational analysis of the team project of the IT department. It shows details related to investment, billed amount, completion of project, revenue by month, total days spent on project completion, customer satisfaction etc.Showcasing this set of slides titled IT Team Project Operations Analysis Dashboard Clipart PDF. The topics addressed in these templates are Revenue Investment, Complete Each Project, Customer Satisfaction. All the content presented in this PPT design is completely editable. Download it and make adjustments in color, background, font etc. as per your unique business setting.
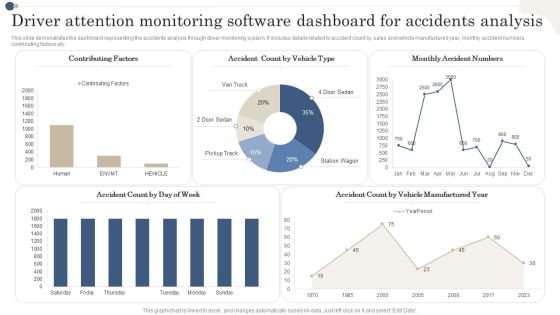
Driver Attention Monitoring Software Dashboard For Accidents Analysis Diagrams PDF
This slide demonstrates the dashboard representing the accidents analysis through driver monitoring system. It includes details related to accident count by sales and vehicle manufactured year, monthly accident numbers, contributing factors etc. Showcasing this set of slides titled Driver Attention Monitoring Software Dashboard For Accidents Analysis Diagrams PDF. The topics addressed in these templates are Contributing Factors,Vehicle Type, Monthly Accident Numbers. All the content presented in this PPT design is completely editable. Download it and make adjustments in color, background, font etc. as per your unique business setting.

Sales Transaction Overview Dashboard With Variance Analysis Summary PDF
The following slide displays dashboard to summarize sales transactions of the company for effective management of income and revenue. It further includes KPIs such as monthly and yearly breakdown, new customers, etc. Showcasing this set of slides titled Sales Transaction Overview Dashboard With Variance Analysis Summary PDF. The topics addressed in these templates are Sales, Customers, Variance Analysis. All the content presented in this PPT design is completely editable. Download it and make adjustments in color, background, font etc. as per your unique business setting.

Customer Service Time Utilization Analysis Kpi Dashboard Designs PDF
The following slide highlights the time that customer expects e-mail response to enhance loyal customer base. It includes elements of response time immediate, less than one hr., within a day, two day etc. Showcasing this set of slides titled Customer Service Time Utilization Analysis Kpi Dashboard Designs PDF. The topics addressed in these templates are Customer Service, Time Utilization Analysis, KPI Dashboard. All the content presented in this PPT design is completely editable. Download it and make adjustments in color, background, font etc. as per your unique business setting.

Website Scam Analysis KPI Dashboard Of Organization Sample PDF
Following slides show the organizational website fraud analysis dashboard which will assist in evaluation fraud prevention strategy. It includes the KPI such as ad website traffic, search leads , etc. Showcasing this set of slides titled Website Scam Analysis KPI Dashboard Of Organization Sample PDF. The topics addressed in these templates are Goal Conversions, Conversions Rate, Organic Leads. All the content presented in this PPT design is completely editable. Download it and make adjustments in color, background, font etc. as per your unique business setting.

Parameters Of Growth And Development Powerpoint Slides
Dashboard design has been displayed in this business slide. This business diagram helps to exhibit parameters of growth and development. Download this PowerPoint template to build an exclusive presentation.

Departmental Goals And Progress Status Dashboard Ppt Portfolio Samples PDF
This slide illustrates statistics and graphical representation of team progress. It includes testing team, sales team, development team, members and progress status graphs etc. Pitch your topic with ease and precision using this Departmental Goals And Progress Status Dashboard Ppt Portfolio Samples PDF. This layout presents information on Testing Team, Sales Team, Development Team. It is also available for immediate download and adjustment. So, changes can be made in the color, design, graphics or any other component to create a unique layout.
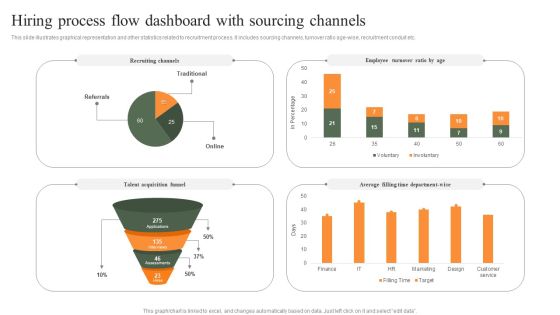
Hiring Process Flow Dashboard With Sourcing Channels Professional PDF
This slide illustrates graphical representation and other statistics related to recruitment process. It includes sourcing channels, turnover ratio age-wise, recruitment conduit etc. Pitch your topic with ease and precision using this Hiring Process Flow Dashboard With Sourcing Channels Professional PDF. This layout presents information on Employee Turnover Ratio, Recruiting Channels, Average. It is also available for immediate download and adjustment. So, changes can be made in the color, design, graphics or any other component to create a unique layout.
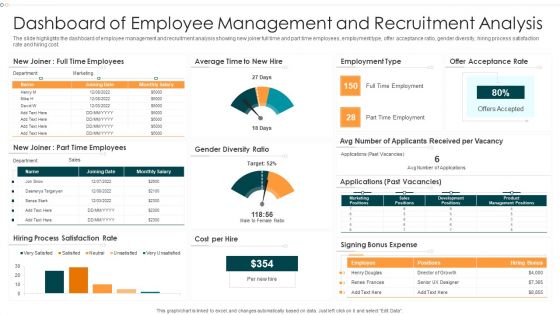
Dashboard Of Employee Management And Recruitment Analysis Infographics PDF
The slide highlights the dashboard of employee management and recruitment analysis showing new joiner full time and part time employees, employment type, offer acceptance ratio, gender diversity, hiring process satisfaction rate and hiring cost.Pitch your topic with ease and precision using this Dashboard Of Employee Management And Recruitment Analysis Infographics PDF This layout presents information on Dashboard Employee, Management, Recruitment Analysis It is also available for immediate download and adjustment. So, changes can be made in the color, design, graphics or any other component to create a unique layout.

KPI Dashboard To Analyze PPC Marketing Campaigns Performance Information PDF
This slide showcases the parameters that would help the business organization to evaluate Pay Per Click PPC marketing performance. It includes ad cost, clicks, impression, conversions, ad impressions, conversion rate, Cost Per Click CPC, etc. Presenting this PowerPoint presentation, titled KPI Dashboard To Analyze PPC Marketing Campaigns Performance Information PDF, with topics curated by our researchers after extensive research. This editable presentation is available for immediate download and provides attractive features when used. Download now and captivate your audience. Presenting this KPI Dashboard To Analyze PPC Marketing Campaigns Performance Information PDF. Our researchers have carefully researched and created these slides with all aspects taken into consideration. This is a completely customizable KPI Dashboard To Analyze PPC Marketing Campaigns Performance Information PDF that is available for immediate downloading. Download now and make an impact on your audience. Highlight the attractive features available with our PPTs.

Security KPI Dashboard Content Ppt PowerPoint Presentation Complete With Slides
Improve your presentation delivery using this Security KPI Dashboard Content Ppt PowerPoint Presentation Complete With Slides. Support your business vision and objectives using this well-structured PPT deck. This template offers a great starting point for delivering beautifully designed presentations on the topic of your choice. Comprising tweleve this professionally designed template is all you need to host discussion and meetings with collaborators. Each slide is self-explanatory and equipped with high-quality graphics that can be adjusted to your needs. Therefore, you will face no difficulty in portraying your desired content using this PPT slideshow. This PowerPoint slideshow contains every important element that you need for a great pitch. It is not only editable but also available for immediate download and utilization. The color, font size, background, shapes everything can be modified to create your unique presentation layout. Therefore, download it now.

Internal Organizational Communication Kpis And Dashboard With Channels Infographics PDF
This slide showcases dashboard that can help organization to assess the performance of internal communication and analyzing the user participation. Its key components are message success, channels and user engagement. Pitch your topic with ease and precision using this Internal Organizational Communication Kpis And Dashboard With Channels Infographics PDF. This layout presents information on User Participation, User Engagement, Message Success. It is also available for immediate download and adjustment. So, changes can be made in the color, design, graphics or any other component to create a unique layout.

Client Onboarding Framework Client Onboarding Dashboard Value Information PDF
Deliver an awe inspiring pitch with this creative client onboarding framework client onboarding dashboard value information pdf bundle. Topics like corporation, communications, value, biotechnology can be discussed with this completely editable template. It is available for immediate download depending on the needs and requirements of the user.

Restaurant Promotion Marketing Analysis Dashboard For Hospitality Company Microsoft PDF
This slide shows the dashboard to be used by the hospitality company for analyzing the restaurant marketing. It includes details related to revenue, cost of revenue, net income, food and beverage revenue by location and type etc.Showcasing this set of slides titled Restaurant Promotion Marketing Analysis Dashboard For Hospitality Company Microsoft PDF The topics addressed in these templates are Beverage Revenue, Food Beverage, Expenses Account All the content presented in this PPT design is completely editable. Download it and make adjustments in color, background, font etc. as per your unique business setting.

Customer Needs Survey Analysis Dashboard Of Company Inspiration PDF
This slide shows the insights of the survey conducted by an organization to identify the needs of their customers through the help of a dashboard. It shows no. of respondents, types of browser, location, operating system etc. Showcasing this set of slides titled Customer Needs Survey Analysis Dashboard Of Company Inspiration PDF. The topics addressed in these templates are Operating System, Location, Device. All the content presented in this PPT design is completely editable. Download it and make adjustments in color, background, font etc. as per your unique business setting.

Logistics Management Revenue Analysis Dashboard With Orders Revenue Brochure PDF
This slide showcases shipping dashboard that can help company to calculate the revenue generated from delivered products and track the monthly order status. Its key components are highest revenue days, subscription revenue, order status, order revenue and transaction paid status. Showcasing this set of slides titled Logistics Management Revenue Analysis Dashboard With Orders Revenue Brochure PDF. The topics addressed in these templates are Order Revenue, Transaction Paid, Subscription Revenue. All the content presented in this PPT design is completely editable. Download it and make adjustments in color, background, font etc. as per your unique business setting.

Cut Of Procurement Cost Dashboard With Spend Analysis Elements PDF
This slide showcases containment cost dashboard to identify and formulate appropriate expense reduction strategies for the company. It includes components such as product grouping, contact overview, top vendors, etc. Showcasing this set of slides titled Cut Of Procurement Cost Dashboard With Spend Analysis Elements PDF. The topics addressed in these templates are Spend Category, Product Grouping, Contract Overview. All the content presented in this PPT design is completely editable. Download it and make adjustments in color, background, font etc. as per your unique business setting.

Dashboard For Strategic Organization Evaluation Of Employee Performance Ppt Icon Mockup PDF
This slide displays dashboard to strategically review and analyze employee performance in the organization to determine overall efficiency of business operations. It includes KPIs such as absenteeism, overtime hours, training costs and overall labor efficiency. Pitch your topic with ease and precision using this Dashboard For Strategic Organization Evaluation Of Employee Performance Ppt Icon Mockup PDF. This layout presents information on Training Costs, Overall Labor Effectiveness, Absenteeism, Overtime Hours. It is also available for immediate download and adjustment. So, changes can be made in the color, design, graphics or any other component to create a unique layout.

Financial Analysis Dashboard Of Corporate Bank Mockup PDF
Following slide outlines the dashboard for financial examination of corporate financial institution which shows how banks managing their cash flow annually Pitch your topic with ease and precision using this Financial Analysis Dashboard Of Corporate Bank Mockup PDF. This layout presents information on Month, Current Ratio, Inventory. It is also available for immediate download and adjustment. So, changes can be made in the color, design, graphics or any other component to create a unique layout.
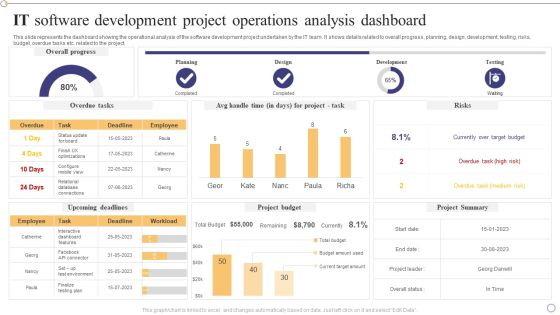
IT Software Development Project Operations Analysis Dashboard Pictures PDF
This slide represents the dashboard showing the operational analysis of the software development project undertaken by the IT team. It shows details related to overall progress, planning, design, development, testing, risks, budget, overdue tasks etc. related to the project.Pitch your topic with ease and precision using this IT Software Development Project Operations Analysis Dashboard Pictures PDF. This layout presents information on Interactive Dashboard, Currently Over Target, Overdue Task. It is also available for immediate download and adjustment. So, changes can be made in the color, design, graphics or any other component to create a unique layout.

Project Management Dashboard For Tracking Cost Time Analysis Background PDF
This slide depicts the project management dashboard used to track the cost and schedule performance and ensure it does not exceed estimated levels. It includes overall health, task at hand, schedule and cost tracker, progress and current workload. Pitch your topic with ease and precision using this Project Management Dashboard For Tracking Cost Time Analysis Background PDF. This layout presents information on Project Management Dashboard, Tracking Cost Time Analysis. It is also available for immediate download and adjustment. So, changes can be made in the color, design, graphics or any other component to create a unique layout.
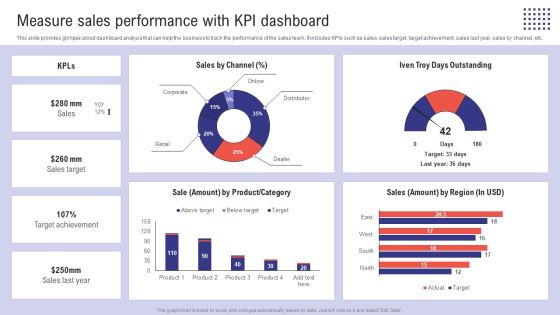
Planning Sales Campaign To Improve Measure Sales Performance With Kpi Dashboard Topics PDF
This slide provides glimpse about dashboard analysis that can help the business to track the performance of the sales team. It includes KPIs such as sales, sales target, target achievement, sales last year, sales by channel, etc. Explore a selection of the finest Planning Sales Campaign To Improve Measure Sales Performance With Kpi Dashboard Topics PDF here. With a plethora of professionally designed and pre-made slide templates, you can quickly and easily find the right one for your upcoming presentation. You can use our Planning Sales Campaign To Improve Measure Sales Performance With Kpi Dashboard Topics PDF to effectively convey your message to a wider audience. Slidegeeks has done a lot of research before preparing these presentation templates. The content can be personalized and the slides are highly editable. Grab templates today from Slidegeeks.
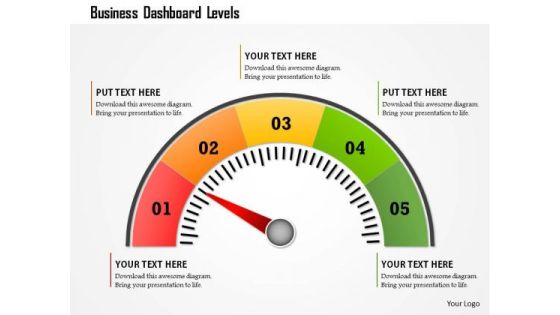
Business Framework Business Dashboard Levels PowerPoint Presentation
This business diagram displays colored meter with multiple levels. Use this diagram to display business process. This diagram can be used to indicate performance measures. This is an excellent diagram to impress your audiences.
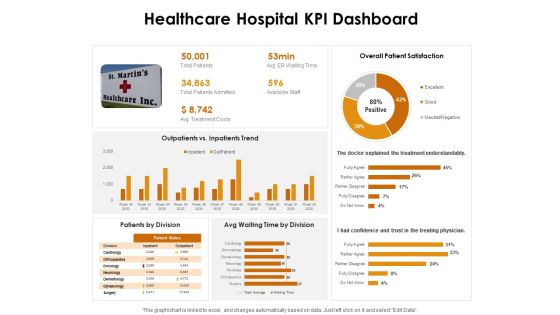
KPI Dashboards Per Industry Healthcare Hospital KPI Dashboard Ppt PowerPoint Presentation Show Infographics PDF
Deliver an awe-inspiring pitch with this creative kpi dashboards per industry healthcare hospital kpi dashboard ppt powerpoint presentation show infographics pdf bundle. Topics like overall patient satisfaction, outpatients vs. inpatients trend, doctor explained the treatment understandably can be discussed with this completely editable template. It is available for immediate download depending on the needs and requirements of the user.

Increase Sales By Lead Generation Lead Distribution Dashboard Information PDF
Crafting an eye catching presentation has never been more straightforward. Let your presentation shine with this tasteful yet straightforward Increase Sales By Lead Generation Lead Distribution Dashboard Information PDF template. It offers a minimalistic and classy look that is great for making a statement. The colors have been employed intelligently to add a bit of playfulness while still remaining professional. Construct the ideal Increase Sales By Lead Generation Lead Distribution Dashboard Information PDF that effortlessly grabs the attention of your audience Begin now and be certain to wow your customers.
Agile Project Management Activities Tracking Dashboard Information PDF
This slide provides information regarding the dashboard which will help team in managing different activities associated to agile projects and keep track on the time, task summary, etc. Find a pre designed and impeccable Agile Project Management Activities Tracking Dashboard Information PDF. The templates can ace your presentation without additional effort. You can download these easy to edit presentation templates to make your presentation stand out from others. So, what are you waiting for Download the template from Slidegeeks today and give a unique touch to your presentation.
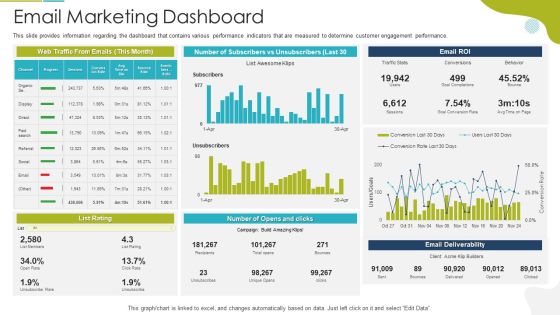
Tactical Marketing Strategy For Customer Engagement Email Marketing Dashboard Topics PDF
This slide provides information regarding the dashboard that contains various performance indicators that are measured to determine customer engagement performance. Deliver and pitch your topic in the best possible manner with this tactical marketing strategy for customer engagement email marketing dashboard topics pdf. Use them to share invaluable insights on email marketing dashboard and impress your audience. This template can be altered and modified as per your expectations. So, grab it now.

Implementing Successful Strategic Marketing Plan To Increase ROI Email Marketing Dashboard Microsoft PDF
This slide provides information regarding the dashboard that contains various performance indicators that are measured to determine customer engagement performance. Deliver an awe inspiring pitch with this creative implementing successful strategic marketing plan to increase roi email marketing dashboard microsoft pdf bundle. Topics like email marketing dashboard can be discussed with this completely editable template. It is available for immediate download depending on the needs and requirements of the user.
Ways To Retain Consumer Through Strategic Marketing Email Marketing Dashboard Icons PDF
This slide provides information regarding the dashboard that contains various performance indicators that are measured to determine customer engagement performance. Deliver and pitch your topic in the best possible manner with this ways to retain consumer through strategic marketing email marketing dashboard icons pdf. Use them to share invaluable insights on email marketing dashboard and impress your audience. This template can be altered and modified as per your expectations. So, grab it now.

Agile Project Activity Monitoring With Status Information PDF
This slide illustrates project development status of agile program. It includes scope, schedule, cost, risks, quality, sprint deliverables such as headline, start, end, status, etc. Showcasing this set of slides titled Agile Project Activity Monitoring With Status Information PDF. The topics addressed in these templates are Agile Project, Activity Monitoring Status. All the content presented in this PPT design is completely editable. Download it and make adjustments in color, background, font etc. as per your unique business setting.

Techniques To Elevate Brand Visibility Reputation Management Dashboard To Manage Brands Status Sample PDF
This slide provides information regarding reputation management to monitor brands status in terms of brand review summary, listing score, competition, listing accuracy, etc. Are you in need of a template that can accommodate all of your creative concepts This one is crafted professionally and can be altered to fit any style. Use it with Google Slides or PowerPoint. Include striking photographs, symbols, depictions, and other visuals. Fill, move around, or remove text boxes as desired. Test out color palettes and font mixtures. Edit and save your work, or work with colleagues. Download Techniques To Elevate Brand Visibility Reputation Management Dashboard To Manage Brands Status Sample PDF and observe how to make your presentation outstanding. Give an impeccable presentation to your group and make your presentation unforgettable.

Market Evaluation Customer Survey Dashboard Topics PDF
The slide showcases the dashboard showing an overview of response from market survey analysis. It includes demographic factors such as gender, age group, top languages, top interests and occupations. Showcasing this set of slides titled Market Evaluation Customer Survey Dashboard Topics PDF. The topics addressed in these templates are Gender, Age Group, Top Languages, Top Interests And Occupations. All the content presented in this PPT design is completely editable. Download it and make adjustments in color, background, font etc. as per your unique business setting.

Manufacturing Enterprise Inventory Overview Dashboard Graphics PDF
The following slide depicts the key performance areas of inventory management in a manufacturing firm. It includes KPIs such as inventory turnover ratio, out of stock rate, on time in full rate, product wise average time to sell etc. Showcasing this set of slides titled Manufacturing Enterprise Inventory Overview Dashboard Graphics PDF. The topics addressed in these templates are Turnover Analysis, Dashboard, Stock Rate. All the content presented in this PPT design is completely editable. Download it and make adjustments in color, background, font etc. as per your unique business setting.

Datafy Performance Tracking Dashboard For E-Commerce Website Information PDF
This slide represents the performance tracking dashboard for an e-commerce website by covering the details of visitors and return visitors, total customers and products, the top three products and product categories, and average visit duration and purchase per visit. The best PPT templates are a great way to save time, energy, and resources. Slidegeeks have percent editable powerpoint slides making them incredibly versatile. With these quality presentation templates, you can create a captivating and memorable presentation by combining visually appealing slides and effectively communicating your message. Download Datafy Performance Tracking Dashboard For E-Commerce Website Information PDF from Slidegeeks and deliver a wonderful presentation.
Social Media Performance Tracking And Monitoring Dashboard Information PDF
The following slide showcases a dashboard to track and measure social media platforms performance. It includes key elements such as website traffic, social media referral rate, site revenue, social media site revenue, etc. This Social Media Performance Tracking And Monitoring Dashboard Information PDF is perfect for any presentation, be it in front of clients or colleagues. It is a versatile and stylish solution for organizing your meetings. The product features a modern design for your presentation meetings. The adjustable and customizable slides provide unlimited possibilities for acing up your presentation. Slidegeeks has done all the homework before launching the product for you. So, do not wait, grab the presentation templates today
Half Yearly Content Project Plan Analysis Dashboard Ppt Icon Background Designs PDF
This slide defines the dashboard for 6 month content project plan analysis . it includes information related to the progress, risk , project summary, tasks, etc. Pitch your topic with ease and precision using this Half Yearly Content Project Plan Analysis Dashboard Ppt Icon Background Designs PDF. This layout presents information on Overall Progress, Planning, Risks. It is also available for immediate download and adjustment. So, changes can be made in the color, design, graphics or any other component to create a unique layout.
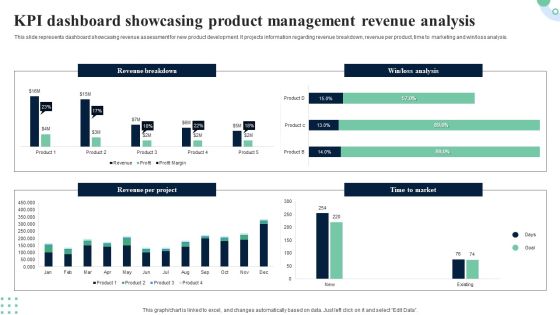
KPI Dashboard Showcasing Product Management Revenue Analysis Portrait PDF
This slide provides dashboard showcasing product development project overview with completion status. It provides information regarding cash flow statements, completion progress, project overview and product approval status. Pitch your topic with ease and precision using this KPI Dashboard Showcasing Product Management Revenue Analysis Portrait PDF. This layout presents information on Completion Progress, Product Approval Status, Cash Flow Statements. It is also available for immediate download and adjustment. So, changes can be made in the color, design, graphics or any other component to create a unique layout.
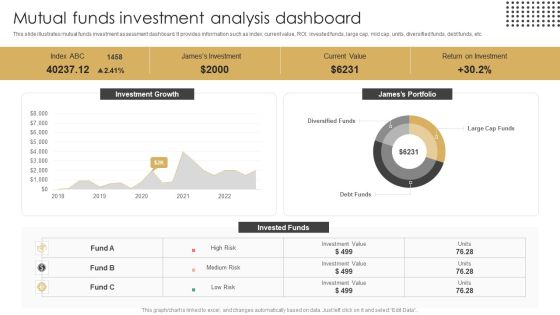
Mutual Funds Investment Analysis Dashboard Ppt Outline Background Images PDF
This slide illustrates mutual funds investment assessment dashboard. It provides information such as index, current value, ROI, invested funds, large cap, mid cap, units, diversified funds, debt funds, etc. Pitch your topic with ease and precision using this Mutual Funds Investment Analysis Dashboard Ppt Outline Background Images PDF. This layout presents information on Current Value, Return On Investment, Jamess Portfolio. It is also available for immediate download and adjustment. So, changes can be made in the color, design, graphics or any other component to create a unique layout.

How To Boost Brand Recognition Reputation Management Dashboard To Manage Brands Rules PDF
This slide provides information regarding reputation management to monitor brands status in terms of brand review summary, listing score, competition, listing accuracy, etc. Get a simple yet stunning designed How To Boost Brand Recognition Reputation Management Dashboard To Manage Brands Rules PDF. It is the best one to establish the tone in your meetings. It is an excellent way to make your presentations highly effective. So, download this PPT today from Slidegeeks and see the positive impacts. Our easy-to-edit How To Boost Brand Recognition Reputation Management Dashboard To Manage Brands Rules PDF can be your go-to option for all upcoming conferences and meetings. So, what are you waiting for Grab this template today.
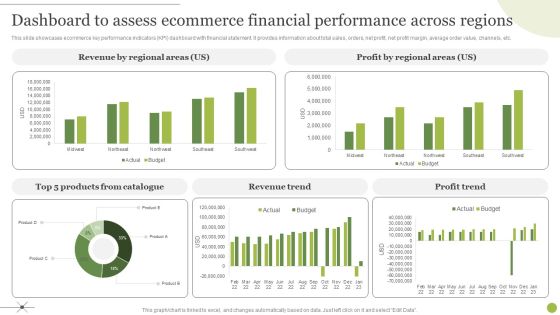
Managing E Commerce Business Accounting Dashboard To Assess Ecommerce Financial Performance Across Regions Graphics PDF
This slide showcases ecommerce key performance indicators KPI dashboard with financial statement. It provides information about total sales, orders, net profit, net profit margin, average order value, channels, etc. Do you have to make sure that everyone on your team knows about any specific topic I yes, then you should give Managing E Commerce Business Accounting Dashboard To Assess Ecommerce Financial Performance Across Regions Graphics PDF a try. Our experts have put a lot of knowledge and effort into creating this impeccable Managing E Commerce Business Accounting Dashboard To Assess Ecommerce Financial Performance Across Regions Graphics PDF. You can use this template for your upcoming presentations, as the slides are perfect to represent even the tiniest detail. You can download these templates from the Slidegeeks website and these are easy to edit. So grab these today.

BPO Managing Enterprise Financial Transactions Company Financials Dashboard Information PDF
Presenting this set of slides with name bpo managing enterprise financial transactions company financials dashboard information pdf. The topics discussed in these slides are performance, revenue, expense, profit. This is a completely editable PowerPoint presentation and is available for immediate download. Download now and impress your audience.

B2B Marketing KPI Dashboard INSIGHT Ppt Ideas Information PDF
Deliver an awe-inspiring pitch with this creative b2b marketing kpi dashboard insight ppt ideas information pdf bundle. Topics like revenue breakdown, leads region, sales reps leads, sales representatives leads actual, sales results identify individual performance can be discussed with this completely editable template. It is available for immediate download depending on the needs and requirements of the user.
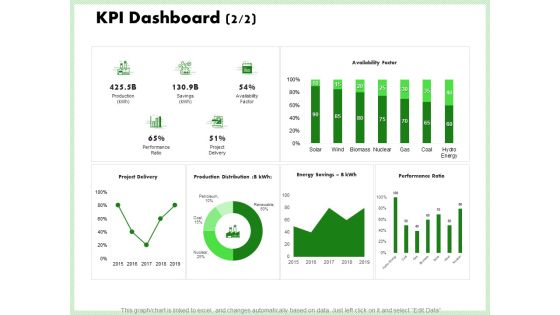
Eco Friendly And Feasibility Management KPI Dashboard Project Information PDF
Deliver and pitch your topic in the best possible manner with this eco friendly and feasibility management kpi dashboard project information pdf. Use them to share invaluable insights on 2015 to 2019, production distribution, project delivery, performance ratio, savings and impress your audience. This template can be altered and modified as per your expectations. So, grab it now.

Customer Relationship Management Dashboard CRM Assessment Cost Information PDF
Deliver and pitch your topic in the best possible manner with this customer relationship management dashboard crm assessment cost information pdf. Use them to share invaluable insights on implementation, integration, automation, customizability, customer support and impress your audience. This template can be altered and modified as per your expectations. So, grab it now.

Customer Relationship Management Dashboard Marketing Reach By Channels Information PDF
Deliver an awe inspiring pitch with this creative customer relationship management dashboard marketing reach by channels information pdf bundle. Topics like top performing channels, last years acquisition sources, non scalable channels can be discussed with this completely editable template. It is available for immediate download depending on the needs and requirements of the user.
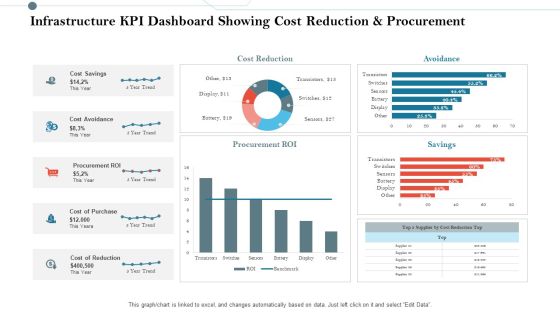
Infrastructure KPI Dashboard Showing Cost Reduction And Procurement Information PDF
Deliver an awe inspiring pitch with this creative infrastructure kpi dashboard showing cost reduction and procurement information pdf bundle. Topics like cost reduction, cost savings, cost avoidance, procurement roi, cost of purchase can be discussed with this completely editable template. It is available for immediate download depending on the needs and requirements of the user.
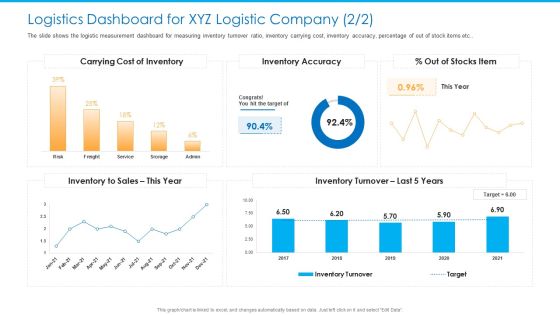
Logistics Dashboard For XYZ Logistic Company Carrying Information PDF
Deliver an awe inspiring pitch with this creative logistics dashboard for xyz logistic company carrying information pdf bundle. Topics like carrying cost of inventory, inventory to sales, inventory accuracy can be discussed with this completely editable template. It is available for immediate download depending on the needs and requirements of the user.

Automate Customer Relationship Management Agile Crm Software Dashboard Information PDF
Deliver and pitch your topic in the best possible manner with this automate customer relationship management agile crm software dashboard information pdf. Use them to share invaluable insights on my deals funnel, revenue graph and impress your audience. This template can be altered and modified as per your expectations. So, grab it now.

Metrics For Project Success Benefits And Return Of Investment Ppt PowerPoint Presentation Pictures Structure
This is a metrics for project success benefits and return of investment ppt powerpoint presentation pictures structure. This is a four stage process. The stages in this process are project dashboard, project kpis, project metrics.

Metrics In Project Management Planning Design Development Ppt PowerPoint Presentation Outline Show
This is a metrics in project management planning design development ppt powerpoint presentation outline show. This is a two stage process. The stages in this process are project dashboard, project kpis, project metrics.
Project Management Metrics And Variances Schedule Variance And Test Defect Ppt PowerPoint Presentation Icon Influencers
This is a project management metrics and variances schedule variance and test defect ppt powerpoint presentation icon influencers. This is a five stage process. The stages in this process are project dashboard, project kpis, project metrics.

Asset Assessment Dashboard With Cash Flow And Market Value Summary PDF
This slide illustrates asset valuation dashboard with key financial metrics. It provides information about cash flow, market value, intrinsic value, assumptions, market cap, discount rate, etc.Showcasing this set of slides titled Asset Assessment Dashboard With Cash Flow And Market Value Summary PDF. The topics addressed in these templates are Discount Rate, Capital Expenditure, Market Capitalization. All the content presented in this PPT design is completely editable. Download it and make adjustments in color, background, font etc. as per your unique business setting.

Table Of Contents For Developer Operations Automated Tools And Initiatives IT Infographics PDF
Presenting table of contents for developer operations automated tools and initiatives it infographics pdf to provide visual cues and insights. Share and navigate important information on seven stages that need your due attention. This template can be used to pitch topics like employee training schedule and cost, previous projects, market analysis, business performance, kpi dashboard. In addtion, this PPT design contains high resolution images, graphics, etc, that are easily editable and available for immediate download.
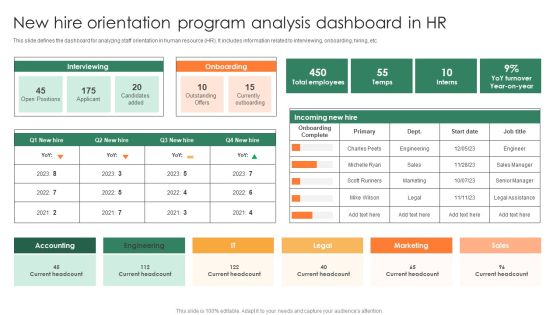
New Hire Orientation Program Analysis Dashboard In HR Clipart PDF
Pitch your topic with ease and precision using this New Hire Orientation Program Analysis Dashboard In HR Clipart PDF. This layout presents information on Currently Outboarding, Current Headcount, Onboarding Complete. It is also available for immediate download and adjustment. So, changes can be made in the color, design, graphics or any other component to create a unique layout.
Structural Diagram For Exchanging Information Circular Flow Layout Network PowerPoint Slides
We present our structural diagram for exchanging information Circular Flow Layout Network PowerPoint Slides.Download and present our Arrows PowerPoint Templates because Our PowerPoint Templates and Slides team portray an attitude of elegance. Personify this quality by using them regularly. Use our Business PowerPoint Templates because it illustrates the city with a lasting tryst with resilience. You epitomise the qualities that give your city its fame. Present our Marketing PowerPoint Templates because you have a good grasp of the essentials of such a venture. Alternate energy presents an array of opportunities. Use our Leadership PowerPoint Templates because it helps you to satiate the brains of your team with a taste of the final product. Download our Shapes PowerPoint Templates because you can Inform your team of the various means they have to achieve them.Use these PowerPoint slides for presentations relating to Abstract, Action, Attach, Box, Business, Center, Chain, Chart, Color, Communication, Concept, Connection, Cube, Cycle, Data, Diagram, Flow, Globe, Horizontal, Idea, Illustration, Information, Interaction, Jigsaw, Join, Link, Pieces, Process, Puzzle, Relation, Relationship, Shape, Success. The prominent colors used in the PowerPoint template are Red, Green, Gray. We assure you our structural diagram for exchanging information Circular Flow Layout Network PowerPoint Slides will impress their bosses and teams. Customers tell us our Chain PowerPoint templates and PPT Slides are Lush. The feedback we get is that our structural diagram for exchanging information Circular Flow Layout Network PowerPoint Slides are Fancy. We assure you our Center PowerPoint templates and PPT Slides are Vintage. People tell us our structural diagram for exchanging information Circular Flow Layout Network PowerPoint Slides are Precious. We assure you our Attach PowerPoint templates and PPT Slides are Clever.
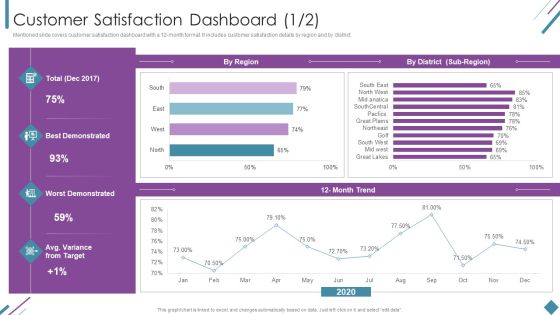
Metrics To Measure Business Performance Customer Satisfaction Dashboard Summary PDF
Mentioned slide covers customer satisfaction dashboard with a 12-month format. It includes customer satisfaction details by region and by district. Deliver an awe inspiring pitch with this creative Metrics To Measure Business Performance Customer Satisfaction Dashboard Summary PDF bundle. Topics like Best Demonstrated, Worst Demonstrated, 2020 can be discussed with this completely editable template. It is available for immediate download depending on the needs and requirements of the user.

Metrics To Measure Business Performance Profit Margin Dashboard Designs PDF
Following slide illustrates profit margin dashboard with a 12 months format. It also includes gross profit margin, operating profit margin and net profit margin. Deliver and pitch your topic in the best possible manner with this Metrics To Measure Business Performance Profit Margin Dashboard Designs PDF. Use them to share invaluable insights on Gross Profit Margin, Operating Profit Margin, Net Profit Margin and impress your audience. This template can be altered and modified as per your expectations. So, grab it now.

Email Marketing Campaign Outcomes And Social Media Marketing Result Analysis Dashboard Mockup PDF
This slide depicts the dashboard for analyzing the results of email campaign and social media marketing. It includes information related to the comparison, statistics, usage, etc. Pitch your topic with ease and precision using this Email Marketing Campaign Outcomes And Social Media Marketing Result Analysis Dashboard Mockup PDF. This layout presents information on Email Marketing Campaign, Outcomes And Social Media, Marketing Result, Analysis Dashboard. It is also available for immediate download and adjustment. So, changes can be made in the color, design, graphics or any other component to create a unique layout.

Performance Monitor Dashboard Infographic With Rating Ppt PowerPoint Presentation File Design Templates PDF
Showcasing this set of slides titled performance monitor dashboard infographic with rating ppt powerpoint presentation file design templates pdf. The topics addressed in these templates are performance monitor dashboard infographic with rating. All the content presented in this PPT design is completely editable. Download it and make adjustments in color, background, font etc. as per your unique business setting.
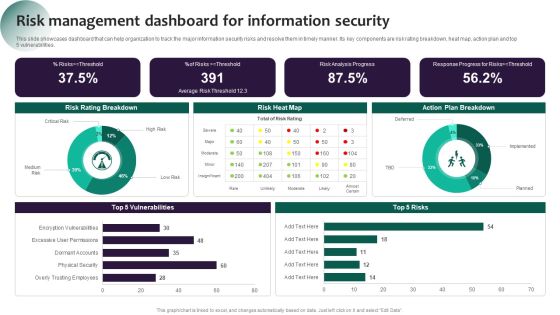
Information Systems Security And Risk Management Plan Risk Management Dashboard For Information Security Pictures PDF
This slide showcases dashboard that can help organization to track the major information security risks and resolve them in timely manner. Its key components are risk rating breakdown, heat map, action plan and top 5 vulnerabilities. The best PPT templates are a great way to save time, energy, and resources. Slidegeeks have 100 percent editable powerpoint slides making them incredibly versatile. With these quality presentation templates, you can create a captivating and memorable presentation by combining visually appealing slides and effectively communicating your message. Download Information Systems Security And Risk Management Plan Risk Management Dashboard For Information Security Pictures PDF from Slidegeeks and deliver a wonderful presentation.

Project Delivery Method Dashboard With Service Level Agreement Status Clipart PDF
This slide outlines KPI dashboard which cover details of project delivery metrics. The metrics covered in the dashboard are total investment, revenue generated, total days spent on projects, service level agreement status by individual project etc. Pitch your topic with ease and precision using this project delivery method dashboard with service level agreement status clipart pdf. This layout presents information on project delivery method dashboard with service level agreement status. It is also available for immediate download and adjustment. So, changes can be made in the color, design, graphics or any other component to create a unique layout.
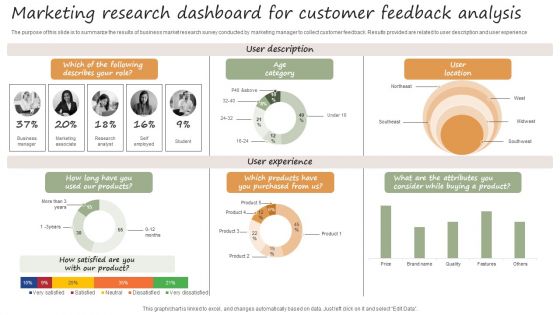
Marketing Research Dashboard For Customer Feedback Analysis Introduction PDF
The purpose of this slide is to summarize the results of business market research survey conducted by marketing manager to collect customer feedback. Results provided are related to user description and user experience. Showcasing this set of slides titled Marketing Research Dashboard For Customer Feedback Analysis Introduction PDF. The topics addressed in these templates are Age Category, User Location, User Experience . All the content presented in this PPT design is completely editable. Download it and make adjustments in color, background, font etc. as per your unique business setting.

5G And 4G Networks Comparative Analysis Performance Tracking Dashboard For 5G Technology Designs PDF
This slide describes the performance tracking dashboard for 5G technology by covering the details of subscribers, QoE, consumption, customer support, coverage, devices, and dimensions. Deliver an awe inspiring pitch with this creative 5G And 4G Networks Comparative Analysis Performance Tracking Dashboard For 5G Technology Designs PDF bundle. Topics like Consumption, Customer Support, Quality can be discussed with this completely editable template. It is available for immediate download depending on the needs and requirements of the user.
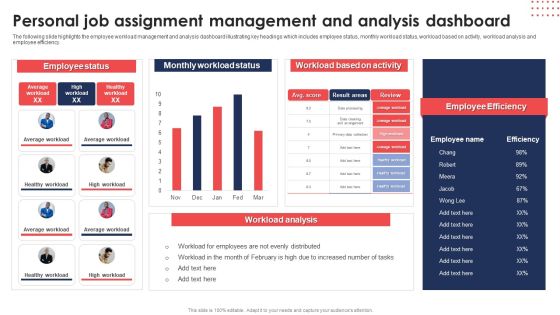
Personal Job Assignment Management And Analysis Dashboard Diagrams PDF
The following slide highlights the employee workload management and analysis dashboard illustrating key headings which includes employee status, monthly workload status, workload based on activity, workload analysis and employee efficiency. Pitch your topic with ease and precision using thisPersonal Job Assignment Management And Analysis Dashboard Diagrams PDF. This layout presents information on Employee Status, Monthly Workload Status, Workload Based Activity. It is also available for immediate download and adjustment. So, changes can be made in the color, design, graphics or any other component to create a unique layout.

Medical Administration Analysis With KPI Dashboard Clipart PDF
The following slide depicts the KPAs of medical and healthcare administration to manage and remit services. It includes KPIs such as numbers of doctors, numbers of patients, monthly patient analysis, upcoming appointments etc. Showcasing this set of slides titled Medical Administration Analysis With KPI Dashboard Clipart PDF. The topics addressed in these templates are Patient Analysis, Higher Than, Upcoming Appointments. All the content presented in this PPT design is completely editable. Download it and make adjustments in color, background, font etc. as per your unique business setting.
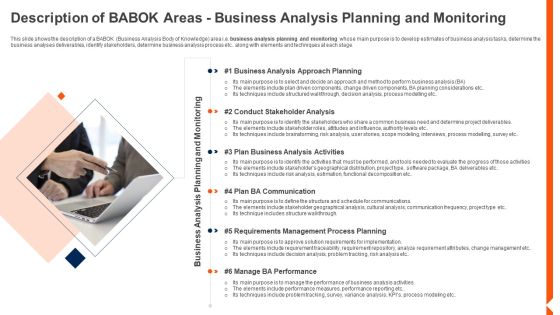
Solution Monitoring Verification Description BABOK Business Analysis Planning Guidelines PDF
This slide shows the description of a BABOK Business Analysis Body of Knowledge area i.e. business analysis planning and monitoring whose main purpose is to develop estimates of business analysis tasks, determine the business analyses deliverables, identify stakeholders, determine business analysis process etc. along with elements and techniques at each stage. This is a solution monitoring verification description babok business analysis planning guidelines pdf template with various stages. Focus and dispense information on six stages using this creative set, that comes with editable features. It contains large content boxes to add your information on topics like business, analysis, activities. You can also showcase facts, figures, and other relevant content using this PPT layout. Grab it now.

Quarterly Marketing Performance Review Kpis Background PDF
The given below slide highlights the marketing insights to maximize the performance. It includes KPIs such as total marketing expenditure compared to target budget, total impressions, clicks, acquisitions, cost per acquisition etc. Showcasing this set of slides titled Quarterly Marketing Performance Review Kpis Background PDF. The topics addressed in these templates are Total Acquisitions, Cost Per Acquisition, Marketing Expenditure. All the content presented in this PPT design is completely editable. Download it and make adjustments in color, background, font etc. as per your unique business setting.

9 Steps Diverging Concepts Leading To One Issue Circular Network PowerPoint Slides
We present our 9 steps diverging concepts leading to one issue Circular Network PowerPoint Slides.Download and present our Circle charts PowerPoint Templates because Our PowerPoint Templates and Slides help you meet the demand of the Market. Just browse and pick the slides that appeal to your intuitive senses. Use our Shapes PowerPoint Templates because spreading the light of knowledge around you will clear the doubts and enlighten the questioning minds with your brilliance and ability. Use our Ring charts PowerPoint Templates because it have all to represent to your viewers. Present our Process and Flows PowerPoint Templates because this slide is Designed to help bullet-point your views and thoughts. Download our Signs PowerPoint Templates because the world over it is a priority for many. Along with it there are so many oppurtunities waiting to be utilised.Use these PowerPoint slides for presentations relating to Business, chart, circle, colors, concept, corporate, cycle, data, design, detail, development, diagram, engineering, graphic, ideas, illustration, image, implement, implementation, life, lifecycle, management, model, objects, organization, plan, process, product, professional, project, quality, schema, shape, stack, stage, steps, strategy, structure, success, symbol. The prominent colors used in the PowerPoint template are Orange, Gray, White. You can be sure our 9 steps diverging concepts leading to one issue Circular Network PowerPoint Slides are Wonderful. Presenters tell us our cycle PowerPoint templates and PPT Slides are Bright. We assure you our 9 steps diverging concepts leading to one issue Circular Network PowerPoint Slides provide you with a vast range of viable options. Select the appropriate ones and just fill in your text. Customers tell us our circle PowerPoint templates and PPT Slides are Festive. Presenters tell us our 9 steps diverging concepts leading to one issue Circular Network PowerPoint Slides help you meet deadlines which are an element of today's workplace. Just browse and pick the slides that appeal to your intuitive senses. You can be sure our design PowerPoint templates and PPT Slides are Playful.
Logistics Kpis And Metrics Percentage Of Orders Delivered Ppt PowerPoint Presentation Icon
This is a logistics kpis and metrics percentage of orders delivered ppt powerpoint presentation icon. This is a five stage process. The stages in this process are logistics performance, logistics dashboard, logistics kpis.
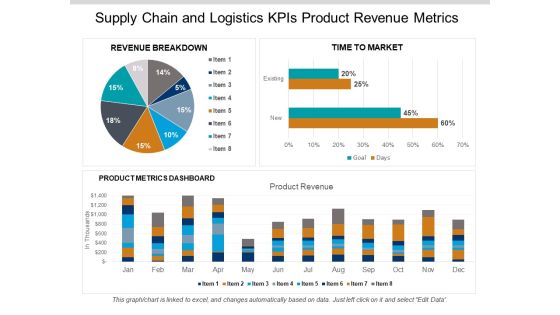
Supply Chain And Logistics Kpis Product Revenue Metrics Ppt PowerPoint Presentation Gallery Aids
This is a supply chain and logistics kpis product revenue metrics ppt powerpoint presentation gallery aids. This is a three stage process. The stages in this process are logistics performance, logistics dashboard, logistics kpis.
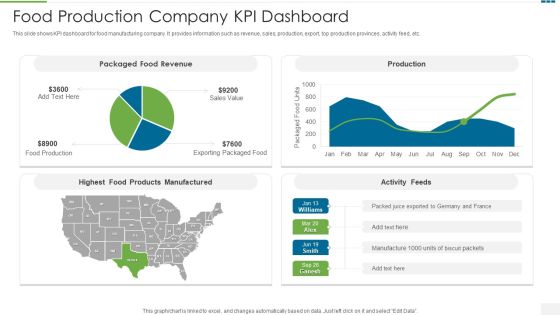
Food Production Company KPI Dashboard Formats PDF
This slide shows KPI dashboard for food manufacturing company. It provides information such as revenue, sales, production, export, top production provinces, activity feed, etc.Showcasing this set of slides titled food production company kpi dashboard formats pdf The topics addressed in these templates are food production company kpi dashboard All the content presented in this PPT design is completely editable. Download it and make adjustments in color, background, font etc. as per your unique business setting.

Client Solution Service Kpi Dashboard Sample PDF
This slide depicts service team KPI dashboard for providing customer solutions. It provides information about incoming cases, solutions provided, escalations, resolution time, case priority, etc. Showcasing this set of slides titled Client Solution Service Kpi Dashboard Sample PDF. The topics addressed in these templates are Client Solution Service KPI Dashboard. All the content presented in this PPT design is completely editable. Download it and make adjustments in color, background, font etc. as per your unique business setting
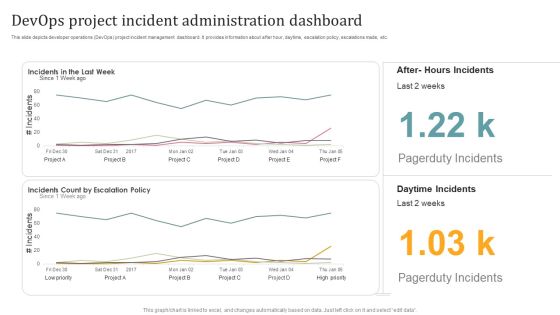
Devops Project Incident Administration Dashboard Diagrams PDF
This slide depicts developer operations DevOps project incident management dashboard. It provides information about after hour, daytime, escalation policy, escalations made, etc. Showcasing this set of slides titled Devops Project Incident Administration Dashboard Diagrams PDF. The topics addressed in these templates are Devops Project Incident, Administration Dashboard. All the content presented in this PPT design is completely editable. Download it and make adjustments in color, background, font etc. as per your unique business setting.

Dashboard Depicting Macroeconomic Analysis With Population Inspiration PDF
This slide shows the dashboard that depicts the macroeconomic analysis which includes population, gross domestic product, GDP per capita, poverty rate, literacy rate verses internet usage of four different countries and FDI inflow, etc. Pitch your topic with ease and precision using this Dashboard Depicting Macroeconomic Analysis With Population Inspiration PDF. This layout presents information on Poverty Rate, Literacy Rate Vs Internet Usages, FDI Inflow In 2022. It is also available for immediate download and adjustment. So, changes can be made in the color, design, graphics or any other component to create a unique layout.

Revenue And Customer Acquisition Analysis Strategic Administration Dashboard Clipart PDF
This slide shows the dashboard representing analysis of the revenue and customers acquired by the organization. It shows comparison between current and previous year revenue and customer acquisition.Pitch your topic with ease and precision using this Revenue And Customer Acquisition Analysis Strategic Administration Dashboard Clipart PDF This layout presents information on Revenue Customer, Compared Previous, Customer Acquisition It is also available for immediate download and adjustment. So, changes can be made in the color, design, graphics or any other component to create a unique layout.

IT Project Change Management Operations Analysis Dashboard Infographics PDF
This slide shows the dashboard representing the operational analysis related to change management of an IT project. It shows details related to top requesting groups, outstanding change requests, outstanding age breakdown etc.Pitch your topic with ease and precision using this IT Project Change Management Operations Analysis Dashboard Infographics PDF. This layout presents information on Outstanding Requests, Outstanding Breakdown, Outstanding Changes. It is also available for immediate download and adjustment. So, changes can be made in the color, design, graphics or any other component to create a unique layout.
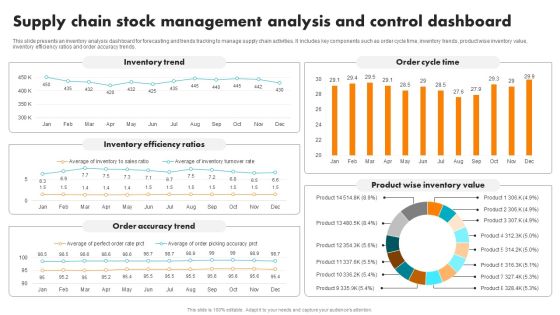
Supply Chain Stock Management Analysis And Control Dashboard Brochure PDF
This slide presents an inventory analysis dashboard for forecasting and trends tracking to manage supply chain activities. It includes key components such as order cycle time, inventory trends, product wise inventory value, inventory efficiency ratios and order accuracy trends. Pitch your topic with ease and precision using this Supply Chain Stock Management Analysis And Control Dashboard Brochure PDF. This layout presents information on Inventory Trend, Inventory Efficiency Ratios, Order Accuracy Trend, Order Cycle Time, Product Wise Inventory Value. It is also available for immediate download and adjustment. So, changes can be made in the color, design, graphics or any other component to create a unique layout.
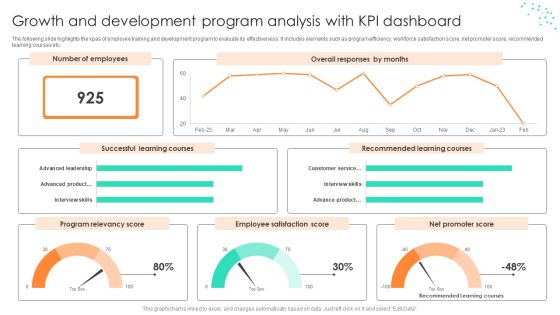
Growth And Development Program Analysis With KPI Dashboard Structure PDF
The following slide highlights the kpas of employee training and development program to evaluate its effectiveness. It includes elements such as program efficiency, workforce satisfaction score, net promoter score, recommended learning courses etc. Pitch your topic with ease and precision using this Growth And Development Program Analysis With KPI Dashboard Structure PDF. This layout presents information on Analysis With KPI Dashboard, Growth And Development Program. It is also available for immediate download and adjustment. So, changes can be made in the color, design, graphics or any other component to create a unique layout.
Financial Performance Tracking Dashboard Themes PDF
This slide presents the dashboard which will help firm in tracking the fiscal performance. This dashboard displays revenues and expenses trends and payment received analysis. There are so many reasons you need a Financial Performance Tracking Dashboard Themes PDF. The first reason is you can not spend time making everything from scratch, Thus, Slidegeeks has made presentation templates for you too. You can easily download these templates from our website easily.
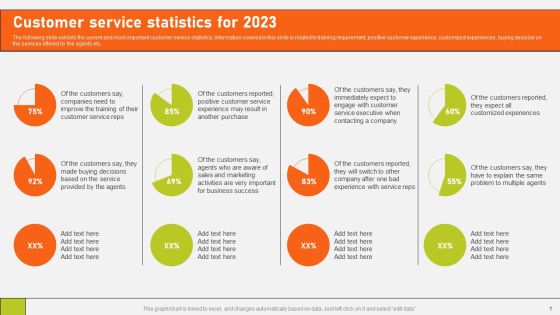
Securing Market Leadership Through Competitive Excellence Customer Service Statistics For 2023 Infographics PDF
The following slide exhibits the current and most important customer service statistics. Information covered in this slide is related to training requirement, positive customer experience, customized experiences, buying decision on the services offered by the agents etc. From laying roadmaps to briefing everything in detail, our templates are perfect for you. You can set the stage with your presentation slides. All you have to do is download these easy to edit and customizable templates. Securing Market Leadership Through Competitive Excellence Customer Service Statistics For 2023 Infographics PDF will help you deliver an outstanding performance that everyone would remember and praise you for. Do download this presentation today.
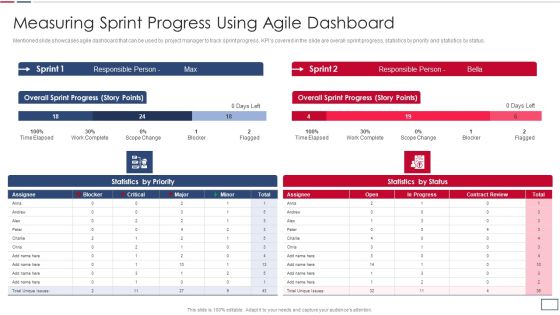
Software Developer Playbook Measuring Sprint Progress Using Agile Dashboard Formats PDF
Mentioned slide showcases agile dashboard that can be used by project manager to track sprint progress. KPIs covered in the slide are overall sprint progress, statistics by priority and statistics by status. Deliver an awe inspiring pitch with this creative software developer playbook measuring sprint progress using agile dashboard formats pdf bundle. Topics like overall sprint progress, statistics by priority can be discussed with this completely editable template. It is available for immediate download depending on the needs and requirements of the user.

Information Technology Expenditure Summary Dashboard Ppt PowerPoint Presentation Diagram Graph Charts PDF
The following slide showcases the cyber security expense overview to better allocate budget. It includes elements such as IT cost, revenue, security incidents, services down, issue status summary, total business hours lost etc. This Information Technology Expenditure Summary Dashboard Ppt PowerPoint Presentation Diagram Graph Charts PDF from Slidegeeks makes it easy to present information on your topic with precision. It provides customization options, so you can make changes to the colors, design, graphics, or any other component to create a unique layout. It is also available for immediate download, so you can begin using it right away. Slidegeeks has done good research to ensure that you have everything you need to make your presentation stand out. Make a name out there for a brilliant performance.

Supply Chain Strategic Planning KPI Dashboard Depicting Inventory And Costs Template PDF
This slide delineates supply planning key performance indicator kpi dashboard depicting inventory and costs which can assist logistics manager in determining demand and supply of products. It includes information about transaction based on units, out of stock products, inventory turnover and month to date expenditures. Showcasing this set of slides titled Supply Chain Strategic Planning KPI Dashboard Depicting Inventory And Costs Template PDF. The topics addressed in these templates are Transaction Based Units, 2016 To 2022. All the content presented in this PPT design is completely editable. Download it and make adjustments in color, background, font etc. as per your unique business setting.

Review And Improve Pipeline Management Sales Funnel Management Strategies To Increase Sales Download PDF
This slide shows the major strategies that helps in improving sales pipeline management. Major strategies included in this slide are Keep CRM Accurate, clearly defined sales process, deliver value at each stage etc.This is a Review And Improve Pipeline Management Sales Funnel Management Strategies To Increase Sales Download PDF template with various stages. Focus and dispense information on four stages using this creative set, that comes with editable features. It contains large content boxes to add your information on topics like Logging Interactions, Missing Information, Creating Dashboards. You can also showcase facts, figures, and other relevant content using this PPT layout. Grab it now.

Quality Control Dashboard Ppt PowerPoint Presentation Visual Aids Summary PDF
Following slide shows quality control dashboard covering target and measurement percentage of process under control. It also includes statistics of number of defects per lot, corrective actions and cost of quantity.Deliver an awe-inspiring pitch with this creative quality control dashboard ppt powerpoint presentation visual aids summary pdf. bundle. Topics like process under control, cost of quality, target can be discussed with this completely editable template. It is available for immediate download depending on the needs and requirements of the user.
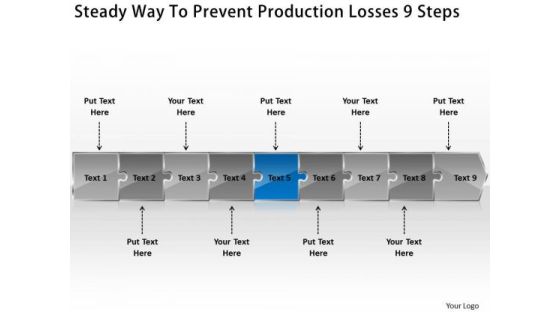
Steady Way To Prevent Production Losses 9 Steps What Is Flow Chart Used For PowerPoint Slides
We present our steady way to prevent production losses 9 steps what is flow chart used for PowerPoint Slides.Use our Arrows PowerPoint Templates because,you have the ability to judge Which out of late have been proving to be a hassle. Use our Leadership PowerPoint Templates because,This diagram can be used to illustrate the logical path or system Use our Business PowerPoint Templates because, A brainwave has occurred to you after review. You know just how to push the graph skyward Use our Symbol PowerPoint Templates because,This one depicts the popular chart. Use our Process and Flows PowerPoint Templates because,Your business and plans for its growth consist of processes that are highly co-related.Use these PowerPoint slides for presentations relating to Abstract, Action, Attach, Box, Business, Center, Chain, Chart, Color, Communication, Concept, Connection, Cube, Cycle, Data, Diagram, Flow, Globe, Horizontal, Idea, Illustration, Information, Interaction, Jigsaw, Join, Link, Pieces, Process, Puzzle, Relation, Relationship, Shape, Success. The prominent colors used in the PowerPoint template are Blue, Black, Gray. People tell us our steady way to prevent production losses 9 steps what is flow chart used for PowerPoint Slides are Royal. PowerPoint presentation experts tell us our Chart PowerPoint templates and PPT Slides are Great. PowerPoint presentation experts tell us our steady way to prevent production losses 9 steps what is flow chart used for PowerPoint Slides are Graceful. Professionals tell us our Center PowerPoint templates and PPT Slides are Amazing. Professionals tell us our steady way to prevent production losses 9 steps what is flow chart used for PowerPoint Slides are readymade to fit into any presentation structure. People tell us our Business PowerPoint templates and PPT Slides are Glamorous.
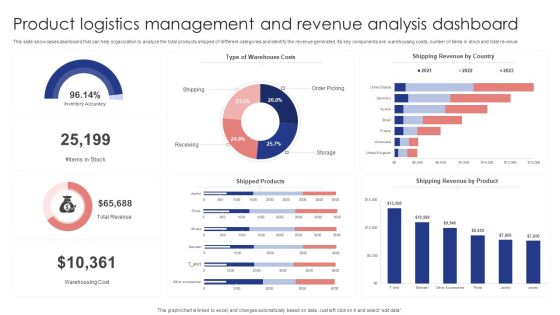
Product Logistics Management And Revenue Analysis Dashboard Demonstration PDF
This slide showcases dashboard that can help organization to analyze the total products shipped of different categories and identify the revenue generated. Its key components are warehousing costs, number of items in stock and total revenue. Pitch your topic with ease and precision using this Product Logistics Management And Revenue Analysis Dashboard Demonstration PDF. This layout presents information on Warehouse Costs, Shipping Revenue Country, Shipped Products . It is also available for immediate download and adjustment. So, changes can be made in the color, design, graphics or any other component to create a unique layout.
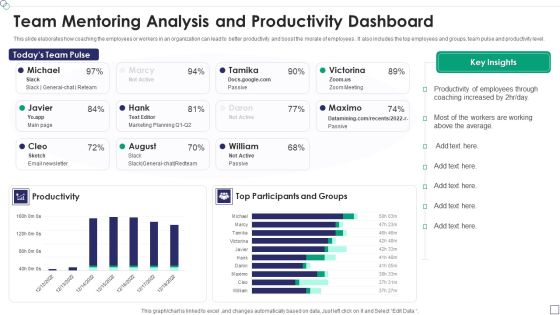
Team Mentoring Analysis And Productivity Dashboard Template PDF
This slide elaborates how coaching the employees or workers in an organization can lead to better productivity and boost the morale of employees . It also includes the top employees and groups, team pulse and productivity level.Showcasing this set of slides titled Team Mentoring Analysis And Productivity Dashboard Template PDF The topics addressed in these templates are Productivity Of Employees, Coaching Increased, Productivity All the content presented in this PPT design is completely editable. Download it and make adjustments in color, background, font etc. as per your unique business setting.
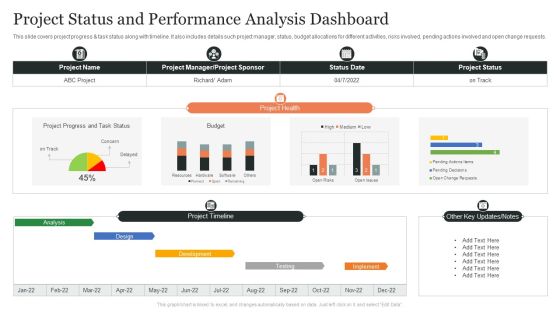
Project Status And Performance Analysis Dashboard Ppt Slides Brochure PDF
This slide covers project progress and task status along with timeline. It also includes details such project manager, status, budget allocations for different activities, risks involved, pending actions involved and open change requests. Showcasing this set of slides titled Project Status And Performance Analysis Dashboard Ppt Slides Brochure PDF. The topics addressed in these templates are Project Health, Design, Project Timeline, Other Key Updates, Notes. All the content presented in this PPT design is completely editable. Download it and make adjustments in color, background, font etc. as per your unique business setting.
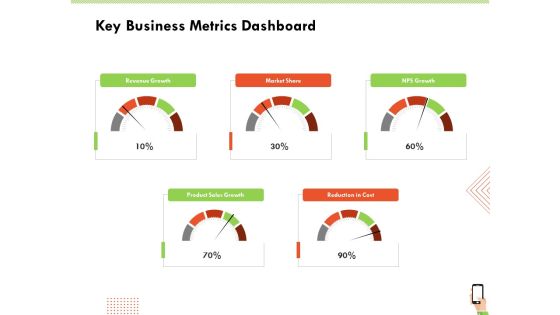
Multi Channel Online Commerce Key Business Metrics Dashboard Background PDF
Deliver and pitch your topic in the best possible manner with this multi channel online commerce key business metrics dashboard background pdf. Use them to share invaluable insights on revenue, market, sales, growth, cost and impress your audience. This template can be altered and modified as per your expectations. So, grab it now.
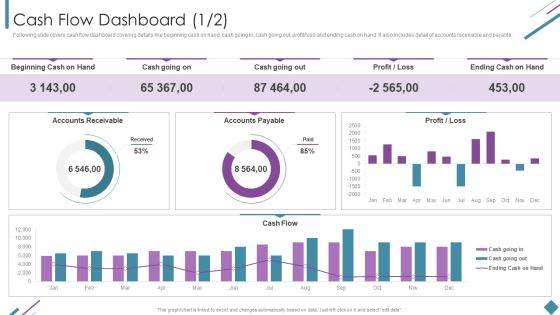
Metrics To Measure Business Performance Cash Flow Dashboard Rules PDF
Following slide covers cash flow dashboard covering details like beginning cash on hand, cash going in, cash going out, profit or loss and ending cash on hand. It also includes detail of accounts receivable and payable. Deliver an awe inspiring pitch with this creative Metrics To Measure Business Performance Cash Flow Dashboard Rules PDF bundle. Topics like Beginning Cash Hand, Cash Going Out, Accounts Payable, Accounts Receivable can be discussed with this completely editable template. It is available for immediate download depending on the needs and requirements of the user.
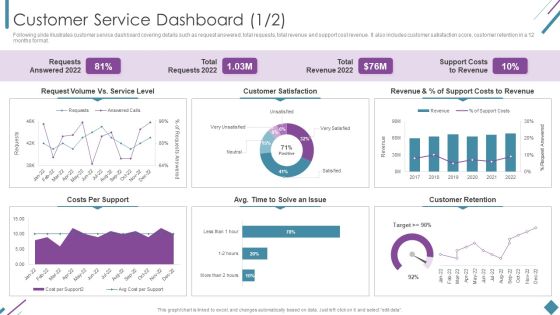
Metrics To Measure Business Performance Customer Service Dashboard Sample PDF
Following slide illustrates customer service dashboard covering details such as request answered, total requests, total revenue and support cost revenue. It also includes customer satisfaction score, customer retention in a 12 months format. Deliver and pitch your topic in the best possible manner with this Metrics To Measure Business Performance Customer Service Dashboard Sample PDF. Use them to share invaluable insights on Requests Answered 2022, Total Requests 2022, Total Revenue 2022 and impress your audience. This template can be altered and modified as per your expectations. So, grab it now.

Customer Support Services Customer Support Service Analysis Dashboard Rules PDF
This slide exhibits customer service dashboard to improve visibility. The dashboard includes resolved and active cases, incoming cases by subject, priority, SLA status and age, CSAT and escalated case volume. Make sure to capture your audiences attention in your business displays with our gratis customizable Customer Support Services Customer Support Service Analysis Dashboard Rules PDF. These are great for business strategies, office conferences, capital raising or task suggestions. If you desire to acquire more customers for your tech business and ensure they stay satisfied, create your own sales presentation with these plain slides.

Building Projects Risk Landscape Vendor Supplier Analysis Dashboard Guidelines PDF
Here in this slide we include Dashboard covering supplier order value, defect rate, and quality score for making decisions regarding supplier selection. Deliver and pitch your topic in the best possible manner with this building projects risk landscape vendor supplier analysis dashboard guidelines pdf. Use them to share invaluable insights on vendor supplier analysis dashboard and impress your audience. This template can be altered and modified as per your expectations. So, grab it now.
Weekly Customer Grievance Tracking Dashboard Designs PDF
This slide showcases dashboard that can help organization to identify the open and overdue status of customer grievance . It can guide managers to resolve the complaints and issues within stipulated time for customer satisfaction. Pitch your topic with ease and precision using this Weekly Customer Grievance Tracking Dashboard Designs PDF. This layout presents information on Average, Traffic Analysis, Customer Satisfaction Ratings. It is also available for immediate download and adjustment. So, changes can be made in the color, design, graphics or any other component to create a unique layout.

Media Advertising Youtube Video Ads Performance Dashboard Information PDF
This slide shows the campaign performance in terms of total number of views, traffic sources, likes, comments and shares. The best PPT templates are a great way to save time, energy, and resources. Slidegeeks have 100 percent editable powerpoint slides making them incredibly versatile. With these quality presentation templates, you can create a captivating and memorable presentation by combining visually appealing slides and effectively communicating your message. Download Media Advertising Youtube Video Ads Performance Dashboard Information PDF from Slidegeeks and deliver a wonderful presentation.
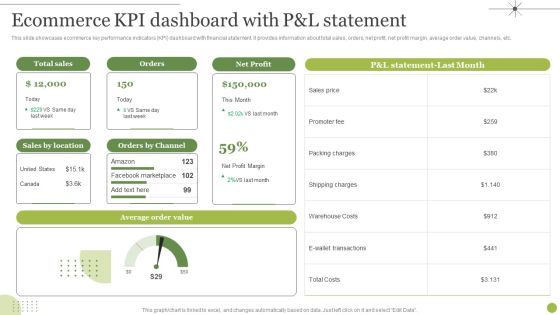
Managing E Commerce Business Accounting Ecommerce KPI Dashboard With P And L Statement Diagrams PDF
This slide showcases ecommerce key performance indicators KPI dashboard with financial statement. It provides information about total sales, orders, net profit, net profit margin, average order value, channels, etc. Present like a pro with Managing E Commerce Business Accounting Ecommerce KPI Dashboard With P And L Statement Diagrams PDF Create beautiful presentations together with your team, using our easy to use presentation slides. Share your ideas in real time and make changes on the fly by downloading our templates. So whether you are in the office, on the go, or in a remote location, you can stay in sync with your team and present your ideas with confidence. With Slidegeeks presentation got a whole lot easier. Grab these presentations today.

Performance Kpi Dashboard To Evaluate Social Mediaoptimizing Business Processes Through Automation Slides PDF
The following slide outlines key performance indicator KPI dashboard which can be used to track the social media marketing campaign performance, post implementing automation. It covers information about the social media followers, page impressions, Instagram overview, etc.Present like a pro with Performance Kpi Dashboard To Evaluate Social Mediaoptimizing Business Processes Through Automation Slides PDF Create beautiful presentations together with your team, using our easy to use presentation slides. Share your ideas in real time and make changes on the fly by downloading our templates. So whether you are in the office, on the go, or in a remote location, you can stay in sync with your team and present your ideas with confidence. With Slidegeeks presentation got a whole lot easier. Grab these presentations today.

Customer Analysis Dashboard For Measuring Satisfaction Enhancement Microsoft PDF
This slide defines the CSAT customer satisfaction score used to analyze customer experience on digital platforms. It includes information related to features and the improvement score compared to past year. Pitch your topic with ease and precision using this Customer Analysis Dashboard For Measuring Satisfaction Enhancement Microsoft PDF. This layout presents information on Net Promoter, Customer Satisfaction, Very Unsatisfied. It is also available for immediate download and adjustment. So, changes can be made in the color, design, graphics or any other component to create a unique layout.

Essential Key Performance Indicators In Investment Summary Demonstration PDF
The following slide showcases dashboard of portfolio summary with important key performance indicators to provide an oversight of the project. Key metrics covered are cost, work, variance, active risk and issues. Showcasing this set of slides titled Essential Key Performance Indicators In Investment Summary Demonstration PDF. The topics addressed in these templates are Cost, Active Risks, Projects. All the content presented in this PPT design is completely editable. Download it and make adjustments in color, background, font etc. as per your unique business setting.
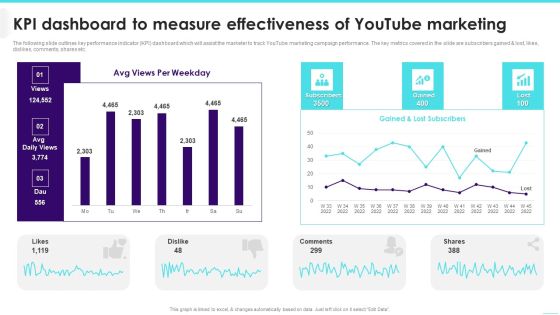
KPI Dashboard To Measure Effectiveness Of Youtube Marketing Inspiration PDF
The following slide outlines key performance indicator KPI dashboard which will assist the marketer to track YouTube marketing campaign performance. The key metrics covered in the slide are subscribers gained lost, likes, dislikes, comments, shares etc.Deliver an awe inspiring pitch with this creative KPI Dashboard To Measure Effectiveness Of Youtube Marketing Inspiration PDF bundle. Topics like Lost Subscribers, Comments, Per Weekday can be discussed with this completely editable template. It is available for immediate download depending on the needs and requirements of the user.

Enterprise Risk Management Credit Risk Management KPI Dashboard Introduction PDF
This slide represents the key metrics dashboard representing the management of credit risks by the organization. It includes details related to key risk indicators, exposure by credit rating, sectors etc. Present like a pro with Enterprise Risk Management Credit Risk Management KPI Dashboard Introduction PDF Create beautiful presentations together with your team, using our easy-to-use presentation slides. Share your ideas in real-time and make changes on the fly by downloading our templates. So whether youre in the office, on the go, or in a remote location, you can stay in sync with your team and present your ideas with confidence. With Slidegeeks presentation got a whole lot easier. Grab these presentations today.

Cross Border Integration In Multinational Corporation Global Coordination Dashboard Cloud Formats PDF
This slide provides information regarding the dashboard that contains indicators to determine the coordination activities in various dispersed facilities in different regions across the globe. Deliver an awe-inspiring pitch with this creative cross border integration in multinational corporation global coordination dashboard cloud formats pdf bundle. Topics like project, cloud space, philip armstrong, cloud storage, upgrade storage can be discussed with this completely editable template. It is available for immediate download depending on the needs and requirements of the user.

Cross Border Integration In Multinational Corporation Global Coordination Dashboard Limit Ideas PDF
This slide provides information regarding the dashboard that contains indicators to determine the coordination activities in various dispersed facilities in different regions across the globe. Deliver an awe-inspiring pitch with this creative cross border integration in multinational corporation global coordination dashboard limit ideas pdf bundle. Topics like avg delivery time days, on time shipping , shipments country can be discussed with this completely editable template. It is available for immediate download depending on the needs and requirements of the user.
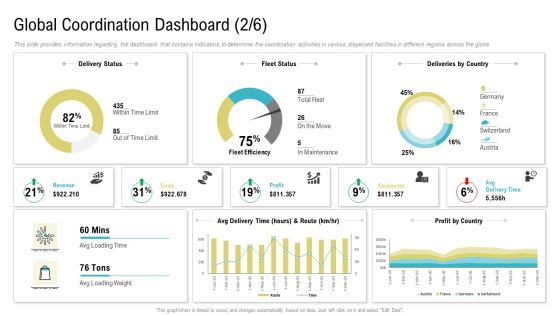
Global Coordination Dashboard Deliveries By Country Ppt Gallery File Formats PDF
This slide provides information regarding the dashboard that contains indicators to determine the coordination activities in various dispersed facilities in different regions across the globe.Deliver and pitch your topic in the best possible manner with this global coordination dashboard deliveries by country ppt gallery file formats pdf. Use them to share invaluable insights on revenue, costs, profit, shipments and impress your audience. This template can be altered and modified as per your expectations. So, grab it now.
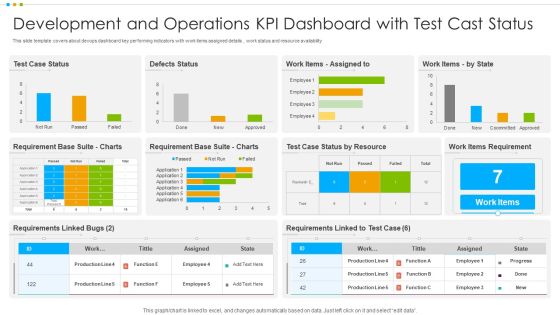
Development And Operations KPI Dashboard With Test Cast Status Graphics PDF
This slide template covers about devops dashboard key performing indicators with work items assigned details , work status and resource availability.Pitch your topic with ease and precision using this Development And Operations KPI Dashboard With Test Cast Status Graphics PDF This layout presents information on Items Requirement, Requirement Base, Assigned It is also available for immediate download and adjustment. So, changes can be made in the color, design, graphics or any other component to create a unique layout.

Communication Barriers Manager Dashboard For Analyzing Ppt PowerPoint Presentation Inspiration Grid PDF
This slide represents the dashboard of communication manager. It includes KPIs such as current conversation, performance, customers and opportunities.Pitch your topic with ease and precision using this Communication Barriers Manager Dashboard For Analyzing Ppt PowerPoint Presentation Inspiration Grid PDF. This layout presents information on Current Conversation, Economic Indicator, Conversation Calls. It is also available for immediate download and adjustment. So, changes can be made in the color, design, graphics or any other component to create a unique layout.
 Home
Home