Data Report

KPI Metrics Dashboard Highlighting Employee Retention Rate Structure PDF
The purpose of this slide is to exhibit a key performance indicator KPI dashboard through which managers can analyze the monthly employee retention rate. The metrics covered in the slide are active employees, new candidates hired, internal, exit, employee turnover rate, etc. Do you have to make sure that everyone on your team knows about any specific topic I yes, then you should give KPI Metrics Dashboard Highlighting Employee Retention Rate Structure PDF a try. Our experts have put a lot of knowledge and effort into creating this impeccable KPI Metrics Dashboard Highlighting Employee Retention Rate Structure PDF. You can use this template for your upcoming presentations, as the slides are perfect to represent even the tiniest detail. You can download these templates from the Slidegeeks website and these are easy to edit. So grab these today.

Various Power Meter Panel In Factory Control Room Ppt PowerPoint Presentation Gallery Smartart PDF
Pitch your topic with ease and precision using this various power meter panel in factory control room ppt powerpoint presentation gallery smartart pdf. This layout presents information on various power meter panel in factory control room. It is also available for immediate download and adjustment. So, changes can be made in the color, design, graphics or any other component to create a unique layout.

Formulating Product Development Action Plan To Enhance Client Experience Dashboard Depicting Product Download PDF
This slide represents the dashboard that depicts product usage metrics that includes usage statistics, users and sessions on the basis of countries, events trends, product loyalty, product usage by city. Deliver an awe inspiring pitch with this creative formulating product development action plan to enhance client experience dashboard depicting product download pdf bundle. Topics like usage statistics, users and sessions on the basis of countries, events trends, product loyalty, product usage by city can be discussed with this completely editable template. It is available for immediate download depending on the needs and requirements of the user.

Business Diagram Dashboard With Pointer And Text Boxes For Process Control Presentation Template
This business diagram displays graphic of dashboard with pointer and text boxes. This slide helps to depict concept of business process and management. Present your views using this innovative slide and be assured of leaving a lasting impression.

Content Delivery And Promotion Dashboard To Track Leads Generated Through Content Diagrams PDF
This slide showcases dashboard that can help organization to track leads generated by running content marketing campaigns. Its key metrics are website visitors, cost per click, top converting marketing channels, top lead generation source, ROI by marketing channel etc. Do you have an important presentation coming up Are you looking for something that will make your presentation stand out from the rest Look no further than Content Delivery And Promotion Dashboard To Track Leads Generated Through Content Diagrams PDF. With our professional designs, you can trust that your presentation will pop and make delivering it a smooth process. And with Slidegeeks, you can trust that your presentation will be unique and memorable. So why wait Grab Content Delivery And Promotion Dashboard To Track Leads Generated Through Content Diagrams PDF today and make your presentation stand out from the rest.
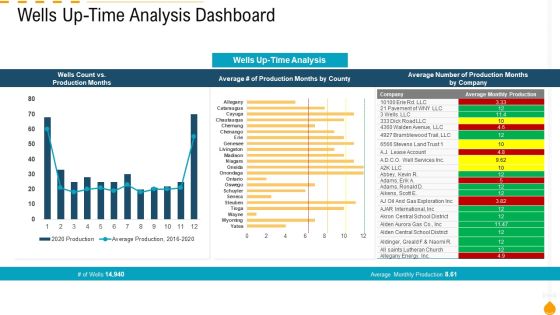
Wells Up Time Analysis Dashboard Elements PDF
Deliver an awe inspiring pitch with this creative wells up time analysis dashboard elements pdf bundle. Topics like wells up time analysis dashboard, can be discussed with this completely editable template. It is available for immediate download depending on the needs and requirements of the user.

Email Engagement Dashboard Profile Ppt Infographics Images PDF
Email engagement metrics help you understand which email campaigns saw the highest open rate and click-through rate. It also gives you an idea of how different age groups interact with your emails helping you customize the content accordingly. Deliver an awe-inspiring pitch with this creative email engagement dashboard profile ppt infographics images pdf bundle. Topics like email engagement dashboard can be discussed with this completely editable template. It is available for immediate download depending on the needs and requirements of the user.
Social Media Channels Auditing Content Performance Tracking Dashboard For Social Media Icons PDF
This slide indicates the content performance tracking dashboard for social media channels providing information regarding the total number of posts, engagement rate, audience sentiments and multiple hashtags performance. There are so many reasons you need a Social Media Channels Auditing Content Performance Tracking Dashboard For Social Media Icons PDF. The first reason is you cant spend time making everything from scratch, Thus, Slidegeeks has made presentation templates for you too. You can easily download these templates from our website easily.

Dashboard For Risk Communication Strategies Planning And Key Metrics Tracking Brochure PDF Ideas PDF
This slide shows dashboard for planning risk communication and tracking key metrics which includes heat map of risk, classification, objectives, effectiveness, critical risks, etc. Showcasing this set of slides titled Dashboard For Risk Communication Strategies Planning And Key Metrics Tracking Brochure PDF Ideas PDF. The topics addressed in these templates are Risk Heat Map, Tactical Objectives, Controls Effectiveness. All the content presented in this PPT design is completely editable. Download it and make adjustments in color, background, font etc. as per your unique business setting.
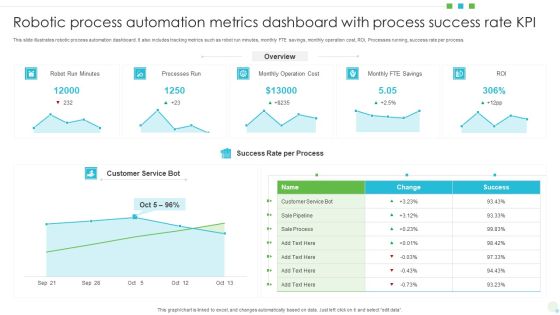
Robotic Process Automation Metrics Dashboard With Process Success Rate KPI Professional PDF
This slide illustrates robotic process automation dashboard. It also includes tracking metrics such as robot run minutes, monthly FTE savings, monthly operation cost, ROI, Processes running, success rate per process. Showcasing this set of slides titled Robotic Process Automation Metrics Dashboard With Process Success Rate KPI Professional PDF The topics addressed in these templates are Processes Run, Monthly Operation Cost, Customer Service Bot. All the content presented in this PPT design is completely editable. Download it and make adjustments in color, background, font etc. as per your unique business setting.
Weekly Retail Expenditure Dashboard Icon Rules PDF
Persuade your audience using this Weekly Retail Expenditure Dashboard Icon Rules PDF. This PPT design covers three stages, thus making it a great tool to use. It also caters to a variety of topics including Weekly Retail Expenditure, Dashboard Icon. Download this PPT design now to present a convincing pitch that not only emphasizes the topic but also showcases your presentation skills.

Procurement Dashboard To Measure Suppliers Performance Infographics PDF
This slide provides an overview of the procurement dashboard to determine vendors capacity for providing the right goods and services. The KPIs covered are defect rate, on-time supplies, supplier availability, delivery and lead time. This Procurement Dashboard To Measure Suppliers Performance Infographics PDF from Slidegeeks makes it easy to present information on your topic with precision. It provides customization options, so you can make changes to the colors, design, graphics, or any other component to create a unique layout. It is also available for immediate download, so you can begin using it right away. Slidegeeks has done good research to ensure that you have everything you need to make your presentation stand out. Make a name out there for a brilliant performance.

Crm Marketing Dashboard Ppt PowerPoint Presentation Templates
This is a crm marketing dashboard ppt powerpoint presentation templates. This is a two stage process. The stages in this process are leads this week query target, leads per week.
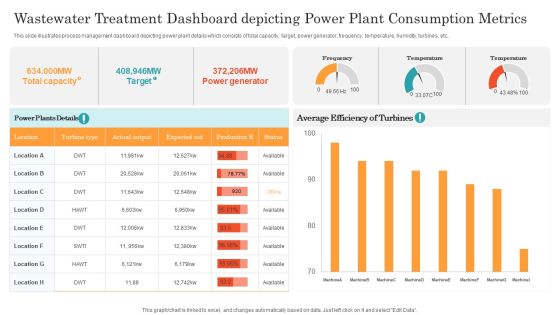
Wastewater Treatment Dashboard Depicting Power Plant Consumption Metrics Ppt Slides Tips PDF
This slide illustrates process management dashboard depicting power plant details which consists of total capacity, target, power generator, frequency, temperature, humidity, turbines, etc. Pitch your topic with ease and precision using this Wastewater Treatment Dashboard Depicting Power Plant Consumption Metrics Ppt Slides Tips PDF. This layout presents information on Power Generator, Target, Actual Output. It is also available for immediate download and adjustment. So, changes can be made in the color, design, graphics or any other component to create a unique layout.

Executive Dashboard Sample For Analysis Example
This is a executive dashboard sample for analysis example. This is a four stage process. The stages in this process are topper, step.

Dashboard For Consumer Partition In Marketing Research Microsoft PDF
The following slide depicts a dashboard which can be used by business to conduct customer segmentation in research and make marketing offers accordingly. the key performing indicators are gender, age, user location, education level etc. Showcasing this set of slides titled Dashboard For Consumer Partition In Marketing Research Microsoft PDF. The topics addressed in these templates are General, Education And Job, Household. All the content presented in this PPT design is completely editable. Download it and make adjustments in color, background, font etc. as per your unique business setting.
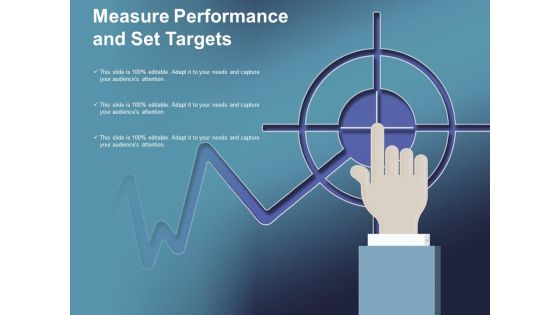
Measure Performance And Set Targets Ppt Powerpoint Presentation Gallery Guidelines
This is a measure performance and set targets ppt powerpoint presentation gallery guidelines. This is a three stage process. The stages in this process are business metrics, business kpi, business dashboard.

Metric Dashboard Showcasing Measurement Of Gender Diversity Pay Gap Sample PDF
This slide represents KPI dashboard showcasing metrics to measure gender pay gap. It provides information regarding salary pay gap, bonus pay gap, women promoted, recruited, and total women in each department. Pitch your topic with ease and precision using this Metric Dashboard Showcasing Measurement Of Gender Diversity Pay Gap Sample PDF. This layout presents information on Marketing, Screened, Delivery. It is also available for immediate download and adjustment. So, changes can be made in the color, design, graphics or any other component to create a unique layout.
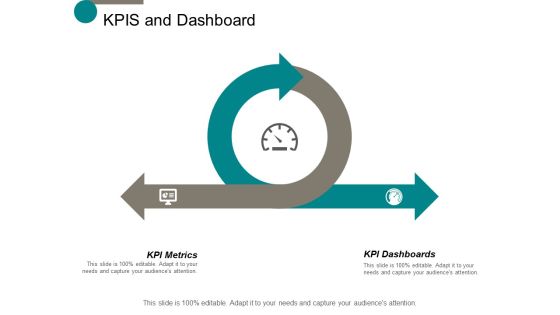
Kpis And Dashboard Ppt Powerpoint Presentation Infographic Template Portfolio
This is a kpis and dashboard ppt powerpoint presentation infographic template portfolio. This is a two stage process. The stages in this process are business, management, planning, strategy, marketing.
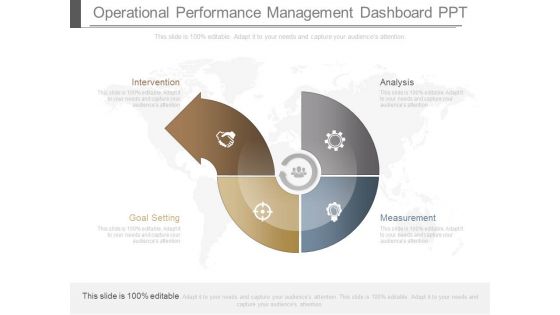
Operational Performance Management Dashboard Ppt
This is a operational performance management dashboard ppt. This is a four stage process. The stages in this process are intervention, goal setting, analysis, measurement.

Business People Clip Art 3d Men With Colorful Graph PowerPoint Slides
We present our business people clip art 3d men with colorful graph PowerPoint Slides.Download and present our Business PowerPoint Templates because Our PowerPoint Templates and Slides will let Your superior ideas hit the target always and everytime. Present our Shapes PowerPoint Templates because Our PowerPoint Templates and Slides will fulfill your every need. Use them and effectively satisfy the desires of your audience. Download our Success PowerPoint Templates because Our PowerPoint Templates and Slides will generate and maintain the level of interest you desire. They will create the impression you want to imprint on your audience. Download our Future PowerPoint Templates because They will Put the wind in your sails. Skim smoothly over the choppy waters of the market. Download our Marketing PowerPoint Templates because Our PowerPoint Templates and Slides will let you Leave a lasting impression to your audiences. They possess an inherent longstanding recall factor.Use these PowerPoint slides for presentations relating to 3d, accounting, analysis, bar,business,cartoon, character, chart, clipart, clipart, committee, company, concept,conceptual, corporate, council, directors, display, document, economics, executive,figure, finance, financial, goal, gold, graph, group, growth, guy, human, humanoid,man, management, market, meeting, office, percentage, performance, presentation, report, statistics, table, team. The prominent colors used in the PowerPoint template are Maroon, White, Black. Professionals tell us our business people clip art 3d men with colorful graph PowerPoint Slides provide you with a vast range of viable options. Select the appropriate ones and just fill in your text. Professionals tell us our analysis PowerPoint templates and PPT Slides are specially created by a professional team with vast experience. They diligently strive to come up with the right vehicle for your brilliant Ideas. People tell us our business people clip art 3d men with colorful graph PowerPoint Slides will make you look like a winner. Customers tell us our character PowerPoint templates and PPT Slides will help you be quick off the draw. Just enter your specific text and see your points hit home. The feedback we get is that our business people clip art 3d men with colorful graph PowerPoint Slides are effectively colour coded to prioritise your plans They automatically highlight the sequence of events you desire. Use our bar PowerPoint templates and PPT Slides will help you be quick off the draw. Just enter your specific text and see your points hit home.

Executing Video Promotional KPI Metrics Dashboard To Evaluate Facebook Video Campaign Summary PDF
The following slide outlines a comprehensive KPI dashboard which can be used to analyze the performance of Facebook video campaign. It provides information about page video views, page video views organic etc. Coming up with a presentation necessitates that the majority of the effort goes into the content and the message you intend to convey. The visuals of a PowerPoint presentation can only be effective if it supplements and supports the story that is being told. Keeping this in mind our experts created Executing Video Promotional KPI Metrics Dashboard To Evaluate Facebook Video Campaign Summary PDF to reduce the time that goes into designing the presentation. This way, you can concentrate on the message while our designers take care of providing you with the right template for the situation.
Performance Kpi Dashboard For Project Tracking And Control Pictures PDF
This slide covers project monitoring and control dashboard which can be used by PM. It provides information about metrics such as project health, actual budget, at risk project, start and finish date of the project. Showcasing this set of slides titled Performance Kpi Dashboard For Project Tracking And Control Pictures PDF. The topics addressed in these templates are Finance, Customer Support, Business Development. All the content presented in this PPT design is completely editable. Download it and make adjustments in color, background, font etc. as per your unique business setting.

Crm Dashboard Actual Vs Target Revenue Ppt PowerPoint Presentation Guidelines
This is a crm dashboard actual vs target revenue ppt powerpoint presentation guidelines. This is a three stage process. The stages in this process are actual, target.

Engineering Performance Metrics Dashboard To Track Cloud Services Cost Clipart PDF
This slide covers engineering KPI dashboard to track cost of cloud services. It involves KPIs such as average delay of product, cost of cloud services, pageview by browser and pull requests by projects. Showcasing this set of slides titled Engineering Performance Metrics Dashboard To Track Cloud Services Cost Clipart PDF. The topics addressed in these templates are Cost Of Cloud Services, Average, Product. All the content presented in this PPT design is completely editable. Download it and make adjustments in color, background, font etc. as per your unique business setting.
Real Time Employment Tracking Dashboard With Human Resource Metrics Brochure PDF
This slide showcases dashboard that can help human resource manager to track the salary and hiring status of employee in organization. Its key KPIs are permanent rate, turnover rate, absenteeism rate, employees hired and employees left. Showcasing this set of slides titled Real Time Employment Tracking Dashboard With Human Resource Metrics Brochure PDF. The topics addressed in these templates are Average Age, Permanent Rate, Headcount. All the content presented in this PPT design is completely editable. Download it and make adjustments in color, background, font etc. as per your unique business setting.

Property Leasing Dashboard Depicting Sale And Rent Analysis Diagrams PDF
This slide shows real estate leasing dashboard depicting sale and rent analysis which can be referred by property managers to manage various listing. It includes information about monthly stats of rent and sales, total proceeds, monthly target, rental properties, etc.Showcasing this set of slides titled property leasing dashboard depicting sale and rent analysis diagrams pdf The topics addressed in these templates are property leasing dashboard depicting sale and rent analysis All the content presented in this PPT design is completely editable. Download it and make adjustments in color, background, font etc. as per your unique business setting.

Constructive Destructive Customer Feedback Dashboard Designs PDF
This slide shows statistics about weekly number of favorable and unfavorable customer responses with overall email sentiment score. It further includes details about daily deals, special discounts, newsletter and renewal reminders. Showcasing this set of slides titled Constructive Destructive Customer Feedback Dashboard Designs PDF. The topics addressed in these templates are Previous Week, Current Week, Dashboard. All the content presented in this PPT design is completely editable. Download it and make adjustments in color, background, font etc. as per your unique business setting.

Action Plan To Enhance Dashboard Depicting Metrics To Measure Customer Icons PDF
This slide shows dashboard that depicts metrics to measure customer experience that covers net revenue, customer retention, abandonment, unique visitors, etc. Find highly impressive Action Plan To Enhance Dashboard Depicting Metrics To Measure Customer Icons PDF on Slidegeeks to deliver a meaningful presentation. You can save an ample amount of time using these presentation templates. No need to worry to prepare everything from scratch because Slidegeeks experts have already done a huge research and work for you. You need to download Action Plan To Enhance Dashboard Depicting Metrics To Measure Customer Icons PDF for your upcoming presentation. All the presentation templates are 100 percent editable and you can change the color and personalize the content accordingly. Download now

Dashboard To Assess Ecommerce Financial Performance Across Regions Themes PDF
This slide showcases ecommerce key performance indicators KPI dashboard with financial statement. It provides information about total sales, orders, net profit, net profit margin, average order value, channels, etc. Here you can discover an assortment of the finest PowerPoint and Google Slides templates. With these templates, you can create presentations for a variety of purposes while simultaneously providing your audience with an eye catching visual experience. Download Dashboard To Assess Ecommerce Financial Performance Across Regions Themes PDF to deliver an impeccable presentation. These templates will make your job of preparing presentations much quicker, yet still, maintain a high level of quality. Slidegeeks has experienced researchers who prepare these templates and write high quality content for you. Later on, you can personalize the content by editing the Dashboard To Assess Ecommerce Financial Performance Across Regions Themes PDF.

Improving HRM Process Dashboards To Track Diversity And Inclusion Metrics Background PDF
The performance tracker includes parameters to check diversion and inclusion through gender distribution ratio, hires by gender percentage, turnover by gender, ethnicity distribution etc. Are you in need of a template that can accommodate all of your creative concepts This one is crafted professionally and can be altered to fit any style. Use it with Google Slides or PowerPoint. Include striking photographs, symbols, depictions, and other visuals. Fill, move around, or remove text boxes as desired. Test out color palettes and font mixtures. Edit and save your work, or work with colleagues. Download Improving HRM Process Dashboards To Track Diversity And Inclusion Metrics Background PDF and observe how to make your presentation outstanding. Give an impeccable presentation to your group and make your presentation unforgettable.

Digital KPI Dashboard To Track Email Bounce Slides PDF
This slide shows dashboard which can e used by organizations to monitor performance of email. It includes key performance indicators such as traffic status, conversions, behaviors, etc. Pitch your topic with ease and precision using this Digital KPI Dashboard To Track Email Bounce Slides PDF. This layout presents information on Digital Kpi Dashboard, Track Email Bounce. It is also available for immediate download and adjustment. So, changes can be made in the color, design, graphics or any other component to create a unique layout.

Cost And Purchase Order Procurement Dashboard Icons PDF
This slide provides an overview of the cost and purchase order-related performance indicators to improve efficiency and optimize processes. The dashboard includes the cost of the purchase order, cost reduction, savings, procurement ROI and top 5 suppliers. If you are looking for a format to display your unique thoughts, then the professionally designed Cost And Purchase Order Procurement Dashboard Icons PDF is the one for you. You can use it as a Google Slides template or a PowerPoint template. Incorporate impressive visuals, symbols, images, and other charts. Modify or reorganize the text boxes as you desire. Experiment with shade schemes and font pairings. Alter, share or cooperate with other people on your work. Download Cost And Purchase Order Procurement Dashboard Icons PDF and find out how to give a successful presentation. Present a perfect display to your team and make your presentation unforgettable.

Table Of Contents For Cloud Infrastructure At Scale How To Perform A Cloud Architecture Review Infographics PDF
Presenting table of contents for cloud infrastructure at scale how to perform a cloud architecture review infographics pdf to provide visual cues and insights. Share and navigate important information on eleven stages that need your due attention. This template can be used to pitch topics like opportunities and innovation, establish priorities, reduce, reuse, recycle, ideal future, business objectives. In addtion, this PPT design contains high resolution images, graphics, etc, that are easily editable and available for immediate download.
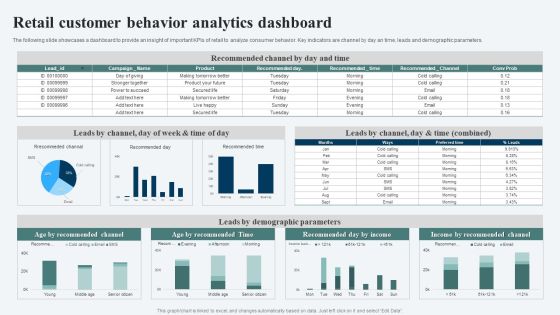
Retail Customer Behavior Analytics Dashboard Ppt Ideas Templates PDF
The following slide showcases a dashboard to provide an insight of important KPIs of retail to analyze consumer behavior. Key indicators are channel by day an time, leads and demographic parameters. Showcasing this set of slides titled Retail Customer Behavior Analytics Dashboard Ppt Ideas Templates PDF. The topics addressed in these templates are Recommended Channel, Leads Demographic Parameters, Income Recommended Channel. All the content presented in this PPT design is completely editable. Download it and make adjustments in color, background, font etc. as per your unique business setting.

Building Quality Inspection Dashboard With Customer Satisfaction Ratio Icons PDF
The following slide showcases dashboard of construction company exhibiting quality KPIs regarding safety, workmanship and customer satisfaction. Key indicators covered are site inspection success level, CSR, defect count, net promoter score, promotors, passives, defectors, total rework cost, safety meetings and average time taken to fix defects. Showcasing this set of slides titled Building Quality Inspection Dashboard With Customer Satisfaction Ratio Icons PDF. The topics addressed in these templates are Construction Project, Customer Satisfaction Ratio, Promoters. All the content presented in this PPT design is completely editable. Download it and make adjustments in color, background, font etc. as per your unique business setting.
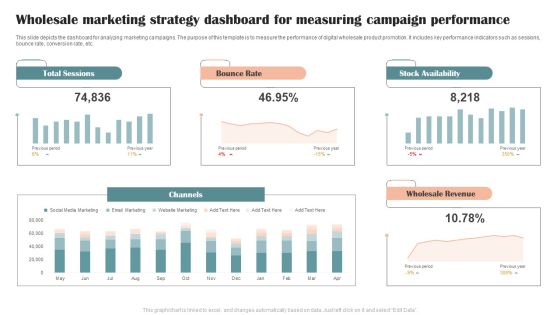
Wholesale Marketing Strategy Dashboard For Measuring Campaign Performance Graphics PDF
This slide depicts the dashboard for analyzing marketing campaigns. The purpose of this template is to measure the performance of digital wholesale product promotion. It includes key performance indicators such as sessions, bounce rate, conversion rate, etc. Showcasing this set of slides titled Wholesale Marketing Strategy Dashboard For Measuring Campaign Performance Graphics PDF. The topics addressed in these templates are Total Sessions, Bounce Rate, Stock Availability. All the content presented in this PPT design is completely editable. Download it and make adjustments in color, background, font etc. as per your unique business setting.
Executive Dashboards For Tracking Key Performance Icons PDF
This slide represents the dashboard for the CEO to track the companys performance. It includes key performance indicators such as no. of deals, open deals, revenue, expected revenue and win percentage. Showcasing this set of slides titled Executive Dashboards For Tracking Key Performance Icons PDF. The topics addressed in these templates are Pen Deals, Revenue, Expected Revenue. All the content presented in this PPT design is completely editable. Download it and make adjustments in color, background, font etc. as per your unique business setting.

Automated Dashboard To Track Status Of Order Request Themes PDF
The following slide highlights automated dashboard which can be used to track the status of pleased orders, and manage the inventory across various outlets. The key performance indicators are order, summary, inventory, summary, cost of goods sold, financial statement. Showcasing this set of slides titled Automated Dashboard To Track Status Of Order Request Themes PDF. The topics addressed in these templates are Inventory Value, Inventory Summary, Cost. All the content presented in this PPT design is completely editable. Download it and make adjustments in color, background, font etc. as per your unique business setting.

Performance KPI Dashboard Highlighting Boosting Brand Image Sample PDF
The following slide depicts a performance based dashboard to be used by brand managers to track the efficiency of marketing activities across platforms which has led to an increase in overall brand awareness. The key performing indicators are total website visits, user session, website mention, shares etc. Showcasing this set of slides titled Performance KPI Dashboard Highlighting Boosting Brand Image Sample PDF. The topics addressed in these templates are Social Media, Backlinks, Mentions Tags. All the content presented in this PPT design is completely editable. Download it and make adjustments in color, background, font etc. as per your unique business setting.

Carbon Footprint Management Dashboard For International Events Brochure PDF
The following slide depicts a Carbon footprint management dashboard that will be used by managers monitoring emissions in global events and taking appropriate actions. Major key performance indicators include the total number of guests, total carbon footprint, waste carbon footprint, etc. Showcasing this set of slides titled Carbon Footprint Management Dashboard For International Events Brochure PDF. The topics addressed in these templates are Carbon Footprint, Carbon Emission By Category, Waste Carbon Footprint. All the content presented in this PPT design is completely editable. Download it and make adjustments in color, background, font etc. as per your unique business setting.

Key Techniques To Enhance Cost Efficiency Stats Highlighting Overall Impact On Business Background PDF
The slide demonstrates a dashboard indicating the overall impact of cost efficiency strategies on business revenues and expenses. Various elements included in the dashboard are category wise business revenue, major expenses, total cost savings, etc. Find a pre designed and impeccable Key Techniques To Enhance Cost Efficiency Stats Highlighting Overall Impact On Business Background PDF. The templates can ace your presentation without additional effort. You can download these easy to edit presentation templates to make your presentation stand out from others. So, what are you waiting for Download the template from Slidegeeks today and give a unique touch to your presentation.
Devops Frequency And Deployment Performance Dashboard Icons PDF
This template covers DevOps deployment, change in value, lead time customer ticket software performance indicators. Presenting devops frequency and deployment performance dashboard icons pdf to provide visual cues and insights. Share and navigate important information on nine stages that need your due attention. This template can be used to pitch topics like customer, performance. In addtion, this PPT design contains high resolution images, graphics, etc, that are easily editable and available for immediate download.

Alliance Evaluation Dashboard Ppt Pictures Sample PDF
Presenting this set of slides with name alliance evaluation dashboard ppt pictures sample pdf. This is a three stage process. The stages in this process are low, medium, high. This is a completely editable PowerPoint presentation and is available for immediate download. Download now and impress your audience.

Kpi Metrics Dashboard Post Resolving Workplace Conflict Microsoft PDF
The purpose of this slide is to outline key performance indicator KPI dashboard showcasing the results post resolving organizational conflicts. The metrics covered in this slide are conflicts by departments, conflicts logged by gender etc. Do you know about Slidesgeeks Kpi Metrics Dashboard Post Resolving Workplace Conflict Microsoft PDF These are perfect for delivering any kind od presentation. Using it, create PowerPoint presentations that communicate your ideas and engage audiences. Save time and effort by using our pre designed presentation templates that are perfect for a wide range of topic. Our vast selection of designs covers a range of styles, from creative to business, and are all highly customizable and easy to edit. Download as a PowerPoint template or use them as Google Slides themes.
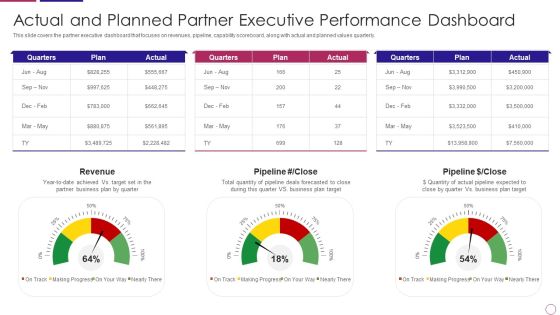
PRM To Streamline Business Processes Actual And Planned Partner Executive Performance Dashboard Demonstration PDF
This slide covers the partner executive dashboard that focuses on revenues, pipeline, capability scoreboard, along with actual and planned values quarterly. Deliver an awe inspiring pitch with this creative prm to streamline business processes actual and planned partner executive performance dashboard demonstration pdf bundle. Topics like revenue, plan, target can be discussed with this completely editable template. It is available for immediate download depending on the needs and requirements of the user.

Dashboard For Measuring Industry Success Rate Ppt PowerPoint Presentation Graphics
This is a dashboard for measuring industry success rate ppt powerpoint presentation graphics. This is a one stage process. The stages in this process are medium, low high.
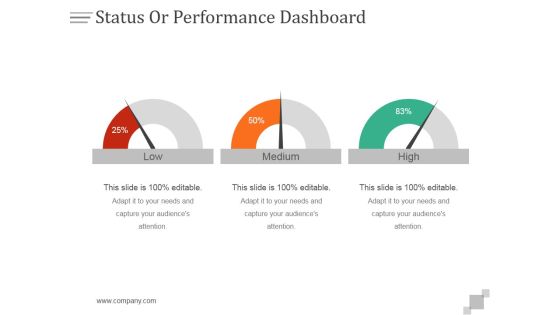
Status Or Performance Dashboard Ppt PowerPoint Presentation Designs Download
This is a status or performance dashboard ppt powerpoint presentation designs download. This is a three stage process. The stages in this process are low, medium, high.

Change Management Performance Dashboard Ppt PowerPoint Presentation Slides Rules
This is a change management performance dashboard ppt powerpoint presentation slides rules. This is a two stage process. The stages in this process are percentage, chart, marketing, management.

Client Life Cycle Dashboard With Marketing Metrics Ppt File Format PDF
This slide shows the key marketing KPIs such as conversion rate, impressions, etc. in customer journey cycle Showcasing this set of slides titled client life cycle dashboard with marketing metrics ppt file format pdf. The topics addressed in these templates are average customer rating, conversion rate, purchases. All the content presented in this PPT design is completely editable. Download it and make adjustments in color, background, font etc. as per your unique business setting.

Strategies For Effective Product Metric Dashboard To Track Product Success Elements PDF
This slide represents dashboard for tracking product success. It covers new customer, total sessions, purchase, total inquires, total crashes etc. Explore a selection of the finest Strategies For Effective Product Metric Dashboard To Track Product Success Elements PDF here. With a plethora of professionally designed and pre-made slide templates, you can quickly and easily find the right one for your upcoming presentation. You can use our Strategies For Effective Product Metric Dashboard To Track Product Success Elements PDF to effectively convey your message to a wider audience. Slidegeeks has done a lot of research before preparing these presentation templates. The content can be personalized and the slides are highly editable. Grab templates today from Slidegeeks.
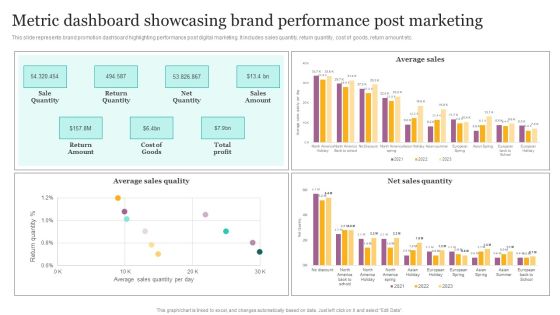
Metric Dashboard Showcasing Brand Performance Post Marketing Ppt Layouts Microsoft PDF
This slide represents brand promotion dashboard highlighting performance post digital marketing. It includes sales quantity, return quantity, cost of goods, return amount etc. Explore a selection of the finest Metric Dashboard Showcasing Brand Performance Post Marketing Ppt Layouts Microsoft PDF here. With a plethora of professionally designed and pre made slide templates, you can quickly and easily find the right one for your upcoming presentation. You can use our Metric Dashboard Showcasing Brand Performance Post Marketing Ppt Layouts Microsoft PDF to effectively convey your message to a wider audience. Slidegeeks has done a lot of research before preparing these presentation templates. The content can be personalized and the slides are highly editable. Grab templates today from Slidegeeks.
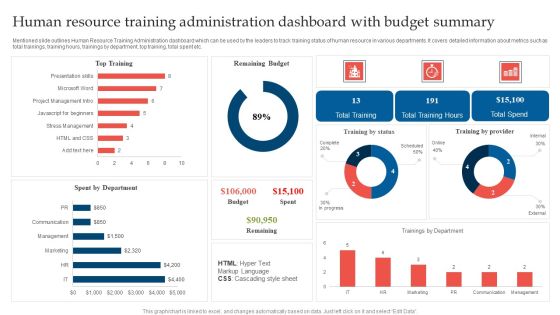
Human Resource Training Administration Dashboard With Budget Summary Microsoft PDF
Mentioned slide outlines Human Resource Training Administration dashboard which can be used by the leaders to track training status of human resource in various departments. It covers detailed information about metrics such as total trainings, training hours, trainings by department, top training, total spent etc. Showcasing this set of slides titled Human Resource Training Administration Dashboard With Budget Summary Microsoft PDF. The topics addressed in these templates are Remaining Budget, Top Training, Spent Department. All the content presented in this PPT design is completely editable. Download it and make adjustments in color, background, font etc. as per your unique business setting.
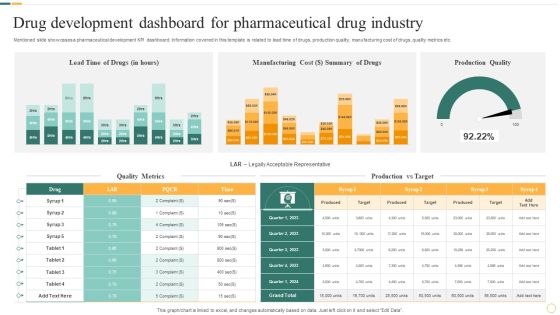
Drug Development Dashboard For Pharmaceutical Drug Industry Portrait PDF
Mentioned slide showcases a pharmaceutical development KPI dashboard. Information covered in this template is related to lead time of drugs, production quality, manufacturing cost of drugs, quality metrics etc. Showcasing this set of slides titled Drug Development Dashboard For Pharmaceutical Drug Industry Portrait PDF. The topics addressed in these templates are Manufacturing Cost, Summary Of Drugs, Production Quality. All the content presented in this PPT design is completely editable. Download it and make adjustments in color, background, font etc. as per your unique business setting.

KPI Dashboard To Measure Sales Divisional Strategy Performance Microsoft PDF
This slide signifies the key performance indicator dashboard to evaluate sales department strategy. It covers information regarding to the leads generated, conversion rate, top product in revenue. Pitch your topic with ease and precision using this KPI Dashboard To Measure Sales Divisional Strategy Performance Microsoft PDF. This layout presents information on Sales Rations, Lead Generation, Customer Conversion. It is also available for immediate download and adjustment. So, changes can be made in the color, design, graphics or any other component to create a unique layout.

SEO Strategies Analytics Dashboard Ppt PowerPoint Presentation Styles Inspiration Cpb
Presenting this set of slides with name seo strategies analytics dashboard ppt powerpoint presentation styles inspiration cpb. This is a one stage process. The stages in this process are seo strategies analytics dashboard. This is a completely editable PowerPoint presentation and is available for immediate download. Download now and impress your audience.
Performance Dashboard Vector Icon Ppt PowerPoint Presentation Styles Demonstration PDF
Presenting this set of slides with name performance dashboard vector icon ppt powerpoint presentation styles demonstration pdf. This is a three stage process. The stages in this process are performance dashboard vector icon. This is a completely editable PowerPoint presentation and is available for immediate download. Download now and impress your audience.
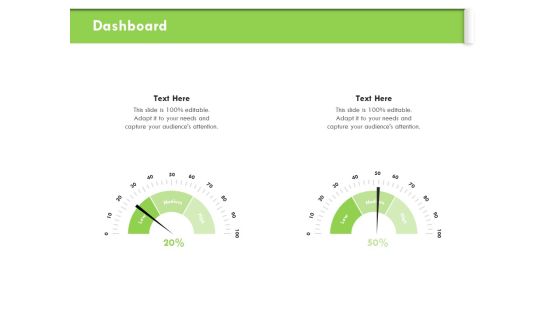
Understanding Organizational Structures Dashboard Ppt Professional Ideas PDF
Presenting this set of slides with name understanding organizational structures dashboard ppt professional ideas pdf. This is a two stage process. The stages in this process are dashboard. This is a completely editable PowerPoint presentation and is available for immediate download. Download now and impress your audience.

Effective Outcome Launch Roadmap Dashboard Ppt Professional Files PDF
Presenting this set of slides with name effective outcome launch roadmap dashboard ppt professional files pdf. This is a one stage process. The stages in this process are dashboard. This is a completely editable PowerPoint presentation and is available for immediate download. Download now and impress your audience.

Project Tasks Status Dashboard Ppt PowerPoint Presentation Layouts
This is a project tasks status dashboard ppt powerpoint presentation layouts. This is a three stage process. The stages in this process are complete tasks, tasks in progress, not started tasks, complete, status.

Crm Marketing Dashboard Ppt PowerPoint Presentation File Guidelines
This is a crm marketing dashboard ppt powerpoint presentation file guidelines. This is a two stage process. The stages in this process are leads per week, leads this week query target.
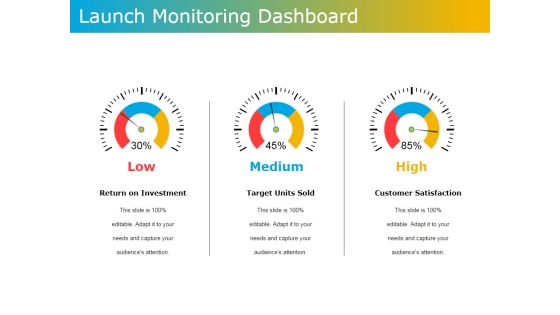
Launch Monitoring Dashboard Ppt PowerPoint Presentation File Aids
This is a launch monitoring dashboard ppt powerpoint presentation file aids. This is a three stage process. The stages in this process are return on investment, target units sold, customer satisfaction, medium, high.
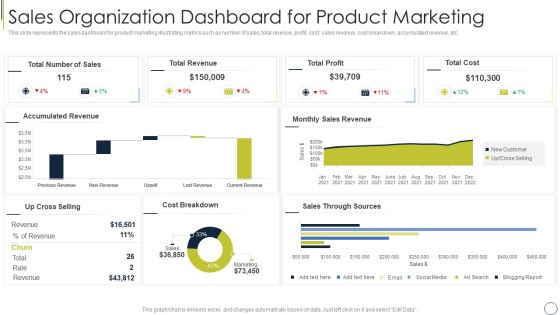
Sales Organization Dashboard For Product Marketing Themes PDF
This slide represents the sales dashboard for product marketing illustrating metrics such as number of sales, total revenue, profit, cost, sales revenue, cost breakdown, accumulated revenue, etc. Pitch your topic with ease and precision using this sales organization dashboard for product marketing themes pdf. This layout presents information on total cost, total profit, total revenue. It is also available for immediate download and adjustment. So, changes can be made in the color, design, graphics or any other component to create a unique layout.

Project Management Plan Dashboard With Overall Progress Professional PDF
This slide represents project plan dashboard with major risks and total budget. It includes major metrics like risks, budget, workload, project launch date and overall project progress. Pitch your topic with ease and precision using this Project Management Plan Dashboard With Overall Progress Professional PDF. This layout presents information on Total Budget, Risks, Development. It is also available for immediate download and adjustment. So, changes can be made in the color, design, graphics or any other component to create a unique layout.

Project Limitations Dashboard With Cost And Time Graphics PDF
This slide showcases dashboard to track key metrics necessary for project success and effective management of constraints. It includes elements such as health, tasks, progress, workload, etc. Pitch your topic with ease and precision using this Project Limitations Dashboard With Cost And Time Graphics PDF. This layout presents information on Time, Workload, Tasks, Progress. It is also available for immediate download and adjustment. So, changes can be made in the color, design, graphics or any other component to create a unique layout.
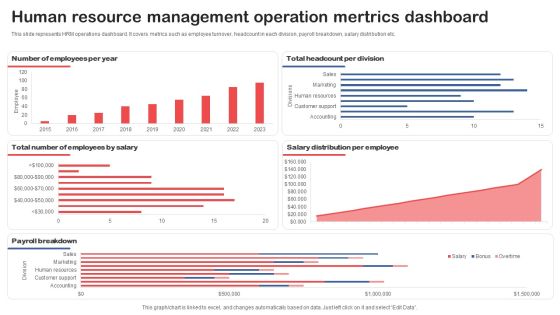
Human Resource Management Operation Mertrics Dashboard Background PDF
This slide represents HRM operations dashboard. It covers metrics such as employee turnover, headcount in each division, payroll breakdown, salary distribution etc. Pitch your topic with ease and precision using thisHuman Resource Management Operation Mertrics Dashboard Background PDF. This layout presents information on Number Of Employees, Headcount Per Division, Employees By Salary. It is also available for immediate download and adjustment. So, changes can be made in the color, design, graphics or any other component to create a unique layout.

Google Adwords Strategic Campaign Dashboard For Marketing Department Download PDF
This slide showcases KPI dashboard for real time tracking google adwords campaign metrics. It includes key elements such as impressions, clicks, costs, spend, etc. Pitch your topic with ease and precision using this Google Adwords Strategic Campaign Dashboard For Marketing Department Download PDF. This layout presents information on Impressions, Clicks, Costs. It is also available for immediate download and adjustment. So, changes can be made in the color, design, graphics or any other component to create a unique layout.

Marketing Analytics Dashboard With Conversion Rate Summary PDF
The purpose of this slide is to outline marketing analytics dashboard. The dashboard provides information about key metrices such as total impressions, clicks, cost, conversion value, rate, ROAS, market share by different ad platforms etc. Pitch your topic with ease and precision using this Marketing Analytics Dashboard With Conversion Rate Summary PDF. This layout presents information on Marketing Analytics Dashboard With Conversion Rate. It is also available for immediate download and adjustment. So, changes can be made in the color, design, graphics or any other component to create a unique layout.

Customer Service Metrics Dashboard With Average First Response Time Background PDF
This slide showcases Dashboard for Customer Service metrics that can help organization to easily identify the key pain points of your customers, areas which need additional resources and support agents that can benefit from additional training. It also showcases performance of top and bottom 5 call support agents. Pitch your topic with ease and precision using this Customer Service Metrics Dashboard With Average First Response Time Background PDF. This layout presents information on Average, Abandon Rate, Contact Resolution. It is also available for immediate download and adjustment. So, changes can be made in the color, design, graphics or any other component to create a unique layout.

Improving Digital Community Engagement Strategy Social Media Platforms Dashboard With Key Metrics Professional PDF
This slide shows KPI dashboard for assessing performance of social media platforms. It provides information about followers, likes, clicks, shares, impressions, engaged users, new followers, etc. Deliver and pitch your topic in the best possible manner with this Improving Digital Community Engagement Strategy Social Media Platforms Dashboard With Key Metrics Professional PDF. Use them to share invaluable insights on Social Media Platforms Engagement, Key Engagement Metrics and impress your audience. This template can be altered and modified as per your expectations. So, grab it now.
Stock Performance Dashboard For Metrics Team Management Ppt Outline Icons PDF
This slide represents the dashboard for tracking the management team member, manager, and teams ability to ensure inventory accuracy over time. It includes KPIs such as inventory, average result area scores and result areas. Pitch your topic with ease and precision using this Stock Performance Dashboard For Metrics Team Management Ppt Outline Icons PDF. This layout presents information on Result areas, Metrics Team, Needs Help. It is also available for immediate download and adjustment. So, changes can be made in the color, design, graphics or any other component to create a unique layout.
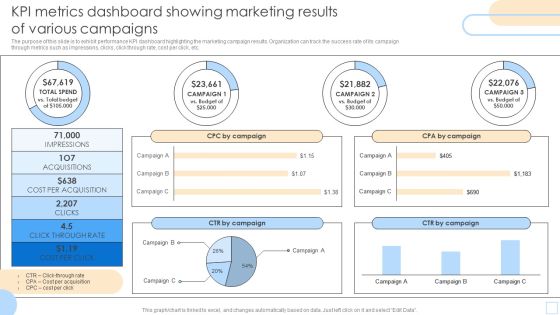
KPI Metrics Dashboard Showing Marketing Results Of Various Campaigns Pictures PDF
The purpose of this slide is to exhibit performance KPI dashboard highlighting the marketing campaign results. Organization can track the success rate of its campaign through metrics such as impressions, clicks, click through rate, cost per click, etc. Pitch your topic with ease and precision using this KPI Metrics Dashboard Showing Marketing Results Of Various Campaigns Pictures PDF. This layout presents information on Impressions, Acquisitions, CPA By Campaign. It is also available for immediate download and adjustment. So, changes can be made in the color, design, graphics or any other component to create a unique layout.
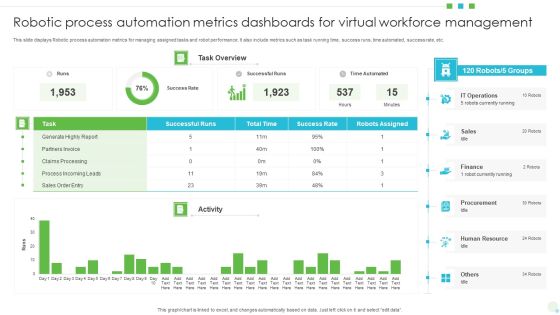
Robotic Process Automation Metrics Dashboards For Virtual Workforce Management Background PDF
This slide displays Robotic process automation metrics for managing assigned tasks and robot performance. It also include metrics such as task running time, success runs, time automated, success rate, etc. Showcasing this set of slides titled Robotic Process Automation Metrics Dashboards For Virtual Workforce Management Background PDF. The topics addressed in these templates are Finance, Sales, Human Resource. All the content presented in this PPT design is completely editable. Download it and make adjustments in color, background, font etc. as per your unique business setting.
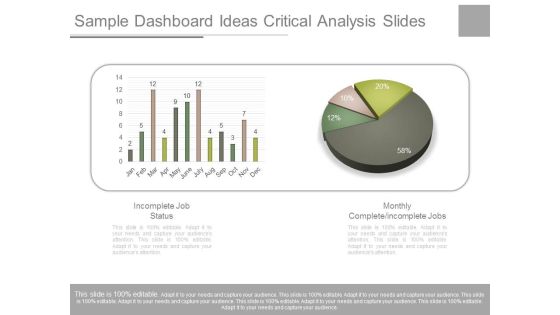
Sample Dashboard Ideas Critical Analysis Slides
This is a sample dashboard ideas critical analysis slides. This is a two stage process. The stages in this process are incomplete job status, monthly complete incomplete jobs, jan feb, mar, apr, may, june, july, aug, sep, oct, nov, dec.
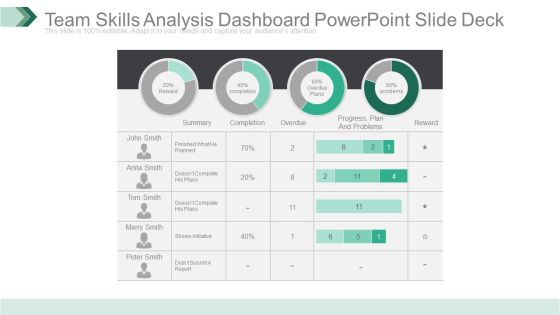
Team Skills Analysis Dashboard Powerpoint Slide Deck
This is a team skills analysis dashboard powerpoint slide deck. This is a four stage process. The stages in this process are reward, summary, completion, overdue, progress plan and problems, problems, reward.

Online Marketing Dashboard Showing Key Conversion Metrics Ppt PowerPoint Presentation Outline Example Topics PDF
Pitch your topic with ease and precision using this online marketing dashboard showing key conversion metrics ppt powerpoint presentation outline example topics pdf. This layout presents information on lead breakdown, leads, web user, top social media channels, key conversion metrics, trial leads by region. It is also available for immediate download and adjustment. So, changes can be made in the color, design, graphics or any other component to create a unique layout.

Project Tasks Status Dashboard Ppt PowerPoint Presentation Templates
This is a project tasks status dashboard ppt powerpoint presentation templates. This is a three stage process. The stages in this process are complete tasks, tasks in progress, not started tasks.

Sales Dashboard Template 1 Ppt PowerPoint Presentation Samples
This is a sales dashboard template 1 ppt powerpoint presentation samples. This is a one stage process. The stages in this process are sales and percent growth of product, revenue, product, percent growth.

Crm Marketing Dashboard Ppt PowerPoint Presentation Gallery Tips
This is a crm marketing dashboard ppt powerpoint presentation gallery tips. This is a two stage process. The stages in this process are leads per week, leads this week.

Project Tasks Status Dashboard Ppt PowerPoint Presentation Professional Pictures
This is a project tasks status dashboard ppt powerpoint presentation professional pictures. This is a three stage process. The stages in this process are complete tasks, task in progress, not started tasks, task.

Launch Monitoring Dashboard Ppt PowerPoint Presentation Slides Structure
This is a launch monitoring dashboard ppt powerpoint presentation slides structure. This is a three stage process. The stages in this process are return on investment, target units sold, customer satisfaction.

Finance Dashboard Ppt PowerPoint Presentation Model Graphics Example
This is a finance dashboard ppt powerpoint presentation model graphics example. This is a two stage process. The stages in this process are sales, operating expenses, operating income, net income.

Action Priority Dashboard With Three Levels Ppt Outline Format PDF
Persuade your audience using this action priority dashboard with three levels ppt outline format pdf. This PPT design covers three stages, thus making it a great tool to use. It also caters to a variety of topics including action priority dashboard with three levels. Download this PPT design now to present a convincing pitch that not only emphasizes the topic but also showcases your presentation skills.

Stock Performance Metrics Dashboard For FMCG Company Ppt Ideas Design Inspiration PDF
This slide showcases the metrics for analyzing inventory turnover. It includes KPIs such as product sold within freshness date, out of stock rate, on time in full deliveries, etc. Showcasing this set of slides titled Stock Performance Metrics Dashboard For FMCG Company Ppt Ideas Design Inspiration PDF. The topics addressed in these templates are Inventory Turnover, Overview 2015, Inventory Turnover. All the content presented in this PPT design is completely editable. Download it and make adjustments in color, background, font etc. as per your unique business setting.
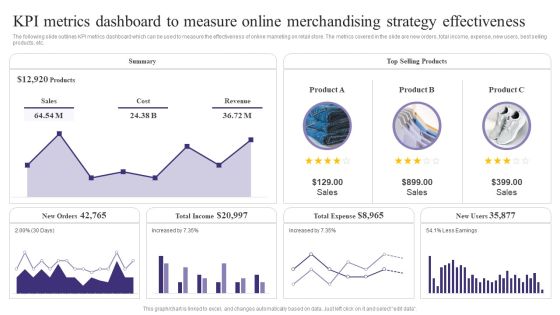
KPI Metrics Dashboard To Measure Online Merchandising Strategy Effectiveness Sample PDF
The following slide outlines KPI metrics dashboard which can be used to measure the effectiveness of online marketing on retail store. The metrics covered in the slide are new orders, total income, expense, new users, best selling products, etc. Coming up with a presentation necessitates that the majority of the effort goes into the content and the message you intend to convey. The visuals of a PowerPoint presentation can only be effective if it supplements and supports the story that is being told. Keeping this in mind our experts created KPI Metrics Dashboard To Measure Online Merchandising Strategy Effectiveness Sample PDF to reduce the time that goes into designing the presentation. This way, you can concentrate on the message while our designers take care of providing you with the right template for the situation.

KPI Metrics Dashboard To Measure Online Merchandising Strategy Effectiveness Pictures PDF
The following slide outlines KPI metrics dashboard which can be used to measure the effectiveness of online marketing on retail store. The metrics covered in the slide are new orders, total income, expense, new users, best selling products, etc. Coming up with a presentation necessitates that the majority of the effort goes into the content and the message you intend to convey. The visuals of a PowerPoint presentation can only be effective if it supplements and supports the story that is being told. Keeping this in mind our experts created KPI Metrics Dashboard To Measure Online Merchandising Strategy Effectiveness Pictures PDF to reduce the time that goes into designing the presentation. This way, you can concentrate on the message while our designers take care of providing you with the right template for the situation.

Customers Request Resolution And Response Time Administration Dashboard Mockup PDF
This slide covers resolution metrices for customer service request. It also includes average response time for support calls by IT team. Showcasing this set of slides titled Customers Request Resolution And Response Time Administration Dashboard Mockup PDF. The topics addressed in these templates are Frist Call Resolution, Unresolved Calls, Avg Response Time. All the content presented in this PPT design is completely editable. Download it and make adjustments in color, background, font etc. as per your unique business setting.
Business People Vector 3d Men With Bar Graph PowerPoint Slides
We present our business people vector 3d men with bar graph PowerPoint Slides.Use our People PowerPoint Templates because Our PowerPoint Templates and Slides are a sure bet. Gauranteed to win against all odds. Download and present our Business PowerPoint Templates because Our PowerPoint Templates and Slides will bullet point your ideas. See them fall into place one by one. Download and present our Flow Charts PowerPoint Templates because Our PowerPoint Templates and Slides are created by a hardworking bunch of busybees. Always flitting around with solutions gauranteed to please. Download our Marketing PowerPoint Templates because It can Bubble and burst with your ideas. Use our Shapes PowerPoint Templates because Our PowerPoint Templates and Slides will let you Leave a lasting impression to your audiences. They possess an inherent longstanding recall factor.Use these PowerPoint slides for presentations relating to 3d, accounting, analysis, bar, business, cartoon,cash, character, chart, clipart, committee, company, concept, corporate,council, directors, display, document, economics, executive, figure, finance,financial, goal, graph, group, growth, guy, human, humanoid, man, management,market, meeting, money, office, percentage, performance, pie, presentation, report,room, statistics, table, team. The prominent colors used in the PowerPoint template are Yellow, Black, Gray. Professionals tell us our business people vector 3d men with bar graph PowerPoint Slides have awesome images to get your point across. Professionals tell us our analysis PowerPoint templates and PPT Slides will help you be quick off the draw. Just enter your specific text and see your points hit home. People tell us our business people vector 3d men with bar graph PowerPoint Slides effectively help you save your valuable time. Customers tell us our bar PowerPoint templates and PPT Slides are effectively colour coded to prioritise your plans They automatically highlight the sequence of events you desire. The feedback we get is that our business people vector 3d men with bar graph PowerPoint Slides will generate and maintain the level of interest you desire. They will create the impression you want to imprint on your audience. Use our business PowerPoint templates and PPT Slides have awesome images to get your point across.

KPI Metrics Dashboard To Evaluate Facebook Video Campaign Performance Elements PDF
The following slide outlines a comprehensive KPI dashboard which can be used to analyze the performance of Facebook video campaign. It provides information about page video views, page video views organic etc.Deliver and pitch your topic in the best possible manner with this KPI Metrics Dashboard To Evaluate Facebook Video Campaign Performance Elements PDF. Use them to share invaluable insights on Custom Range, Page Video, Views Paid and impress your audience. This template can be altered and modified as per your expectations. So, grab it now.

Customer NPS Metric Dashboard For Call Centers Ppt Inspiration Smartart PDF
This slide shows net promoter score dashboard for call centers which contains occupancy rate, tickets unassigned, opened tickets, completed tickets and raised tickets. It also has details on resolution rate on first call, enquiries, etc. Pitch your topic with ease and precision using this Customer NPS Metric Dashboard For Call Centers Ppt Inspiration Smartart PDF. This layout presents information on Occupancy Rate, Resolution Rate, Net Promoter Score. It is also available for immediate download and adjustment. So, changes can be made in the color, design, graphics or any other component to create a unique layout.
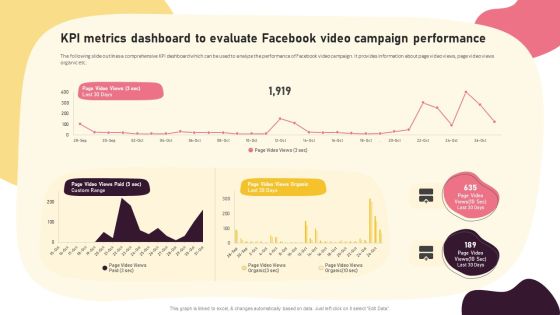
Video Promotion Techniques KPI Metrics Dashboard To Evaluate Facebook Video Introduction PDF
The following slide outlines a comprehensive KPI dashboard which can be used to analyze the performance of Facebook video campaign. It provides information about page video views, page video views organic etc. The best PPT templates are a great way to save time, energy, and resources. Slidegeeks have 100 percent editable powerpoint slides making them incredibly versatile. With these quality presentation templates, you can create a captivating and memorable presentation by combining visually appealing slides and effectively communicating your message. Download Video Promotion Techniques KPI Metrics Dashboard To Evaluate Facebook Video Introduction PDF from Slidegeeks and deliver a wonderful presentation.
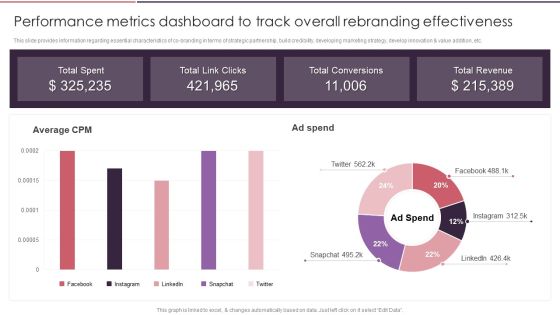
Rebranding Brand Fresh Face Development Performance Metrics Dashboard To Track Overall Rules PDF
This slide provides information regarding essential characteristics of co-branding in terms of strategic partnership, build credibility, developing marketing strategy, develop innovation and value addition, etc. Coming up with a presentation necessitates that the majority of the effort goes into the content and the message you intend to convey. The visuals of a PowerPoint presentation can only be effective if it supplements and supports the story that is being told. Keeping this in mind our experts created Rebranding Brand Fresh Face Development Performance Metrics Dashboard To Track Overall Rules PDF to reduce the time that goes into designing the presentation. This way, you can concentrate on the message while our designers take care of providing you with the right template for the situation.

Strengthening Brand Performance Metrics Dashboard To Track Overall Rebranding Themes PDF
This slide provides information regarding essential characteristics of co-branding in terms of strategic partnership, build credibility, developing marketing strategy, develop innovation and value addition, etc. Coming up with a presentation necessitates that the majority of the effort goes into the content and the message you intend to convey. The visuals of a PowerPoint presentation can only be effective if it supplements and supports the story that is being told. Keeping this in mind our experts created Strengthening Brand Performance Metrics Dashboard To Track Overall Rebranding Themes PDF to reduce the time that goes into designing the presentation. This way, you can concentrate on the message while our designers take care of providing you with the right template for the situation.

Inventory Stock Out And Decline Of Sales Analysis Dashboard Inspiration PDF
Following slide presents a key performance indicating dashboard that can be used by businesses to track Inventory stock out and lost sales. Major key performance indicators are percentage stockouts, amount of sales, lost sales accountability, etc. Pitch your topic with ease and precision using this Inventory Stock Out And Decline Of Sales Analysis Dashboard Inspiration PDF. This layout presents information on Lost Sales Summary, Stock Out Details It is also available for immediate download and adjustment. So, changes can be made in the color, design, graphics or any other component to create a unique layout.
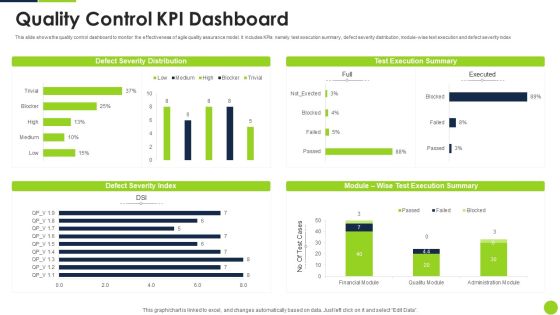
Agile Methodology Quality Control Quality Control KPI Dashboard Ppt Infographic Template Layout Ideas PDF
This slide shows the quality control dashboard to monitor the effectiveness of agile quality assurance model. It includes KPIs namely test execution summary, defect severity distribution, module-wise text execution and defect severity index Deliver an awe inspiring pitch with this creative agile methodology quality control quality control kpi dashboard ppt infographic template layout ideas pdf bundle. Topics like quality control kpi dashboard can be discussed with this completely editable template. It is available for immediate download depending on the needs and requirements of the user.

Applicant Selection Dashboard To Monitor Recruitment Process Sample PDF
This slide shows dashboard which can be used to track recruitment procedure status. It includes key performance indicators such as total open positions, total roles, selected applicant, application sources, etc. Pitch your topic with ease and precision using this Applicant Selection Dashboard To Monitor Recruitment Process Sample PDF. This layout presents information on Selection Rate, Recruitment Funnel, Application Sources. It is also available for immediate download and adjustment. So, changes can be made in the color, design, graphics or any other component to create a unique layout.

Safety Team Performance Management Dashboard With Key Kpis Rules PDF
This slide shows a dashboard representing performance measurement of the safety team of the organization on the basis of key performance indicators. It includes details related to safety team performance ranking, average result area scores etc. Pitch your topic with ease and precision using this Safety Team Performance Management Dashboard With Key Kpis Rules PDF. This layout presents information on Improve Corrective Actions, Safety Manager Objective, Conduct Risk Assessment. It is also available for immediate download and adjustment. So, changes can be made in the color, design, graphics or any other component to create a unique layout.

Kpi Dashboard To Measure Personal Banking Customer Relationship Themes PDF
This slide signifies the key performance indicator dashboard to monitor bank relationship with customers. It covers customer satisfaction rate by region, district and includes 12 month trends. Pitch your topic with ease and precision using this Kpi Dashboard To Measure Personal Banking Customer Relationship Themes PDF. This layout presents information on Customer Satisfaction, Best Demonstrated, Worst Demonstrated. It is also available for immediate download and adjustment. So, changes can be made in the color, design, graphics or any other component to create a unique layout.
Executive Dashboards For Tracking Financial Health Of Enterprise Diagrams PDF
This slide represents the CEO dashboard to track the financial health of an organization. It includes key performance indicators such as revenue, expenses, activity ratio, gross profit margin, EBIT etc. Pitch your topic with ease and precision using this Executive Dashboards For Tracking Financial Health Of Enterprise Diagrams PDF. This layout presents information on Revenue, Expense, Activity Ratio. It is also available for immediate download and adjustment. So, changes can be made in the color, design, graphics or any other component to create a unique layout.

Executive Dashboards To Track Sales Performance Guidelines PDF
This slide represents the CEO dashboard for tracking the sales performance of the organization. It includes key performance indicators such as gross, operating and net profit, sales amount by category, income statement etc. Pitch your topic with ease and precision using this Executive Dashboards To Track Sales Performance Guidelines PDF. This layout presents information on Income Statement, Monthly Sales Growth, Days Receivable Outstanding. It is also available for immediate download and adjustment. So, changes can be made in the color, design, graphics or any other component to create a unique layout.
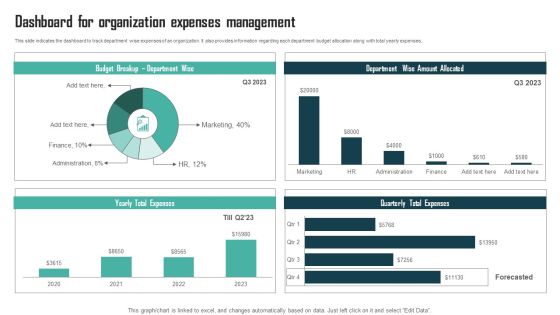
Expenses Management Plan Dashboard For Organization Expenses Management Mockup PDF
This slide indicates the dashboard to track department wise expenses of an organization. It also provides information regarding each department budget allocation along with total yearly expenses. Slidegeeks is one of the best resources for PowerPoint templates. You can download easily and regulate Expenses Management Plan Dashboard For Organization Expenses Management Mockup PDF for your personal presentations from our wonderful collection. A few clicks is all it takes to discover and get the most relevant and appropriate templates. Use our Templates to add a unique zing and appeal to your presentation and meetings. All the slides are easy to edit and you can use them even for advertisement purposes.

Ad Campaign Dashboard New Product Release Strategy Guidelines PDF
This slide depicts advertisement campaign dashboard used by fintech company managers to track effectiveness of the campaign for new product launch. The key performance indicators are ad cost, total clicks, total impressions, ad impressions etc. Pitch your topic with ease and precision using this Ad Campaign Dashboard New Product Release Strategy Guidelines PDF. This layout presents information on Impressions, Conversion, Strategy. It is also available for immediate download and adjustment. So, changes can be made in the color, design, graphics or any other component to create a unique layout.
Global Medicare Outpatients Inpatients Kpi Dashboard Template PDF
This slide shows global healthcare KPIs related to outpatients-inpatients through dashboard. It include Key performance indicators such as average global patients, average treatment cost etc. Pitch your topic with ease and precision using this Global Medicare Outpatients Inpatients Kpi Dashboard Template PDF. This layout presents information on Average Treatment Cost, Average Global Patients, Average Available Staff. It is also available for immediate download and adjustment. So, changes can be made in the color, design, graphics or any other component to create a unique layout.

Corporate Human Resource Audit Dashboard Introduction PDF
This slide illustrates HR statistics of a company. it includes department-wise strength, total salary, bonus, overtime, average performance, sick days etc. Showcasing this set of slides titled Corporate Human Resource Audit Dashboard Introduction PDF. The topics addressed in these templates are Human Resources, Department, Strength. All the content presented in this PPT design is completely editable. Download it and make adjustments in color, background, font etc. as per your unique business setting.
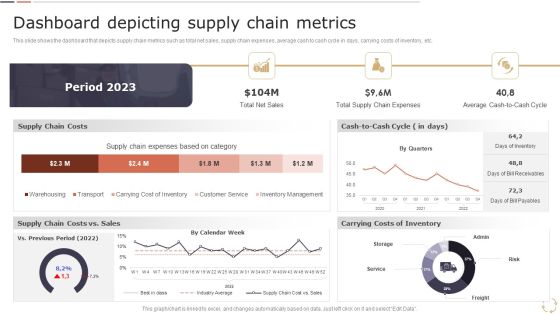
Optimizing Logistics Models To Enhance Supply Chain Management Dashboard Depicting Supply Chain Metrics Download PDF
This slide shows the dashboard that depicts supply chain metrics such as total net sales, supply chain expenses, average cash to cash cycle in days, carrying costs of inventory, etc. Coming up with a presentation necessitates that the majority of the effort goes into the content and the message you intend to convey. The visuals of a PowerPoint presentation can only be effective if it supplements and supports the story that is being told. Keeping this in mind our experts created Optimizing Logistics Models To Enhance Supply Chain Management Dashboard Depicting Supply Chain Metrics Download PDF to reduce the time that goes into designing the presentation. This way, you can concentrate on the message while our designers take care of providing you with the right template for the situation.

Customer Support Services Dashboard Depicting Performance Metrics Of Customer Designs PDF
This slide showcases dashboard depicting major customer service KPIs. The performance metrics covered are search exit rate, CSAT, average first response time, tickets solved, etc. Coming up with a presentation necessitates that the majority of the effort goes into the content and the message you intend to convey. The visuals of a PowerPoint presentation can only be effective if it supplements and supports the story that is being told. Keeping this in mind our experts created Customer Support Services Dashboard Depicting Performance Metrics Of Customer Designs PDF to reduce the time that goes into designing the presentation. This way, you can concentrate on the message while our designers take care of providing you with the right template for the situation.
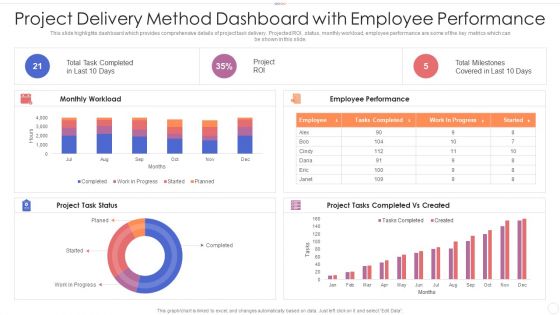
Project Delivery Method Dashboard With Employee Performance Introduction PDF
This slide highlights dashboard which provides comprehensive details of project task delivery. Projected ROI, status, monthly workload, employee performance are some of the key metrics which can be shown in this slide. Showcasing this set of slides titled project delivery method dashboard with employee performance introduction pdf. The topics addressed in these templates are project delivery method dashboard with employee performance. All the content presented in this PPT design is completely editable. Download it and make adjustments in color, background, font etc. as per your unique business setting.
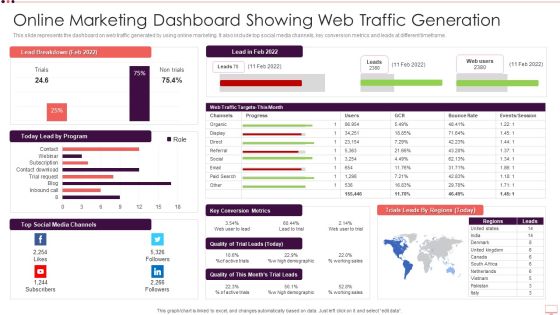
Online Marketing Dashboard Showing Web Traffic Generation Formats PDF
This slide represents the dashboard on web traffic generated by using online marketing. It also include top social media channels, key conversion metrics and leads at different timeframe. Showcasing this set of slides titled Online Marketing Dashboard Showing Web Traffic Generation Formats PDF. The topics addressed in these templates are Online Marketing Dashboard Showing Web Traffic Generation. All the content presented in this PPT design is completely editable. Download it and make adjustments in color, background, font etc. as per your unique business setting.

Analytics Dashboard To Evaluate Digital Marketing Performance Mockup PDF
The purpose of this slide is to exhibits a dashboard which can be used to examine the marketing performance. The metrics covered in the dashboard are bounce rate, page views, new sessions, total time spent on site, email marketing performance etc. Showcasing this set of slides titled Analytics Dashboard To Evaluate Digital Marketing Performance Mockup PDF. The topics addressed in these templates are Conversion Funnel, Target, Marketing Performance. All the content presented in this PPT design is completely editable. Download it and make adjustments in color, background, font etc. as per your unique business setting.
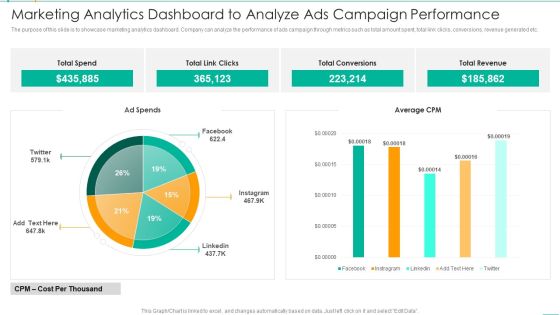
Marketing Analytics Dashboard To Analyze Ads Campaign Performance Microsoft PDF
The purpose of this slide is to showcase marketing analytics dashboard. Company can analyze the performance of ads campaign through metrics such as total amount spent, total link clicks, conversions, revenue generated etc. Showcasing this set of slides titled Marketing Analytics Dashboard To Analyze Ads Campaign Performance Microsoft PDF. The topics addressed in these templates are Marketing Analytics Dashboard To Analyze Ads Campaign Performance. All the content presented in this PPT design is completely editable. Download it and make adjustments in color, background, font etc. as per your unique business setting.
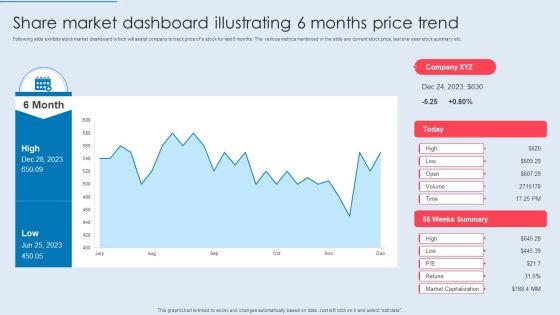
Share Market Dashboard Illustrating 6 Months Price Trend Ideas PDF
Following slide exhibits stock market dashboard which will assist company to track price of a stock for last 6 months. The various metrics mentioned in the slide are current stock price, last one year stock summary etc. Showcasing this set of slides titled Share Market Dashboard Illustrating 6 Months Price Trend Ideas PDF. The topics addressed in these templates are Share Market, Dashboard Illustrating, Months Price Trend. All the content presented in this PPT design is completely editable. Download it and make adjustments in color, background, font etc. as per your unique business setting.
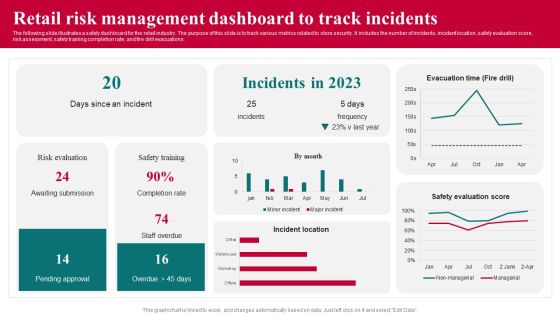
Retail Risk Management Dashboard To Track Incidents Professional PDF
The following slide illustrates a safety dashboard for the retail industry. The purpose of this slide is to track various metrics related to store security. It includes the number of incidents, incident location, safety evaluation score,risk assessment, safety training completion rate, and fire drill evacuations. Showcasing this set of slides titled Retail Risk Management Dashboard To Track Incidents Professional PDF. The topics addressed in these templates are Risk Evaluation, Retail Risk Management Dashboard, Track Incidents. All the content presented in this PPT design is completely editable. Download it and make adjustments in color, background, font etc. as per your unique business setting.
Monthly Sales Performance Tracking And Monitoring Dashboard Inspiration PDF
This slide showcases a dashboard presenting various metrics to measure and analyze sales performance for revenue growth. It includes key components such as number of sales, revenue, profit, cost, sales revenue, sales increment, cost analysis and cross sell. Coming up with a presentation necessitates that the majority of the effort goes into the content and the message you intend to convey. The visuals of a PowerPoint presentation can only be effective if it supplements and supports the story that is being told. Keeping this in mind our experts created Monthly Sales Performance Tracking And Monitoring Dashboard Inspiration PDF to reduce the time that goes into designing the presentation. This way, you can concentrate on the message while our designers take care of providing you with the right template for the situation.
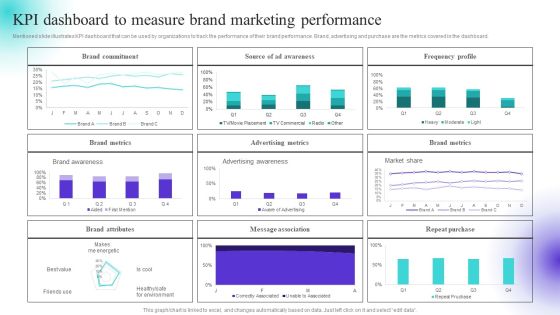
KPI Dashboard To Measure Brand Marketing Performance Inspiration PDF
Mentioned slide illustrates KPI dashboard that can be used by organizations to track the performance of their brand performance. Brand, advertising and purchase are the metrics covered in the dashboard. Boost your pitch with our creative KPI Dashboard To Measure Brand Marketing Performance Inspiration PDF. Deliver an awe inspiring pitch that will mesmerize everyone. Using these presentation templates you will surely catch everyones attention. You can browse the ppts collection on our website. We have researchers who are experts at creating the right content for the templates. So you do not have to invest time in any additional work. Just grab the template now and use them.

Train Employees Health Safety Dashboard Ppt Model Layout Ideas PDF
Presenting this set of slides with name train employees health safety dashboard ppt model layout ideas pdf. This is a three stage process. The stages in this process are low, medium, high. This is a completely editable PowerPoint presentation and is available for immediate download. Download now and impress your audience.

Preventive Measures Workplace Dashboard Ppt Ideas Demonstration PDF
Presenting this set of slides with name preventive measures workplace dashboard ppt ideas demonstration pdf. This is a three stage process. The stages in this process are low, medium, high. This is a completely editable PowerPoint presentation and is available for immediate download. Download now and impress your audience.

Computer Security Incident Handling Dashboard Ppt Model Introduction PDF
Presenting this set of slides with name computer security incident handling dashboard ppt model introduction pdf. This is a three stage process. The stages in this process are minimum, medium, maximum. This is a completely editable PowerPoint presentation and is available for immediate download. Download now and impress your audience.

Cyber Security Implementation Framework Dashboard Ppt Gallery Template PDF
Presenting this set of slides with name cyber security implementation framework dashboard ppt gallery template pdf. This is a three stage process. The stages in this process are minimum, medium, maximum. This is a completely editable PowerPoint presentation and is available for immediate download. Download now and impress your audience.

Brand Building Brand Performance Dashboard Ppt Icon Diagrams PDF
Presenting this set of slides with name brand building brand performance dashboard ppt icon diagrams pdf. This is a three stage process. The stages in this process are customer recognition, enhanced sales, competitive edge. This is a completely editable PowerPoint presentation and is available for immediate download. Download now and impress your audience.

Brand Identity How Build It Dashboard Ppt Summary Clipart PDF
Presenting this set of slides with name brand identity how build it dashboard ppt summary clipart pdf. This is a three stage process. The stages in this process are low, medium, high. This is a completely editable PowerPoint presentation and is available for immediate download. Download now and impress your audience.
 Home
Home