Data Report

Implementing Marketing Strategies Framework To Evaluate Target Markets For Viability Pictures PDF
This template covers framework to evaluate viability for target markets. It includes three phases of such as identify target market, prospective positioning and plan implementation. It also includes key elements such as identifying consumer needs and potential markets, examine industry environment, conduct competitors analysis etc. The Implementing Marketing Strategies Framework To Evaluate Target Markets For Viability Pictures PDF is a compilation of the most recent design trends as a series of slides. It is suitable for any subject or industry presentation, containing attractive visuals and photo spots for businesses to clearly express their messages. This template contains a variety of slides for the user to input data, such as structures to contrast two elements, bullet points, and slides for written information. Slidegeeks is prepared to create an impression.
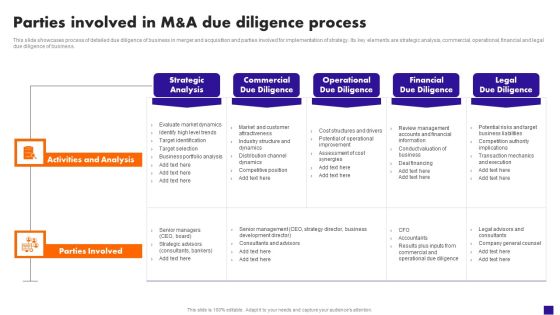
Parties Involved In M And A Due Diligence Process Clipart PDF
This slide showcases process of detailed due diligence of business in merger and acquisition and parties involved for implementation of strategy. Its key elements are strategic analysis, commercial, operational, financial and legal due diligence of business. The Parties Involved In M And A Due Diligence Process Clipart PDF is a compilation of the most recent design trends as a series of slides. It is suitable for any subject or industry presentation, containing attractive visuals and photo spots for businesses to clearly express their messages. This template contains a variety of slides for the user to input data, such as structures to contrast two elements, bullet points, and slides for written information. Slidegeeks is prepared to create an impression.

Online Advertising Campaign For Brand Recognition Selection Criteria Of SEO Tools For Website Optimization Inspiration PDF
This slide represents various SEO tools that enables marketers to monitor overall health and ranking of website. It cover features for tool such as keyword research, keyword mapping. SEO audit, rank tracking and backlink analysis. The Online Advertising Campaign For Brand Recognition Selection Criteria Of SEO Tools For Website Optimization Inspiration PDF is a compilation of the most recent design trends as a series of slides. It is suitable for any subject or industry presentation, containing attractive visuals and photo spots for businesses to clearly express their messages. This template contains a variety of slides for the user to input data, such as structures to contrast two elements, bullet points, and slides for written information. Slidegeeks is prepared to create an impression.

Adjusting Financial Strategies And Planning Measuring Business Earnings With Profitability Ratios Download PDF
This slide provides glimpse about profitability ratio analysis for calculating our firms business earnings and net profit margin. It includes quarterly gross profit margin, quarterly net profit margin, key insights, etc. The Adjusting Financial Strategies And Planning Measuring Business Earnings With Profitability Ratios Download PDF is a compilation of the most recent design trends as a series of slides. It is suitable for any subject or industry presentation, containing attractive visuals and photo spots for businesses to clearly express their messages. This template contains a variety of slides for the user to input data, such as structures to contrast two elements, bullet points, and slides for written information. Slidegeeks is prepared to create an impression.

Planning Transnational Technique To Improve International Scope New Market Target Audience Segmentation Icons PDF
This slide covers target market segmentation analysis for global expansion. It includes segments such as geographic, demographic, psychographic, and behavioral. It also includes segment criteria such as region, density, age, gender, income, etc. The Planning Transnational Technique To Improve International Scope New Market Target Audience Segmentation Icons PDF is a compilation of the most recent design trends as a series of slides. It is suitable for any subject or industry presentation, containing attractive visuals and photo spots for businesses to clearly express their messages. This template contains a variety of slides for the user to input data, such as structures to contrast two elements, bullet points, and slides for written information. Slidegeeks is prepared to create an impression.

Leveraging Openai API For Business Overview Openai Application Programming Interface Portrait PDF
This slide showcases introduction to OpenAIs API Application Programming Interface which can help businesses in transforming their digital tasks through automation. It provides details about natural language processing NLP, language translation, sentiment analysis, etc. The Leveraging Openai API For Business Overview Openai Application Programming Interface Portrait PDF is a compilation of the most recent design trends as a series of slides. It is suitable for any subject or industry presentation, containing attractive visuals and photo spots for businesses to clearly express their messages. This template contains a variety of slides for the user to input data, such as structures to contrast two elements, bullet points, and slides for written information. Slidegeeks is prepared to create an impression.

Select Best Social Media Platform For Campaign Launch Ppt Infographics Format Ideas PDF
The following slide depicts the comparative analysis of social media platforms to run search engine marketing campaign and get best results. It includes key elements such as demographics, purchase intent, marketing resources, Facebook, google, Instagram, LinkedIn etc. The Select Best Social Media Platform For Campaign Launch Ppt Infographics Format Ideas PDF is a compilation of the most recent design trends as a series of slides. It is suitable for any subject or industry presentation, containing attractive visuals and photo spots for businesses to clearly express their messages. This template contains a variety of slides for the user to input data, such as structures to contrast two elements, bullet points, and slides for written information. Slidegeeks is prepared to create an impression.

Formulating International Promotional Campaign Strategy Step 1 Perform Market Research To Evaluate Potential Template PDF
This slide represents first step in international marketing plan i.e. performing marketing assessment and evaluation to find its potential and effectiveness. It includes market growth, competitive analysis, potential risk etc. The Formulating International Promotional Campaign Strategy Step 1 Perform Market Research To Evaluate Potential Template PDF is a compilation of the most recent design trends as a series of slides. It is suitable for any subject or industry presentation, containing attractive visuals and photo spots for businesses to clearly express their messages. This template contains a variety of slides for the user to input data, such as structures to contrast two elements, bullet points, and slides for written information. Slidegeeks is prepared to create an impression.
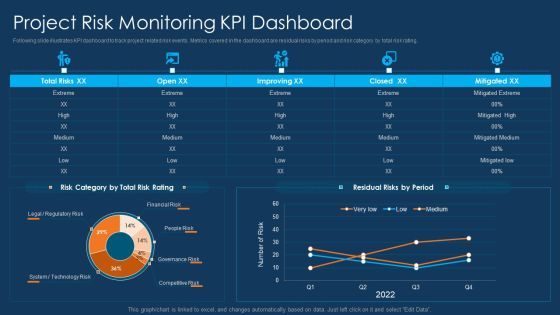
Information Technology Project Initiation Project Risk Monitoring Kpi Dashboard Background PDF
Following slide illustrates KPI dashboard to track project related risk events. Metrics covered in the dashboard are residual risks by period and risk category by total risk rating. Deliver and pitch your topic in the best possible manner with this information technology project initiation project risk monitoring kpi dashboard background pdf. Use them to share invaluable insights on project risk monitoring kpi dashboard and impress your audience. This template can be altered and modified as per your expectations. So, grab it now.

3 Converging Steps Of Flow Information Arrow Diagram Cycle Chart PowerPoint Templates
We present our 3 converging steps of flow information arrow diagram Cycle Chart PowerPoint templates.Present our Arrows PowerPoint Templates because the NASA Space programme took mankind to the moon and so much more. Like them you too can look far beyond normal boundaries. Show them that in your mind the sky is certainly not the limit. Present our Circle Charts PowerPoint Templates because this template project the knowledge gained to your colleagues to guide them along the way in days to come. Use our Shapes PowerPoint Templates because you have the ideas and plans on how to achieve success. Download and present our Business PowerPoint Templates because your ideas too are pinpointedly focused on you goals. Present our Flow Charts PowerPoint Templates because you can Transmit your passion via our creative templates.Use these PowerPoint slides for presentations relating to abstract, arrow, business, chart, circle, circular, collection, color, continuity, cycle, decoration, design, diagram, dimensional, direction, element, flow, glossy, graph, icon, illustration, isolated, modern, motion, movement, pattern, pie, recycling, repetition, report, ring, round, scheme, section, set, shape, shiny, sign, slice, spinning, symbol, turn, vector, web. The prominent colors used in the PowerPoint template are Brown, Green, Blue. Presenters tell us our 3 converging steps of flow information arrow diagram Cycle Chart PowerPoint templates are Stunning. You can be sure our color PowerPoint templates and PPT Slides are Bright. Professionals tell us our 3 converging steps of flow information arrow diagram Cycle Chart PowerPoint templates are Nice. People tell us our circular PowerPoint templates and PPT Slides are Dazzling. People tell us our 3 converging steps of flow information arrow diagram Cycle Chart PowerPoint templates are Dynamic. Professionals tell us our color PowerPoint templates and PPT Slides are Tasteful.
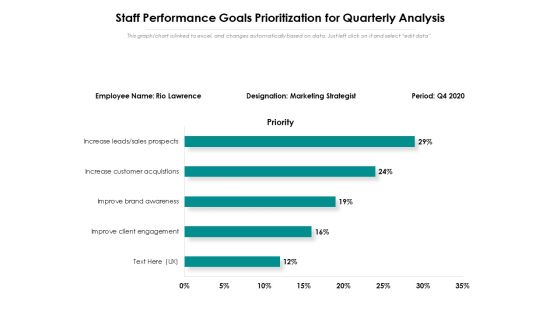
Staff Performance Goals Prioritization For Quarterly Analysis Ppt PowerPoint Presentation Pictures Infographics PDF
Presenting this set of slides with name staff performance goals prioritization for quarterly analysis ppt powerpoint presentation pictures infographics pdf. The topics discussed in these slides are employee name, rio lawrence, designation marketing strategist, period q4 2020, improve client engagement, improve brand awareness, increase customer acquisitions, increase leads, sales prospects. This is a completely editable PowerPoint presentation and is available for immediate download. Download now and impress your audience.
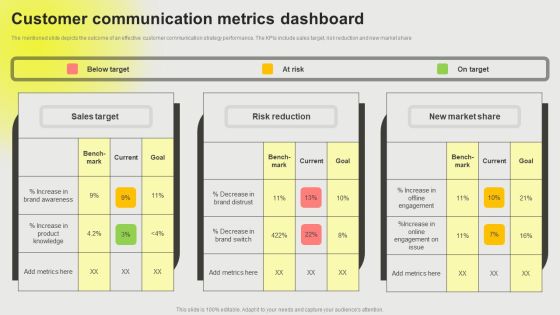
Developing A Successful Business Communication Plan Customer Communication Metrics Dashboard Download PDF
The mentioned slide depicts the outcome of an effective customer communication strategy performance. The KPIs include sales target, risk reduction and new market share Whether you have daily or monthly meetings, a brilliant presentation is necessary. Developing A Successful Business Communication Plan Customer Communication Metrics Dashboard Download PDF can be your best option for delivering a presentation. Represent everything in detail using Developing A Successful Business Communication Plan Customer Communication Metrics Dashboard Download PDF and make yourself stand out in meetings. The template is versatile and follows a structure that will cater to your requirements. All the templates prepared by Slidegeeks are easy to download and edit. Our research experts have taken care of the corporate themes as well. So, give it a try and see the results.

Cloud Based Computing Analysis Cloud Performance Tracking Dashboard Structure PDF
This slide covers the key performance indicators for tracking performance of the cloud such as violations break down, sources, rules and severity. Get a simple yet stunning designed Cloud Based Computing Analysis Cloud Performance Tracking Dashboard Structure PDF. It is the best one to establish the tone in your meetings. It is an excellent way to make your presentations highly effective. So, download this PPT today from Slidegeeks and see the positive impacts. Our easy-to-edit Cloud Based Computing Analysis Cloud Performance Tracking Dashboard Structure PDF can be your go-to option for all upcoming conferences and meetings. So, what are you waiting for Grab this template today.
Monthly Retail Stock Performance Dashboard Icons PDF
This slide shows monthly inventory performance of retail products for analyzing monthly in stock an out-stock with their values. It include metrics like current inventory available, current inventory value and closing monthly stock etc. Showcasing this set of slides titled Monthly Retail Stock Performance Dashboard Icons PDF. The topics addressed in these templates are Current Inventory Available, Current Inventory Value. All the content presented in this PPT design is completely editable. Download it and make adjustments in color, background, font etc. as per your unique business setting.

Organizational Advisory Solutions Business Profile Our Research Approach To Deliver Solutions Elements PDF
This slide covers the approach to deliver research solutions which includes client needs analysis, customized research, research methodology and data, output for strategic decision, etc. Welcome to our selection of the Organizational Advisory Solutions Business Profile Our Research Approach To Deliver Solutions Elements PDF. These are designed to help you showcase your creativity and bring your sphere to life. Planning and Innovation are essential for any business that is just starting out. This collection contains the designs that you need for your everyday presentations. All of our PowerPoints are 100 percent editable, so you can customize them to suit your needs. This multi purpose template can be used in various situations. Grab these presentation templates today.

Consumer Lead Generation Process Benefits Of Using Lead Management Software Brochure PDF
This slide covers the lead management software advantages such as collecting essential lead data, real-time lead analysis, regular follow-ups, collaboration with the sales team, automation, and keeping track of all interactions. Slidegeeks is one of the best resources for PowerPoint templates. You can download easily and regulate Consumer Lead Generation Process Benefits Of Using Lead Management Software Brochure PDF for your personal presentations from our wonderful collection. A few clicks is all it takes to discover and get the most relevant and appropriate templates. Use our Templates to add a unique zing and appeal to your presentation and meetings. All the slides are easy to edit and you can use them even for advertisement purposes.

Benefits Of Using Lead Management Software Enhancing Client Lead Conversion Rates Elements PDF
This slide covers the lead management software advantages such as collecting essential lead data, real-time lead analysis, regular follow-ups, collaboration with the sales team, automation, and keeping track of all interactions. Crafting an eye catching presentation has never been more straightforward. Let your presentation shine with this tasteful yet straightforward Benefits Of Using Lead Management Software Enhancing Client Lead Conversion Rates Elements PDF template. It offers a minimalistic and classy look that is great for making a statement. The colors have been employed intelligently to add a bit of playfulness while still remaining professional. Construct the ideal Benefits Of Using Lead Management Software Enhancing Client Lead Conversion Rates Elements PDF that effortlessly grabs the attention of your audience Begin now and be certain to wow your customers.

Benefits Of Using Lead Management Software Improving Lead Generation Process Inspiration PDF
This slide covers the lead management software advantages such as collecting essential lead data, real-time lead analysis, regular follow-ups, collaboration with the sales team, automation, and keeping track of all interactions. Crafting an eye catching presentation has never been more straightforward. Let your presentation shine with this tasteful yet straightforward Benefits Of Using Lead Management Software Improving Lead Generation Process Inspiration PDF template. It offers a minimalistic and classy look that is great for making a statement. The colors have been employed intelligently to add a bit of playfulness while still remaining professional. Construct the ideal Benefits Of Using Lead Management Software Improving Lead Generation Process Inspiration PDF that effortlessly grabs the attention of your audience Begin now and be certain to wow your customers.

Dashboard For Tracking Mobile Commercial Banking Marketing Campaign Performance Slides PDF
This slide depicts a dashboard for tracking performance of marketing campaigns of mobile banking across paid media channels. The key performing indicators are client acquisition metrics, client conversion metrics, expense metrics among many others. Showcasing this set of slides titled Dashboard For Tracking Mobile Commercial Banking Marketing Campaign Performance Slides PDF. The topics addressed in these templates are Dashboard For Tracking Mobile, Commercial Banking, Marketing Campaign Performance. All the content presented in this PPT design is completely editable. Download it and make adjustments in color, background, font etc. as per your unique business setting.

Crm Dashboard Intranet Dashboard Ppt PowerPoint Presentation Information
This is a crm dashboard intranet dashboard ppt powerpoint presentation information. This is a five stage process. The stages in this process are informatics, research, practice, network, expertise.

Satisfying Consumers Through Strategic Product Building Plan Dashboard Depicting Product Usage Metrics Inspiration PDF
This slide represents the dashboard that depicts product usage metrics that includes usage statistics, users and sessions on the basis of countries, events trends, product loyalty, product usage by city. Deliver and pitch your topic in the best possible manner with this satisfying consumers through strategic product building plan dashboard depicting product usage metrics inspiration pdf. Use them to share invaluable insights on dashboard depicting product usage metrics and impress your audience. This template can be altered and modified as per your expectations. So, grab it now.

Market Research To Determine Business Opportunities Brand Analytics KPI Dashboard For Organization Inspiration PDF
The following slide outlines key performance indicator KPI dashboard that can assist marketers to evaluate brand performance on social media channels. The metrics covered are age group, gender, brand perception, branding themes, celebrity analysis, etc. There are so many reasons you need a Market Research To Determine Business Opportunities Brand Analytics KPI Dashboard For Organization Inspiration PDF. The first reason is you cannot spend time making everything from scratch, Thus, Slidegeeks has made presentation templates for you too. You can easily download these templates from our website easily.
Effective NPO Promotional Strategies For Recruit Volunteers Visual Storytelling To Deliver Impactful Message Elements PDF
This slide provides an overview of the content marketing strategy adopted by nonprofits to convey the message. The slide includes goals and tips which are use case studies, repurpose the content and make an emotional appeal. The Effective NPO Promotional Strategies For Recruit Volunteers Visual Storytelling To Deliver Impactful Message Elements PDF is a compilation of the most recent design trends as a series of slides. It is suitable for any subject or industry presentation, containing attractive visuals and photo spots for businesses to clearly express their messages. This template contains a variety of slides for the user to input data, such as structures to contrast two elements, bullet points, and slides for written information. Slidegeeks is prepared to create an impression.

Investment Project Performance Analysis KPI Dashboard Professional PDF
This slide showcases KPI dashboard for project planning and resource allocation. It also include metrics such as invested amount, return amount, NPV, return to investor, annualized IRR, ROI, payback period, etc. Pitch your topic with ease and precision using this Investment Project Performance Analysis KPI Dashboard Professional PDF. This layout presents information on Project Cash Flows, Project Performance, Innovation Lab. It is also available for immediate download and adjustment. So, changes can be made in the color, design, graphics or any other component to create a unique layout.
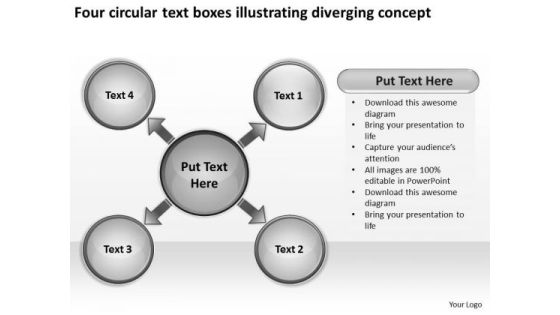
Four Circular Text Boxes Illustrating Diverging Concept Pie Network PowerPoint Templates
We present our four circular text boxes illustrating diverging concept Pie Network PowerPoint templates.Download and present our Ring Charts PowerPoint Templates because this shows ideas to get the different elements of your Business to mesh and coalesce into a focused team driven by a common goal to achieve the common aim with Excellence. Present our Process and Flows PowerPoint Templates because it Educates your team with your thoughts and logic. Present our Circle Charts PowerPoint Templates because all for one and one for all. Download our Shapes PowerPoint Templates because knowledge is power goes the popular saying. Use our Future PowerPoint Templates because let this slide illustrates others piggyback on you to see well over the horizon.Use these PowerPoint slides for presentations relating to Circle, colors, concept,contemporary, corporate, cycle, data,design, detail, development, diagram, engineering, graphic, ideas,implement, implementation,management, model, modern,process,product, professional, project, quality,schema, set, software, stack, stage,steps, strategy,success,system, tag, team. The prominent colors used in the PowerPoint template are Gray, White, Black. Customers tell us our four circular text boxes illustrating diverging concept Pie Network PowerPoint templates are Efficacious. Customers tell us our detail PowerPoint templates and PPT Slides are Charming. Customers tell us our four circular text boxes illustrating diverging concept Pie Network PowerPoint templates will help them to explain complicated concepts. People tell us our design PowerPoint templates and PPT Slides are Radiant. Customers tell us our four circular text boxes illustrating diverging concept Pie Network PowerPoint templates are Fantastic. Customers tell us our cycle PowerPoint templates and PPT Slides are Quaint.

Sales Opportunity Metrics Template Presentation Design
This is a sales opportunity metrics template presentation design. This is a three stage process. The stages in this process are sales status, sales opportunities, sales product performance.
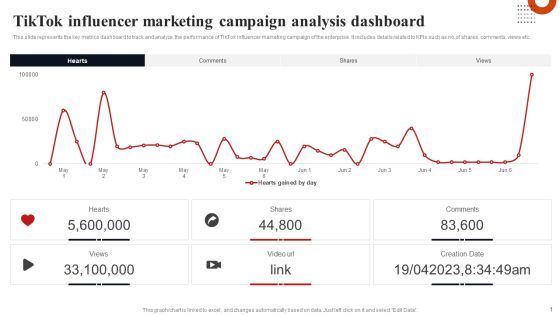
Tiktok Influencer Marketing Campaign Analysis Dashboard Formats PDF
This slide represents the key metrics dashboard to track and analyze the performance of TikTok influencer marketing campaign of the enterprise. It includes details related to KPIs such as no.of shares, comments, views etc. Formulating a presentation can take up a lot of effort and time, so the content and message should always be the primary focus. The visuals of the PowerPoint can enhance the presenters message, so our Tiktok Influencer Marketing Campaign Analysis Dashboard Formats PDF was created to help save time. Instead of worrying about the design, the presenter can concentrate on the message while our designers work on creating the ideal templates for whatever situation is needed. Slidegeeks has experts for everything from amazing designs to valuable content, we have put everything into Tiktok Influencer Marketing Campaign Analysis Dashboard Formats PDF.
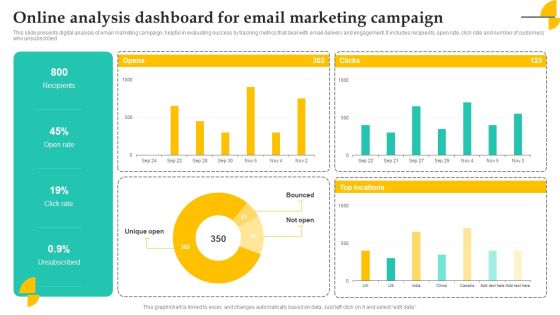
Online Analysis Dashboard For Email Marketing Campaign Elements PDF
This slide presents digital analysis of email marketing campaign, helpful in evaluating success by tracking metrics that deal with email delivery and engagement. It includes recipients, open rate, click rate and number of customers who unsubscribed Showcasing this set of slides titled Online Analysis Dashboard For Email Marketing Campaign Elements PDF. The topics addressed in these templates are Recipients, Open Rate, Campaign. All the content presented in this PPT design is completely editable. Download it and make adjustments in color, background, font etc. as per your unique business setting.
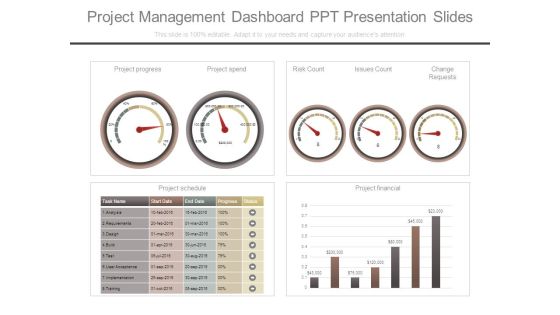
Project Management Dashboard Ppt Presentation Slides
This is a project management dashboard ppt presentation slides. This is a four stage process. The stages in this process are project progress, project spend, risk count, issues count, change requests, project schedule, project financial, task name, start date, end date, progress, status, analysis, requirements, design, build, test, user acceptance, implementation, training.

Google Cloud Service Models Google Cloud Platform Services Overview Information PDF
This slide talks about the overview of google cloud platform services. The purpose of this slide is to demonstrate the various google cloud platform services. The services include compute, management, networking, storage and database, big data, identity and security, and machine learning. Coming up with a presentation necessitates that the majority of the effort goes into the content and the message you intend to convey. The visuals of a PowerPoint presentation can only be effective if it supplements and supports the story that is being told. Keeping this in mind our experts created Google Cloud Service Models Google Cloud Platform Services Overview Information PDF to reduce the time that goes into designing the presentation. This way, you can concentrate on the message while our designers take care of providing you with the right template for the situation.

Cost Saving With Agile Methodology IT Agile Dashboard For Tracking Sprint Progress Mockup PDF
Mentioned slide displays agile dashboard that can be used by organization to track sprint progress. KPIs covered here are overall sprint progress, statistics by priority and statistics by status.Deliver an awe inspiring pitch with this creative cost saving with agile methodology it agile dashboard for tracking sprint progress mockup pdf bundle. Topics like statistics by priority, contract review, statistics by status can be discussed with this completely editable template. It is available for immediate download depending on the needs and requirements of the user.
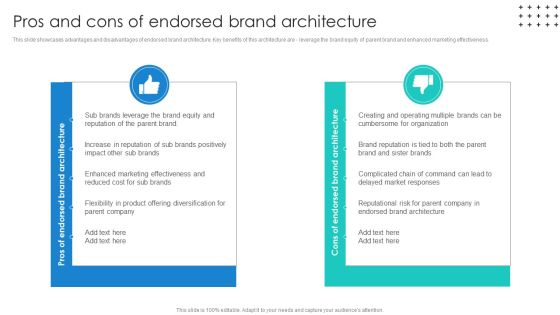
Promotional Techniques To Market Several Brands Among Target Groups Pros And Cons Of Endorsed Inspiration PDF
This slide showcases advantages and disadvantages of endorsed brand architecture. Key benefits of this architecture are - leverage the brand equity of parent brand and enhanced marketing effectiveness. The Promotional Techniques To Market Several Brands Among Target Groups Pros And Cons Of Endorsed Inspiration PDF is a compilation of the most recent design trends as a series of slides. It is suitable for any subject or industry presentation, containing attractive visuals and photo spots for businesses to clearly express their messages. This template contains a variety of slides for the user to input data, such as structures to contrast two elements, bullet points, and slides for written information. Slidegeeks is prepared to create an impression.

Strategies For Flipping Houses For Maximum Revenue Key House Flipping Mistakes And Remedies To Overcome Elements PDF
This slide represents key mistake made by house flippers during fix and flip process along with remedies. It covers no or low financial power, time investment, inexperience etc. The Strategies For Flipping Houses For Maximum Revenue Key House Flipping Mistakes And Remedies To Overcome Elements PDF is a compilation of the most recent design trends as a series of slides. It is suitable for any subject or industry presentation, containing attractive visuals and photo spots for businesses to clearly express their messages. This template contains a variety of slides for the user to input data, such as structures to contrast two elements, bullet points, and slides for written information. Slidegeeks is prepared to create an impression.

Pre School Marketing Strategy To Enhance Enrollment Rate Sample Of Buyers Persona For Preschool Formats PDF
This slide showcases a buyers persona sample of preschool audience to determine customer needs and requirements. It showcases components such as goals, pain points, details, key influencers and motivations. The Pre School Marketing Strategy To Enhance Enrollment Rate Sample Of Buyers Persona For Preschool Formats PDF is a compilation of the most recent design trends as a series of slides. It is suitable for any subject or industry presentation, containing attractive visuals and photo spots for businesses to clearly express their messages. This template contains a variety of slides for the user to input data, such as structures to contrast two elements, bullet points, and slides for written information. Slidegeeks is prepared to create an impression.

5 Step Guide For Transitioning To Blue Ocean Strategy Four Hurdles To Strategy Execution Mockup PDF
This template cover four types of hurdles to strategy execution that companies can face while developing a blue ocean strategy with a profitable business model. The 4 type of hurdles are cognitive hurdle, resource hurdle, motivational hurdle and political hurdle. The 5 Step Guide For Transitioning To Blue Ocean Strategy Four Hurdles To Strategy Execution Mockup PDF is a compilation of the most recent design trends as a series of slides. It is suitable for any subject or industry presentation, containing attractive visuals and photo spots for businesses to clearly express their messages. This template contains a variety of slides for the user to input data, such as structures to contrast two elements, bullet points, and slides for written information. Slidegeeks is prepared to create an impression.
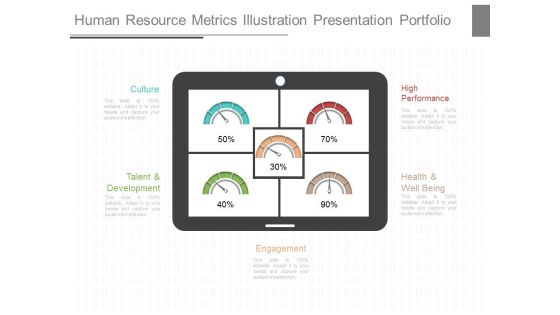
Human Resource Metrics Illustration Presentation Portfolio
This is a human resource metrics illustration presentation portfolio. This is a five stage process. The stages in this process are culture, high performance, talent and development, health and well being, engagement.

Business Performance Review Financial Performance Ppt PowerPoint Presentation Complete Deck
Presenting this set of slides with name business performance review financial performance ppt powerpoint presentation complete deck. The topics discussed in these slides are financial, performance, dashboard, employee, optimization. This is a completely editable PowerPoint presentation and is available for immediate download. Download now and impress your audience.
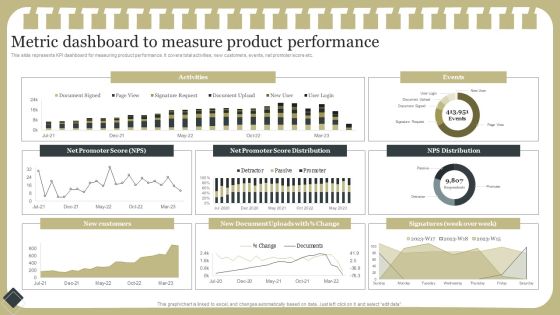
Effective Product Development Strategy Metric Dashboard To Measure Product Performance Information PDF
This slide represents KPI dashboard for measuring product performance. It covers total activities, new customers, events, net promoter score etc.Coming up with a presentation necessitates that the majority of the effort goes into the content and the message you intend to convey. The visuals of a PowerPoint presentation can only be effective if it supplements and supports the story that is being told. Keeping this in mind our experts created Effective Product Development Strategy Metric Dashboard To Measure Product Performance Information PDF to reduce the time that goes into designing the presentation. This way, you can concentrate on the message while our designers take care of providing you with the right template for the situation.

Enhance Profit Client Journey Analysis Email Engagement Dashboard Slides PDF
Email engagement metrics help you understand which email campaigns saw the highest open rate and click-through rate. It also gives you an idea of how different age groups interact with your emails helping you customize the content accordingly. Deliver and pitch your topic in the best possible manner with this enhance profit client journey analysis email engagement dashboard slides pdf. Use them to share invaluable insights on engagement over time by age of profile, open rate by age of profile and impress your audience. This template can be altered and modified as per your expectations. So, grab it now.

Dashboard Meausrement Ppt PowerPoint Presentation Portfolio Visual Aids
Presenting this set of slides with name dashboard meausrement ppt powerpoint presentation portfolio visual aids. This is a stage process. The stages in this process are dashboard, marketing, management, investment, analysis. This is a completely editable PowerPoint presentation and is available for immediate download. Download now and impress your audience.

3d Stages Of Process Analysis 8 Concepts Circular Flow Chart PowerPoint Slides
We present our 3d stages of process analysis 8 concepts Circular Flow Chart PowerPoint Slides.Use our Business PowerPoint Templates because it helps you to project your enthusiasm and single mindedness to your colleagues. Present our Circle Charts PowerPoint Templates because you should explain the process by which you intend to right it. Present our Shapes PowerPoint Templates because it outlines the process with this innovative graphic to authenticate your plan of achieving the goal of added value/profit. Present our Process and Flows PowerPoint Templates because it shows how one can contribute to the overall feeling of well-being. Download our Success PowerPoint Templates because iT outlines the entire thought process for the benefit of others. Tell it to the world with your characteristic aplomb.Use these PowerPoint slides for presentations relating to Abstract, arrow,blank, business, chart, circle, concept,connection, cycle, development,diagram, direction, element,environment, exchange, finance,financial, flow, graph, graphic, graphicpresentation, group, icon, illustration,investment, isolated, isometric, market,motion, movement, organization, p perspective, presentation,process, processchart, recycle, report,ring, sign, step, stock, success, symbol. The prominent colors used in the PowerPoint template are Blue light, Gray, White. The feedback we get is that our 3d stages of process analysis 8 concepts Circular Flow Chart PowerPoint Slides are Enchanting. The feedback we get is that our concept PowerPoint templates and PPT Slides are Clever. Presenters tell us our 3d stages of process analysis 8 concepts Circular Flow Chart PowerPoint Slides are Vintage. The feedback we get is that our blank PowerPoint templates and PPT Slides are Clever. PowerPoint presentation experts tell us our 3d stages of process analysis 8 concepts Circular Flow Chart PowerPoint Slides are Adorable. Customers tell us our concept PowerPoint templates and PPT Slides are Ultra.

Augmented Intelligence Tools And Applications IT Why Does Artificial Intelligence Fall Short Information PDF
This slide represents why artificial intelligence falls short for the online verification process. The online verification process includes the need for big data, the number of ID types and subtypes, blurriness, bad lighting and glare, the challenge of omnichannel, etc. This Augmented Intelligence Tools And Applications IT Why Does Artificial Intelligence Fall Short Information PDF is perfect for any presentation, be it in front of clients or colleagues. It is a versatile and stylish solution for organizing your meetings. The Augmented Intelligence Tools And Applications IT Why Does Artificial Intelligence Fall Short Information PDF features a modern design for your presentation meetings. The adjustable and customizable slides provide unlimited possibilities for acing up your presentation. Slidegeeks has done all the homework before launching the product for you. So, do not wait, grab the presentation templates today.

KPI Dashboard To Track Brand Performance Information PDF
Mentioned slide showcases KPI dashboard that can be used to check the financial performance of a brand. Metrics covered in the dashboard are return on assets, working capital ratio, return on equity etc. Do you know about Slidesgeeks KPI Dashboard To Track Brand Performance Information PDF These are perfect for delivering any kind od presentation. Using it, create PowerPoint presentations that communicate your ideas and engage audiences. Save time and effort by using our pre designed presentation templates that are perfect for a wide range of topic. Our vast selection of designs covers a range of styles, from creative to business, and are all highly customizable and easy to edit. Download as a PowerPoint template or use them as Google Slides themes.

Application Performance Dashboard Ppt Icon Template PDF
This slide covers application performance in market KPIs and metrics such as impressions, clicks, searches for app, conversion rate etc. This Application Performance Dashboard Ppt Icon Template PDF from Slidegeeks makes it easy to present information on your topic with precision. It provides customization options, so you can make changes to the colors, design, graphics, or any other component to create a unique layout. It is also available for immediate download, so you can begin using it right away. Slidegeeks has done good research to ensure that you have everything you need to make your presentation stand out. Make a name out there for a brilliant performance.
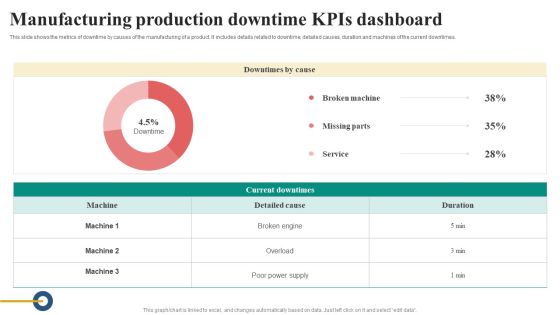
Manufacturing Production Downtime Kpis Dashboard Diagrams PDF
This slide shows the metrics of downtime by causes of the manufacturing of a product. It includes details related to downtime, detailed causes, duration and machines of the current downtimes. Pitch your topic with ease and precision using this Manufacturing Production Downtime Kpis Dashboard Diagrams PDF. This layout presents information on Details Related To Downtime, Detailed Causes, Duration And Machines, Current Downtimes. It is also available for immediate download and adjustment. So, changes can be made in the color, design, graphics or any other component to create a unique layout.

Service Teams Performance Analysis Robotic Process Automation Metrics Dashboard Brochure PDF
This template covers KPI dashboard for measuring the impact of RPA on support team performance. It also include metrics such as average NPS, average desktop focus, application utilization, etc. Showcasing this set of slides titled Service Teams Performance Analysis Robotic Process Automation Metrics Dashboard Brochure PDF. The topics addressed in these templates are Opportunity, Production Goal Strategically, Application Utilization. All the content presented in this PPT design is completely editable. Download it and make adjustments in color, background, font etc. as per your unique business setting.

Same Issue New Business PowerPoint Presentation Chiropractic Plan Templates
We present our same issue new business powerpoint presentation chiropractic plan templates.Present our Flow charts PowerPoint Templates because it demonstrates to your audience how the best and most refined ideas pass through. Use our Process and Flows PowerPoint Templates because you are the star of your enlightened team. Use our Business PowerPoint Templates because you can Lead your flock steadily to greater heights. Look around at the vast potential of achievement around you. Present our Marketing PowerPoint Templates because The marketplace is the merger of your dreams and your ability. Download and present our Arrows PowerPoint Templates because it builds on your foundation or prepares for change ahead to enhance the future.Use these PowerPoint slides for presentations relating to Analyst, arrows, bar, blue, business, chart,decrease, diagram, down, economic, fall, figures, finance, financial, flow, forecast, graph, illustration, investment, line, loss, lost, marketing, measure, misfortune, prediction, report, results, sales, statistics. The prominent colors used in the PowerPoint template are White, Black, Blue. The feedback we get is that our same issue new business powerpoint presentation chiropractic plan templates are visually appealing. The feedback we get is that our diagram PowerPoint templates and PPT Slides are aesthetically designed to attract attention. We guarantee that they will grab all the eyeballs you need. People tell us our same issue new business powerpoint presentation chiropractic plan templates are Bright. We assure you our decrease PowerPoint templates and PPT Slides are Sparkling. We assure you our same issue new business powerpoint presentation chiropractic plan templates are aesthetically designed to attract attention. We guarantee that they will grab all the eyeballs you need. The feedback we get is that our chart PowerPoint templates and PPT Slides are Dazzling.
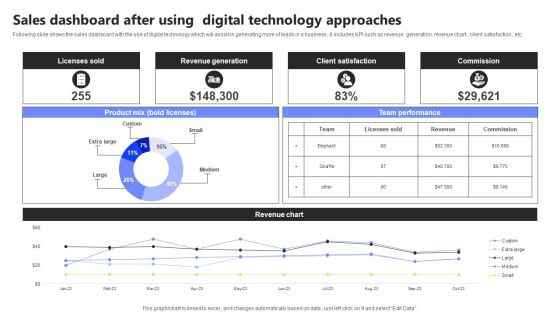
Sales Dashboard After Using Digital Technology Approaches Infographics PDF
Following slide shows the sales dashboard with the use of digital technology which will assist in generating more of leads in a business . It includes KPI such as revenue generation, revenue chart , client satisfaction , etc. Showcasing this set of slides titled Sales Dashboard After Using Digital Technology Approaches Infographics PDF. The topics addressed in these templates are Licenses Sold, Revenue Generation, Client Satisfaction. All the content presented in this PPT design is completely editable. Download it and make adjustments in color, background, font etc. as per your unique business setting.
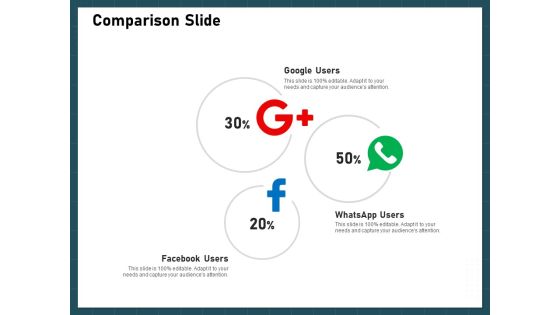
Strategies To Win Customers From Competitors Comparison Slide Brochure PDF
This is a strategies to win customers from competitors comparison slide brochure pdf template with various stages. Focus and dispense information on three stages using this creative set, that comes with editable features. It contains large content boxes to add your information on topics like google users, whatsapp users, facebook users. You can also showcase facts, figures, and other relevant content using this PPT layout. Grab it now.
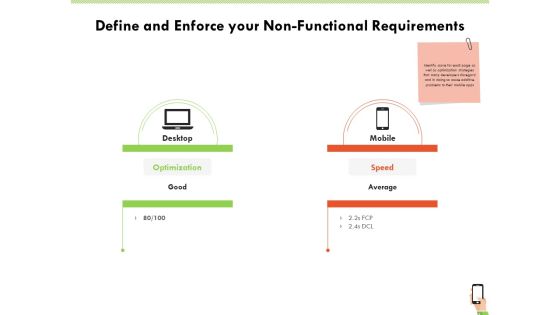
Multi Channel Online Commerce Define And Enforce Your Non Functional Requirements Summary PDF
This is a multi channel online commerce define and enforce your non functional requirements summary pdf template with various stages. Focus and dispense information on two stages using this creative set, that comes with editable features. It contains large content boxes to add your information on topics like mobile, desktop, speed, optimization, average. You can also showcase facts, figures, and other relevant content using this PPT layout. Grab it now.
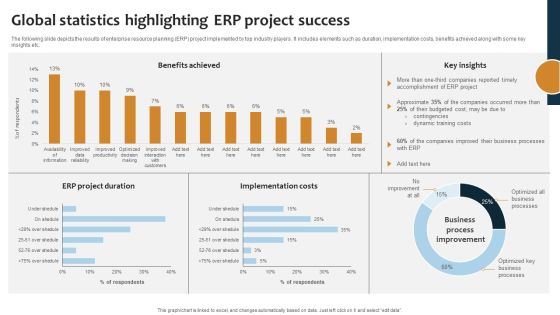
Improving Business Procedures Enterprise Resource Planning System Global Statistics Highlighting ERP Project Background PDF
The following slide depicts the results of enterprise resource planning ERP project implemented by top industry players. It includes elements such as duration, implementation costs, benefits achieved along with some key insights etc. The Improving Business Procedures Enterprise Resource Planning System Global Statistics Highlighting ERP Project Background PDF is a compilation of the most recent design trends as a series of slides. It is suitable for any subject or industry presentation, containing attractive visuals and photo spots for businesses to clearly express their messages. This template contains a variety of slides for the user to input data, such as structures to contrast two elements, bullet points, and slides for written information. Slidegeeks is prepared to create an impression.

Top 10 Revolutionary Solutions For Everything Statistical Highlights About Chatgpt Platform Guidelines PDF
This slide highlights the noteworthy highlights about the ChatGPT tool in terms of achieving a remarkable userbase in short span of time in comparison to major social media platforms and cost utilized to train the platform along with daily or monthly cost of operating it. The Top 10 Revolutionary Solutions For Everything Statistical Highlights About Chatgpt Platform Guidelines PDF is a compilation of the most recent design trends as a series of slides. It is suitable for any subject or industry presentation, containing attractive visuals and photo spots for businesses to clearly express their messages. This template contains a variety of slides for the user to input data, such as structures to contrast two elements, bullet points, and slides for written information. Slidegeeks is prepared to create an impression.
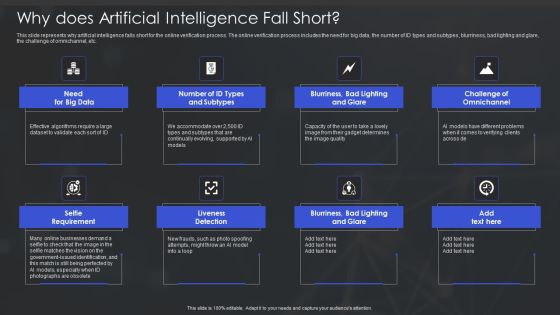
Human Augmented Machine Learning IT Why Does Artificial Intelligence Fall Short Background PDF
This slide represents why artificial intelligence falls short for the online verification process. The online verification process includes the need for big data, the number of ID types and subtypes, blurriness, bad lighting and glare, the challenge of omnichannel, etc. Are you searching for a Human Augmented Machine Learning IT Why Does Artificial Intelligence Fall Short Background PDF that is uncluttered, straightforward, and original. Its easy to edit, and you can change the colors to suit your personal or business branding. For a presentation that expresses how much effort youve put in, this template is ideal. With all of its features, including tables, diagrams, statistics, and lists, its perfect for a business plan presentation. Make your ideas more appealing with these professional slides. Download Human Augmented Machine Learning IT Why Does Artificial Intelligence Fall Short Background PDF from Slidegeeks today.
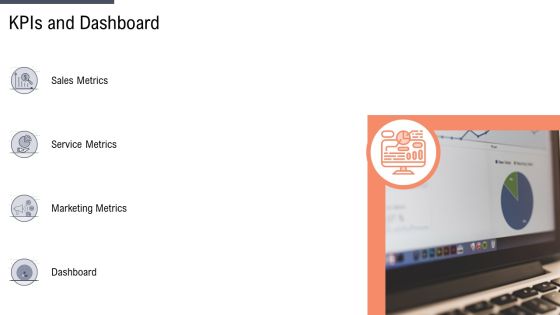
Factor Approaches For Potential Audience Targeting Kpis And Dashboard Designs PDF
This is a factor approaches for potential audience targeting kpis and dashboard designs pdf template with various stages. Focus and dispense information on four stages using this creative set, that comes with editable features. It contains large content boxes to add your information on topics like sales metrics, service metrics, marketing metrics, dashboard. You can also showcase facts, figures, and other relevant content using this PPT layout. Grab it now.

Loyalty Program Strategies For Strategic Optimization Of Customer Journey Touchpoints Elements PDF
This slide covers strategies for delivering effective loyalty programs such as gamification, omnichannel, use of artificial intelligence AI and big data. It also includes best practices such as personalization, simplification, differentiation, etc. Do you have to make sure that everyone on your team knows about any specific topic I yes, then you should give Loyalty Program Strategies For Strategic Optimization Of Customer Journey Touchpoints Elements PDF a try. Our experts have put a lot of knowledge and effort into creating this impeccable Loyalty Program Strategies For Strategic Optimization Of Customer Journey Touchpoints Elements PDF. You can use this template for your upcoming presentations, as the slides are perfect to represent even the tiniest detail. You can download these templates from the Slidegeeks website and these are easy to edit. So grab these today.
KPIs Metrics In Dashboard Vector Icon Ppt PowerPoint Presentation Portfolio Graphics Download PDF
Presenting kpis metrics in dashboard vector icon ppt powerpoint presentation portfolio graphics download pdf to dispense important information. This template comprises three stages. It also presents valuable insights into the topics including kpis metrics in dashboard vector icon. This is a completely customizable PowerPoint theme that can be put to use immediately. So, download it and address the topic impactfully.

Price Optimization Dashboard Product Pricing Strategies Analysis Mockup PDF
This slide covers the details of price optimization which focuses on price changes, leader, distribution, and benchmark. Deliver an awe inspiring pitch with this creative Price Optimization Dashboard Product Pricing Strategies Analysis Mockup PDF bundle. Topics like Quaterly Revenue Goal, Basic Metric Revenue, Portfolio Under Management can be discussed with this completely editable template. It is available for immediate download depending on the needs and requirements of the user.
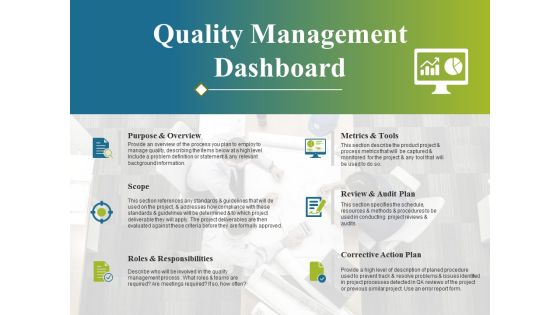
Quality Management Dashboard Ppt PowerPoint Presentation Summary Graphic Tips
This is a quality management dashboard ppt powerpoint presentation summary graphic tips. This is a six stage process. The stages in this process are purpose and overview, scope, roles and responsibilities, metrics and tools, review and audit plan, corrective action plan.

Case Administration Dashboard With Resolved Cases Graphics PDF
This slide shows dashboard which can be used to monitor the status of case management solved in the organizations. It includes key performance indicators such as active cases by priority, by subject, by age, by branch, etc. Pitch your topic with ease and precision using this Case Administration Dashboard With Resolved Cases Graphics PDF. This layout presents information on Case Administration Dashboard, Resolved Cases. It is also available for immediate download and adjustment. So, changes can be made in the color, design, graphics or any other component to create a unique layout.
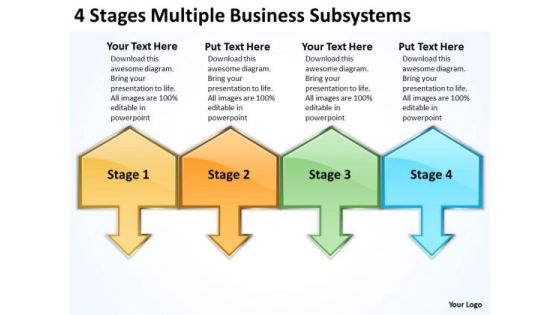
Business PowerPoint Presentations Subsystems Continuity Plans Templates
We present our business powerpoint presentations subsystems continuity plans templates.Download and present our Arrows PowerPoint Templates because Our PowerPoint Templates and Slides will provide you the cutting edge. Slice through the doubts in the minds of your listeners. Download and present our Signs PowerPoint Templates because Our PowerPoint Templates and Slides will bullet point your ideas. See them fall into place one by one. Download our Shapes PowerPoint Templates because Our PowerPoint Templates and Slides are Clear and concise. Use them and dispel any doubts your team may have. Download our Metaphors-Visual Concepts PowerPoint Templates because You are well armed with penetrative ideas. Our PowerPoint Templates and Slides will provide the gunpowder you need. Download our Business PowerPoint Templates because Our PowerPoint Templates and Slides are conceived by a dedicated team. Use them and give form to your wondrous ideas.Use these PowerPoint slides for presentations relating to abstract, arrow, brochure, business, button, catalog, chart, circle, colors, cross, demonstration, description, design, diagram, five, futuristic, glossy, goals, illustration, information, interface, internet, isolated, level, list, marketing, model, multiple, navigation, network, pattern, pie, presentation, registry, report, section, six, space, sphere, statement, statistics, steps, structure, target, template, text, three, vector, web, wheel. The prominent colors used in the PowerPoint template are Yellow, Orange, Green. We assure you our business powerpoint presentations subsystems continuity plans templates will save the presenter time. People tell us our catalog PowerPoint templates and PPT Slides are second to none. Customers tell us our business powerpoint presentations subsystems continuity plans templates are incredible easy to use. Presenters tell us our business PowerPoint templates and PPT Slides are visually appealing. People tell us our business powerpoint presentations subsystems continuity plans templates are specially created by a professional team with vast experience. They diligently strive to come up with the right vehicle for your brilliant Ideas. We assure you our colors PowerPoint templates and PPT Slides will help you be quick off the draw. Just enter your specific text and see your points hit home.

Successful Business People 3d Men Climbing Bar Graph Marketing PowerPoint Templates
We present our successful business people 3d men climbing bar graph marketing PowerPoint templates.Download our People PowerPoint Templates because Our PowerPoint Templates and Slides are specially created by a professional team with vast experience. They diligently strive to come up with the right vehicle for your brilliant Ideas. Download our Marketing PowerPoint Templates because you can Break through with our PowerPoint Templates and Slides. Bring down the mental barriers of your audience. Download our Business PowerPoint Templates because our PowerPoint Templates and Slides are the string of your bow. Fire of your ideas and conquer the podium. Present our Future PowerPoint Templates because It will let you Set new benchmarks with our PowerPoint Templates and Slides. They will keep your prospects well above par. Download and present our Success PowerPoint Templates because You can Be the star of the show with our PowerPoint Templates and Slides. Rock the stage with your ideas.Use these PowerPoint slides for presentations relating to 3d, art, bar, bargraph, business, cartoon, cg, cgi, character, chart, clipart, clipart,concept, conceptual, figure, finance, financial, graph, growth, guy, help, human,humanoid, illustration, man, person, render, report, statistics, stylized, symbolic. The prominent colors used in the PowerPoint template are Green, Blue light, White. We assure you our successful business people 3d men climbing bar graph marketing PowerPoint templates help you meet deadlines which are an element of today's workplace. Just browse and pick the slides that appeal to your intuitive senses. You can be sure our business PowerPoint templates and PPT Slides will save the presenter time. Use our successful business people 3d men climbing bar graph marketing PowerPoint templates have awesome images to get your point across. We assure you our character PowerPoint templates and PPT Slides are visually appealing. Use our successful business people 3d men climbing bar graph marketing PowerPoint templates are readymade to fit into any presentation structure. Professionals tell us our business PowerPoint templates and PPT Slides will make you look like a winner.

Roadmap For Reinforcement Learning Project Ppt Infographics Graphics Example PDF
This slide shows the roadmap for the reinforcement learning project, including the list of tasks to be performed from March 2023 to February 2024. The tasks include initializing the values table, observing the current state, choosing an action for that state, and so on. The Roadmap For Reinforcement Learning Project Ppt Infographics Graphics Example PDF is a compilation of the most recent design trends as a series of slides. It is suitable for any subject or industry presentation, containing attractive visuals and photo spots for businesses to clearly express their messages. This template contains a variety of slides for the user to input data, such as structures to contrast two elements, bullet points, and slides for written information. Slidegeeks is prepared to create an impression.

Cloud Security KPI Dashboard With Key Statistics Ppt Icon Examples PDF
Pitch your topic with ease and precision using this Cloud Security KPI Dashboard With Key Statistics Ppt Icon Examples PDF. This layout presents information on Compliance Trend, Risk Status, Risk Severity. It is also available for immediate download and adjustment. So, changes can be made in the color, design, graphics or any other component to create a unique layout.

Iot And Digital Twin To Reduce Costs Post Covid Dashboard Depicting Supply Chain Metrics Information PDF
This slide depicts the dashboard that shows supply chain metrics that covers net sales, supply chain costs, average cash to cash cycle, carrying costs of inventory, etc. Deliver an awe inspiring pitch with this creative iot and digital twin to reduce costs post covid dashboard depicting supply chain metrics information pdf bundle. Topics like covers net sales, supply chain costs, average cash to cash cycle, carrying costs of inventory can be discussed with this completely editable template. It is available for immediate download depending on the needs and requirements of the user.

Optimizing Ecommerce Marketing Plan To Improve Sales Dashboard Depicting Metrics Of Digital Marketing Campaign Information PDF
This slide shows the dashboard that depicts the metrics used for measuring digital marketing campaign that covers bounce rate, pageviews, conversions, social media followers, etc. Deliver and pitch your topic in the best possible manner with this Optimizing Ecommerce Marketing Plan To Improve Sales Dashboard Depicting Metrics Of Digital Marketing Campaign Information PDF. Use them to share invaluable insights on Traffic Sources, Conversion Rate, Revenue Growth Rate and impress your audience. This template can be altered and modified as per your expectations. So, grab it now.

Metric Dashboard For Portfolio Performance Monitoring Strategies To Enhance Portfolio Management Information PDF
This slide represents metric dashboard for portfolio evaluation and performance monitoring. It covers project completion, top project risk, portfolio completion etc.Want to ace your presentation in front of a live audience Our Metric Dashboard For Portfolio Performance Monitoring Strategies To Enhance Portfolio Management Information PDF can help you do that by engaging all the users towards you.. Slidegeeks experts have put their efforts and expertise into creating these impeccable powerpoint presentations so that you can communicate your ideas clearly. Moreover, all the templates are customizable, and easy-to-edit and downloadable. Use these for both personal and commercial use.

Banking Scam Analysis Dashboard Icon Background PDF
Persuade your audience using this Banking Scam Analysis Dashboard Icon Background PDF. This PPT design covers three stages, thus making it a great tool to use. It also caters to a variety of topics including Banking Scam, Analysis Dashboard Icon. Download this PPT design now to present a convincing pitch that not only emphasizes the topic but also showcases your presentation skills.
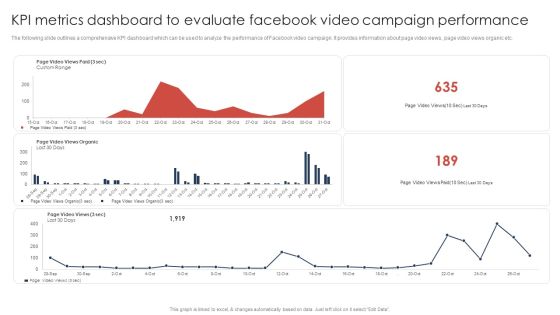
Kpi Metrics Dashboard To Evaluate Facebook Video Campaign Performance Information PDF
The following slide outlines a comprehensive KPI dashboard which can be used to analyze the performance of Facebook video campaign. It provides information about page video views, page video views organic etc. Whether you have daily or monthly meetings, a brilliant presentation is necessary. Kpi Metrics Dashboard To Evaluate Facebook Video Campaign Performance Information PDF can be your best option for delivering a presentation. Represent everything in detail using Kpi Metrics Dashboard To Evaluate Facebook Video Campaign Performance Information PDF and make yourself stand out in meetings. The template is versatile and follows a structure that will cater to your requirements. All the templates prepared by Slidegeeks are easy to download and edit. Our research experts have taken care of the corporate themes as well. So, give it a try and see the results.

Consumer Statistics Dashboard Showing Leads By Channel Ppt PowerPoint Presentation File Graphics Template PDF
Presenting this set of slides with name consumer statistics dashboard showing leads by channel ppt powerpoint presentation file graphics template pdf. The topics discussed in these slide is consumer statistics dashboard showing leads by channel. This is a completely editable PowerPoint presentation and is available for immediate download. Download now and impress your audience.
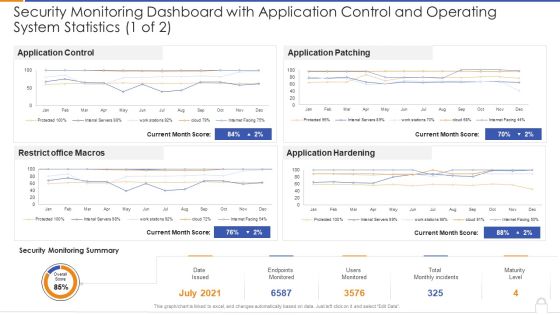
Security Monitoring Dashboard With Application Control And Operating System Statistics 1 Of 2 Ideas PDF
Deliver and pitch your topic in the best possible manner with thissecurity monitoring dashboard with application control and operating system statistics 1 of 2 ideas pdf Use them to share invaluable insights on security monitoring dashboard with application control and operating system statistics and impress your audience. This template can be altered and modified as per your expectations. So, grab it now.
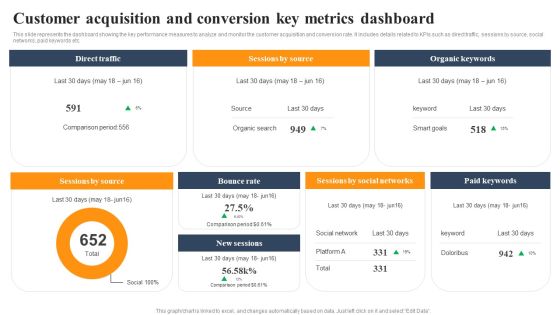
Implementing An Effective Ecommerce Management Framework Customer Acquisition And Conversion Key Metrics Dashboard Information PDF
Do you have to make sure that everyone on your team knows about any specific topic I yes, then you should give Implementing An Effective Ecommerce Management This slide represents the dashboard showing the key performance measures to analyze and monitor the customer acquisition and conversion rate. It includes details related to KPIs such as direct traffic, sessions by source, social networks, paid keywords etc. Framework Customer Acquisition And Conversion Key Metrics Dashboard Information PDF a try. Our experts have put a lot of knowledge and effort into creating this impeccable Implementing An Effective Ecommerce Management Framework Customer Acquisition And Conversion Key Metrics Dashboard Information PDF. You can use this template for your upcoming presentations, as the slides are perfect to represent even the tiniest detail. You can download these templates from the Slidegeeks website and these are easy to edit. So grab these today
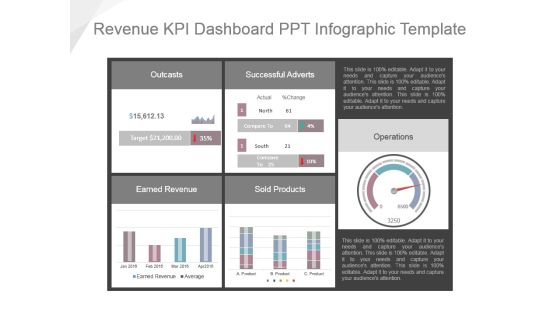
Revenue Kpi Dashboard Ppt Infographic Template
This is a revenue kpi dashboard ppt infographic template. This is a five stage process. The stages in this process are outcasts, successful adverts, earned revenue, sold products, operations.

Yearly Business Performance Assessment And Evaluation Dashboard Structure PDF
This slide contains annual business review of a company. It includes revenue comparison, sales assessment and profitability representation. Showcasing this set of slides titled Yearly Business Performance Assessment And Evaluation Dashboard Structure PDF. The topics addressed in these templates are Revenue Comparison, Sales, Profitability. All the content presented in this PPT design is completely editable. Download it and make adjustments in color, background, font etc. as per your unique business setting.
Energy Tracking Device KPI Metrics And Dashboard Ppt PowerPoint Presentation Visual Aids Show PDF
This is a energy tracking device kpi metrics and dashboard ppt powerpoint presentation visual aids show pdf template with various stages. Focus and dispense information on two stages using this creative set, that comes with editable features. It contains large content boxes to add your information on topics like kpi metrics, dashboard. You can also showcase facts, figures, and other relevant content using this PPT layout. Grab it now.
Utilizing Infrastructure Management Using Latest Methods KPI Metrics And Dashboard Topics PDF
This is a utilizing infrastructure management using latest methods kpi metrics and dashboard topics pdf template with various stages. Focus and dispense information on two stages using this creative set, that comes with editable features. It contains large content boxes to add your information on topics like kpi metrics, kpi dashboards. You can also showcase facts, figures, and other relevant content using this PPT layout. Grab it now.
Civil Infrastructure Designing Services Management Kpi Metrics And Dashboard Topics PDF
This is a civil infrastructure designing services management kpi metrics and dashboard topics pdf template with various stages. Focus and dispense information on two stages using this creative set, that comes with editable features. It contains large content boxes to add your information on topics like kpi metrics, kpi dashboards. You can also showcase facts, figures, and other relevant content using this PPT layout. Grab it now.

Digital Transformation Of Supply Supply Chain Success Metrics Dashboard Graphics PDF
Following slide demonstrates supply chain success measurement dashboard. It includes details about cash to cash cycle along with statistics like days of inventory, days of receivable and days of payables. If your project calls for a presentation, then Slidegeeks is your go-to partner because we have professionally designed, easy-to-edit templates that are perfect for any presentation. After downloading, you can easily edit Digital Transformation Of Supply Supply Chain Success Metrics Dashboard Graphics PDF and make the changes accordingly. You can rearrange slides or fill them with different images. Check out all the handy templates.
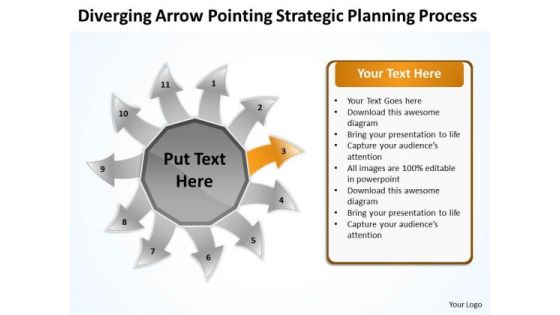
Diverging Arrow Pointing Strategic Planning Process Ppt Radial PowerPoint Slide
We present our diverging arrow pointing strategic planning process ppt Radial PowerPoint Slide.Use our Arrows PowerPoint Templates because all for one and one for all. Download and present our Flow Charts PowerPoint Templates because you should explain the process by which you intend to right it. Present our Process and Flows PowerPoint Templates because using our templates for your colleagues will impart knowledge to feed. Use our Ring Charts PowerPoint Templates because you have some excellent plans to spread some more of it across your community. Use our Business PowerPoint Templates because it will demonstrate the strength of character under severe stress. Shine the torch ahead and bring the light to shine on all.Use these PowerPoint slides for presentations relating to Arrow, art, artistic,background, caricature, chart, childish,circular, creative, design, diagram,doodle, draw, flow, graffiti, graphic,grunge, hand, handwritten, icon,illustration, image, isolated, object, pie, pieces, process, raster,report, retro, rough, scribble, segmented, simple, sketch, sketchy, slices,statistic, styling, succeed, success,symbol. The prominent colors used in the PowerPoint template are Green lime, Gray, White. Professionals tell us our diverging arrow pointing strategic planning process ppt Radial PowerPoint Slide are Royal. People tell us our caricature PowerPoint templates and PPT Slides are Nifty. The feedback we get is that our diverging arrow pointing strategic planning process ppt Radial PowerPoint Slide will help you be quick off the draw. Just enter your specific text and see your points hit home. Presenters tell us our chart PowerPoint templates and PPT Slides are No-nonsense. You can be sure our diverging arrow pointing strategic planning process ppt Radial PowerPoint Slide will help you be quick off the draw. Just enter your specific text and see your points hit home. PowerPoint presentation experts tell us our creative PowerPoint templates and PPT Slides are Luxuriant.
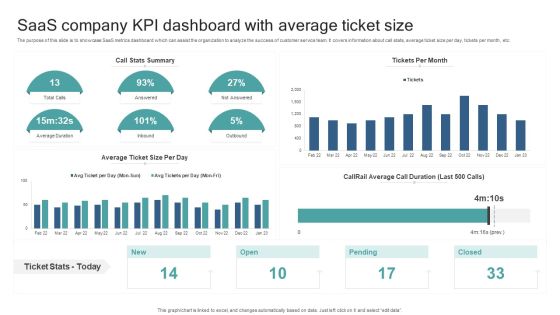
Saas Company KPI Dashboard With Average Ticket Size Sample PDF
The purpose of this slide is to showcase SaaS metrics dashboard which can assist the organization to analyze the success of customer service team. It covers information about call stats, average ticket size per day, tickets per month, etc. Showcasing this set of slides titled Saas Company KPI Dashboard With Average Ticket Size Sample PDF. The topics addressed in these templates are Saas Company Kpi, Dashboard, Average Ticket Size. All the content presented in this PPT design is completely editable. Download it and make adjustments in color, background, font etc. as per your unique business setting.
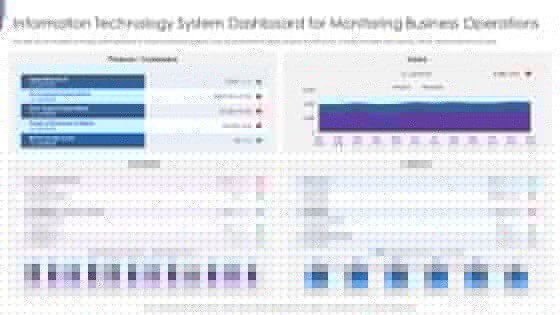
Information Technology System Dashboard For Monitoring Business Operations Themes PDF
This slide shows information technology system dashboard for monitoring business operations which can be beneficial for making decisions for their growth. It contains information about learning, internal, finance or customers and users. Pitch your topic with ease and precision using this Information Technology System Dashboard For Monitoring Business Operations Themes PDF. This layout presents information on Finance Customers Users, Learning Internal Tickets, Hiring And Firing. It is also available for immediate download and adjustment. So, changes can be made in the color, design, graphics or any other component to create a unique layout.
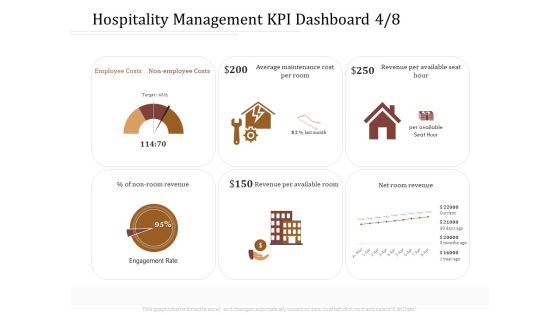
Key Metrics Hotel Administration Management Hospitality Management KPI Dashboard Employee Information PDF
Presenting this set of slides with name key metrics hotel administration management hospitality management kpi dashboard employee information pdf. The topics discussed in these slides are costs, maintenance, revenue, average. This is a completely editable PowerPoint presentation and is available for immediate download. Download now and impress your audience.
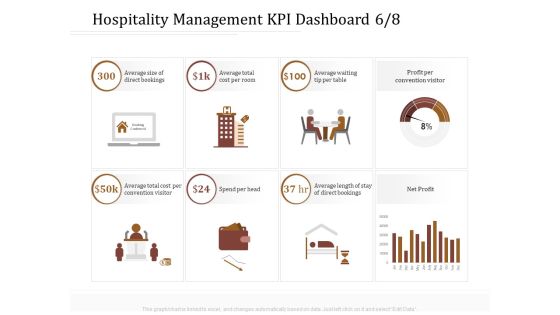
Key Metrics Hotel Administration Management Hospitality Management KPI Dashboard Head Information PDF
Presenting this set of slides with name key metrics hotel administration management hospitality management kpi dashboard head information pdf. The topics discussed in these slides are average, cost, convention visitor, net profit. This is a completely editable PowerPoint presentation and is available for immediate download. Download now and impress your audience.
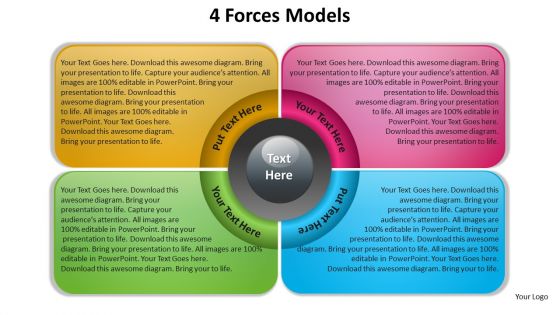
4 Forces Modelss PowerPoint Slides Presentation Diagrams Templates

CRM Performance Metrics Dashboard Showing Sales In Real Estate Customer Information PDF
This slide represents the dashboard showing the sales performance of a real estate company. It includes details related top 5 agents US sales, sales vs target per agent, top 5 banks-sold units, sales by top 5 agencies. Pitch your topic with ease and precision using this CRM Performance Metrics Dashboard Showing Sales In Real Estate Customer Information PDF. This layout presents information on Us Sales, Sold Units, Target Per Agent. It is also available for immediate download and adjustment. So, changes can be made in the color, design, graphics or any other component to create a unique layout.

Dashboard Indicating Funding Request Capital Raising Stages Ppt Show Infographics PDF
This slide showcases dashboard indicating status of multiple stages in funding ask. It provides information about valuation, discount, investors, seed round, angel, previous funding, etc. Showcasing this set of slides titled dashboard indicating funding request capital raising stages ppt show infographics pdf. The topics addressed in these templates are previous funding, building expenses, resource requirement. All the content presented in this PPT design is completely editable. Download it and make adjustments in color, background, font etc. as per your unique business setting.
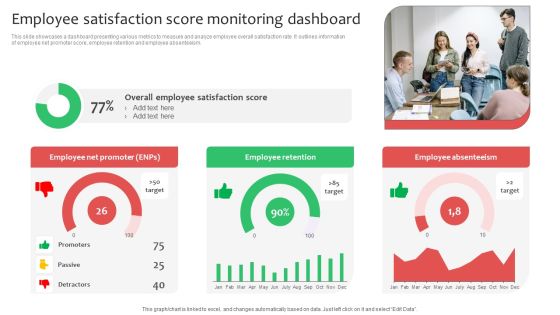
Employee Satisfaction Score Monitoring Dashboard Ppt Infographics Deck PDF
This slide showcases a dashboard presenting various metrics to measure and analyze employee overall satisfaction rate. It outlines information of employee net promoter score, employee retention and employee absenteeism. This Employee Satisfaction Score Monitoring Dashboard Ppt Infographics Deck PDF from Slidegeeks makes it easy to present information on your topic with precision. It provides customization options, so you can make changes to the colors, design, graphics, or any other component to create a unique layout. It is also available for immediate download, so you can begin using it right away. Slidegeeks has done good research to ensure that you have everything you need to make your presentation stand out. Make a name out there for a brilliant performance.
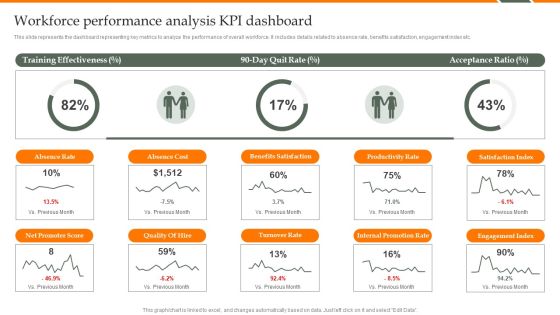
Human Resource Analytics Workforce Performance Analysis KPI Dashboard Structure PDF
This slide represents the dashboard representing key metrics to analyze the performance of overall workforce. It includes details related to absence rate, benefits satisfaction, engagement index etc. Find a pre-designed and impeccable Human Resource Analytics Workforce Performance Analysis KPI Dashboard Structure PDF. The templates can ace your presentation without additional effort. You can download these easy-to-edit presentation templates to make your presentation stand out from others. So, what are you waiting for Download the template from Slidegeeks today and give a unique touch to your presentation.

Ppt Template Company Procedure In Five Horizontal To Vertical Text State Diagram 6 Image
We present our PPT template company procedure in five horizontal to vertical text state diagram 6 Image. Use our Communication PowerPoint Templates because, your ideas are fundamentally stable with a broad base of workable possibilities. Use our Boxes PowerPoint Templates because, to take your team soaring to the pinnacle they crave. Use our Business PowerPoint Templates because, you have it all down to a T. Use our Shapes PowerPoint Templates because, To strive to give true form to your great dream. Use our Arrows PowerPoint Templates because, they help to focus the thoughts of your listeners. Use these PowerPoint slides for presentations relating to Abstract, Action, Attach, Box, Business, Center, Chain, Chart, Color, Communication, Concept, Connection, Cube, Cycle, Data, Diagram, Flow, Globe, Horizontal, Idea, Illustration, Individual, Information, Interaction, Jigsaw, Join, Link, Merge, Missing, Opportunity, Part, People, Piece, Pieces, Process, Puzzle, Relation, Relationship, Search, Shape, Silhouette, Success. The prominent colors used in the PowerPoint template are Pink, Gray, and Black
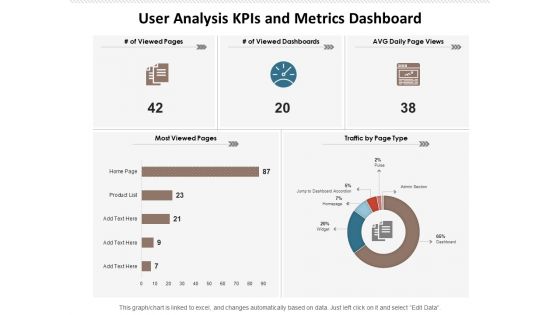
User Analysis Kpis And Metrics Dashboard Ppt PowerPoint Presentation Portfolio Summary PDF
Presenting this set of slides with name user analysis kpis and metrics dashboard ppt powerpoint presentation portfolio summary pdf. The topics discussed in these slides are viewed pages, viewed dashboards, avg daily page views, most viewed pages, traffic by page type. This is a completely editable PowerPoint presentation and is available for immediate download. Download now and impress your audience.

Financial Analysis Vector Bar Graph With Magnifying Glass Ppt PowerPoint Presentation Gallery Design Ideas
This is a financial analysis vector bar graph with magnifying glass ppt powerpoint presentation gallery design ideas. This is a four stage process. The stages in this process are marketing analytics, marketing performance, marketing discovery.
Marketing Analysis Tools Roi And Budget Optimization Ppt PowerPoint Presentation Icon Show
This is a marketing analysis tools roi and budget optimization ppt powerpoint presentation icon show. This is a six stage process. The stages in this process are marketing analytics, marketing performance, marketing discovery.

Dashboard Of Japan Country Profile Statistics Ppt Styles Infographic Template PDF
Presenting Dashboard Of Japan Country Profile Statistics Ppt Styles Infographic Template PDF to dispense important information. This template comprises one stages. It also presents valuable insights into the topics including Share Global GDP, Ghg Emissions, Per Capital. This is a completely customizable PowerPoint theme that can be put to use immediately. So, download it and address the topic impactfully.

Australia Country Profile Statistics Dashboard Including Air Pollution Index Professional PDF
Presenting Australia Country Profile Statistics Dashboard Including Air Pollution Index Professional PDF to dispense important information. This template comprises one stages. It also presents valuable insights into the topics including Global Ghg Emissions, Human Development Index, GDP Per Capita. This is a completely customizable PowerPoint theme that can be put to use immediately. So, download it and address the topic impactfully.

Marketing Strategy For Shipping Business Key Performance Indicator Dashboard Graphics PDF
The following slide depicts the key areas in Marketing Strategy for Shipping Business to monitor and optimize supply chain processes. It includes elements such as fleet and shipment status, country wise revenue, location wise delivery, average shipment time etc.Pitch your topic with ease and precision using this Marketing Strategy For Shipping Business Key Performance Indicator Dashboard Graphics PDF. This layout presents information on Shipment Status, Average Shipment, Wise Revenue. It is also available for immediate download and adjustment. So, changes can be made in the color, design, graphics or any other component to create a unique layout.

Metrics For Project Success Evaluation Ppt PowerPoint Presentation Model Example File
This is a metrics for project success evaluation ppt powerpoint presentation model example file. This is a two stage process. The stages in this process are project dashboard, project kpis, project metrics.
Insurance Company Business Plan Insurance Agency Activities Tracking Dashboard Information PDF
This slide provides glimpse about insurance agency activities tracking dashboard which help management in monitoring activities. Deliver an awe inspiring pitch with this creative Insurance Company Business Plan Insurance Agency Activities Tracking Dashboard Information PDF bundle. Topics like Insurance Agency, Activities Tracking Dashboard can be discussed with this completely editable template. It is available for immediate download depending on the needs and requirements of the user.

Project Health Card Scheduling And Resourcing Ppt PowerPoint Presentation Styles Tips
This is a project health card scheduling and resourcing ppt powerpoint presentation styles tips. This is a six stage process. The stages in this process are project analysis, project review, project performance management.

Project Issues Management And Actions Planning Ppt PowerPoint Presentation File Outfit
This is a project issues management and actions planning ppt powerpoint presentation file outfit. This is a five stage process. The stages in this process are project analysis, project review, project performance management.
Project Progress Planning Template Ppt PowerPoint Presentation Icon Guide
This is a project progress planning template ppt powerpoint presentation icon guide. This is a four stage process. The stages in this process are project analysis, project review, project performance management.

Project Status Time Cost Budget Ppt PowerPoint Presentation Ideas Outline
This is a project status time cost budget ppt powerpoint presentation ideas outline. This is a four stage process. The stages in this process are project analysis, project review, project performance management.

Construction Engineering And Industrial Facility Management KPI Metrics And Dashboard Portrait PDF
Presenting construction engineering and industrial facility management kpi metrics and dashboard portrait pdf to provide visual cues and insights. Share and navigate important information on two stages that need your due attention. This template can be used to pitch topics like kpi metrics and dashboard. In addtion, this PPT design contains high resolution images, graphics, etc, that are easily editable and available for immediate download.
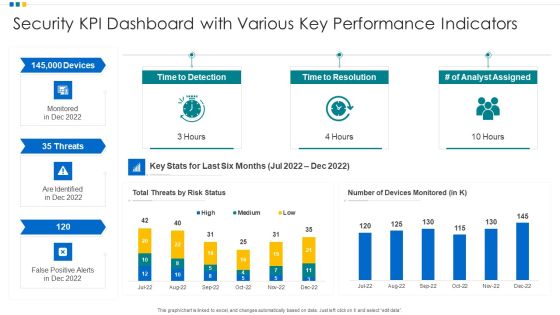
Security KPI Dashboard With Various Key Performance Indicators Ppt Portfolio Objects PDF
Showcasing this set of slides titled Security KPI Dashboard With Various Key Performance Indicators Ppt Portfolio Objects PDF. The topics addressed in these templates are Security Kpi Dashboard, Performance Indicators, Analyst Assigned. All the content presented in this PPT design is completely editable. Download it and make adjustments in color, background, font etc. as per your unique business setting.
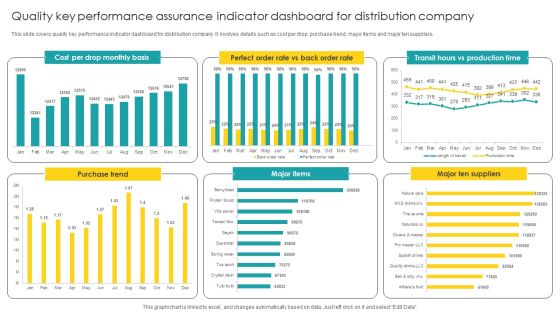
Quality Key Performance Assurance Indicator Dashboard For Distribution Company Mockup PDF
Showcasing this set of slides titled Quality Key Performance Assurance Indicator Dashboard For Distribution Company Mockup PDF. The topics addressed in these templates are Performance Assurance, Indicator Dashboard, Distribution Company. All the content presented in this PPT design is completely editable. Download it and make adjustments in color, background, font etc. as per your unique business setting.
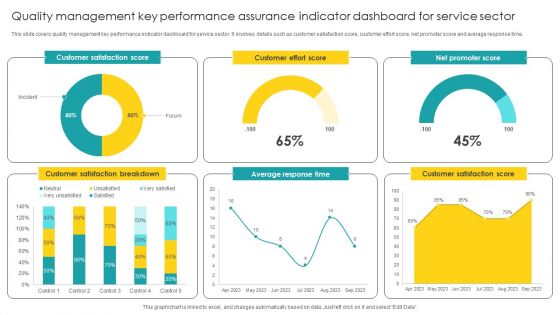
Quality Management Key Performance Assurance Indicator Dashboard For Service Sector Designs PDF
Showcasing this set of slides titled Quality Management Key Performance Assurance Indicator Dashboard For Service Sector Designs PDF. The topics addressed in these templates are Assurance Indicator, Dashboard For Service Sector. All the content presented in this PPT design is completely editable. Download it and make adjustments in color, background, font etc. as per your unique business setting.
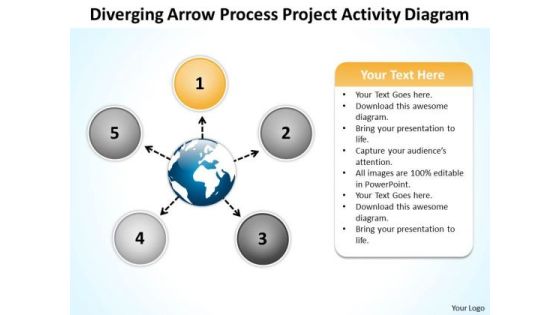
Diverging Arrow Process Project Activity Diagram Ppt Radial Chart PowerPoint Slide
We present our diverging arrow process project activity diagram ppt Radial Chart PowerPoint Slide.Download our Globe PowerPoint Templates because sprout your thoughts into the minds of your colleagues. Present our Circle Charts PowerPoint Templates because your brain is always churning out ideas like cogs in a wheel. Use our Ring Charts PowerPoint Templates because it can bring your ideas to the fore so that all around can know. Dissect each idea to the core and select the best. Download and present our Business PowerPoint Templates because this template can project the path to sucess that you have charted. Use our Marketing PowerPoint Templates because networking is an imperative in todays world. You need to access the views of others. Similarly you need to give access to them of your abilities.Use these PowerPoint slides for presentations relating to Arrow, art, caricature, chart, childish,circular, creative, design, diagram,doodle, draw, flow, graffiti, graphic,grunge, hand, handwritten, icon,illustration, image, isolated, object, pie, pieces, process, raster,report, retro, rough, scribble, segmented, simple, sketch, sketchy, slices,statistic, styling, succeed, success,symbol. The prominent colors used in the PowerPoint template are Gray, Black, White. Professionals tell us our diverging arrow process project activity diagram ppt Radial Chart PowerPoint Slide are Wistful. People tell us our caricature PowerPoint templates and PPT Slides are Wistful. The feedback we get is that our diverging arrow process project activity diagram ppt Radial Chart PowerPoint Slide are Swanky. Presenters tell us our circular PowerPoint templates and PPT Slides will make the presenter look like a pro even if they are not computer savvy. You can be sure our diverging arrow process project activity diagram ppt Radial Chart PowerPoint Slide are Multicolored. PowerPoint presentation experts tell us our circular PowerPoint templates and PPT Slides will help you be quick off the draw. Just enter your specific text and see your points hit home.

Prevention Of Information KPI Metrics Dashboard To Effectively Track Cyber Guidelines PDF
The purpose of this slide is to highlight performance KPI dashboard used to monitor the cyber threat management. The metrics highlighted in the slide are risk score, compliance status, threat level, monitoring and operational status. Welcome to our selection of the Prevention Of Information KPI Metrics Dashboard To Effectively Track Cyber Guidelines PDF. These are designed to help you showcase your creativity and bring your sphere to life. Planning and Innovation are essential for any business that is just starting out. This collection contains the designs that you need for your everyday presentations. All of our PowerPoints are 100 percent editable, so you can customize them to suit your needs. This multi-purpose template can be used in various situations. Grab these presentation templates today

Supply Chain Metrics Fleet Efficiency Loading Time And Weight Ppt PowerPoint Presentation Portfolio Guidelines
This is a supply chain metrics fleet efficiency loading time and weight ppt powerpoint presentation portfolio guidelines. This is a four stage process. The stages in this process are logistics performance, logistics dashboard, logistics kpis.

Manufacturing Dashboard Examples Ppt Slide Show
This is a manufacturing dashboard examples ppt slide show. This is a five stage process. The stages in this process are units per hour, effective rate, units until, time unit, status information.
New Product Performance Evaluation Dashboard Icon Ppt Infographics Sample PDF
Persuade your audience using this New Product Performance Evaluation Dashboard Icon Ppt Infographics Sample PDF. This PPT design covers three stages, thus making it a great tool to use. It also caters to a variety of topics including New Product, Performance Evaluation, Dashboard Icon. Download this PPT design now to present a convincing pitch that not only emphasizes the topic but also showcases your presentation skills.
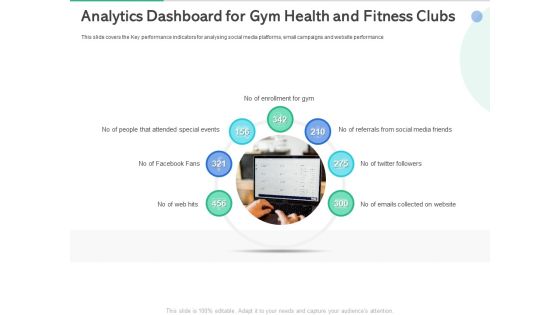
Market Overview Fitness Industry Analytics Dashboard For Gym Health And Fitness Clubs Guidelines PDF
This slide covers the Key performance indicators for analysing social media platforms, email campaigns and website performance. This is a market overview fitness industry analytics dashboard for gym health and fitness clubs guidelines pdf template with various stages. Focus and dispense information on seven stages using this creative set, that comes with editable features. It contains large content boxes to add your information on topics like attended special events, enrollment for gym, social media friends. You can also showcase facts, figures, and other relevant content using this PPT layout. Grab it now.
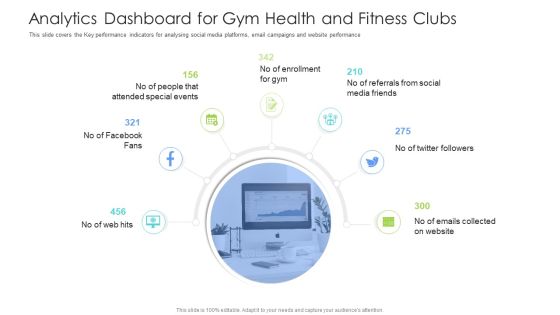
Well Being Gymnasium Sector Analytics Dashboard For Gym Health And Fitness Clubs Clipart PDF
This slide covers the Key performance indicators for analysing social media platforms, email campaigns and website performance. This is a well being gymnasium sector analytics dashboard for gym health and fitness clubs clipart pdf template with various stages. Focus and dispense information on seven stages using this creative set, that comes with editable features. It contains large content boxes to add your information on topics like special events, social media, enrollment, key performance, email campaigns. You can also showcase facts, figures, and other relevant content using this PPT layout. Grab it now.

Talent Retention Initiatives For New Hire Onboarding Performance Dashboard Monitoring Download PDF
This slide presents a dashboard illustrating the impact of effective employee onboarding. It includes information about, employee turnover, turnover rate, average years tenure, turnovers per quarter, turnover percentage per department and type of turnover- voluntary or involuntary. There are so many reasons you need a Talent Retention Initiatives For New Hire Onboarding Performance Dashboard Monitoring Download PDF. The first reason is you cannot spend time making everything from scratch, Thus, Slidegeeks has made presentation templates for you too. You can easily download these templates from our website easily.
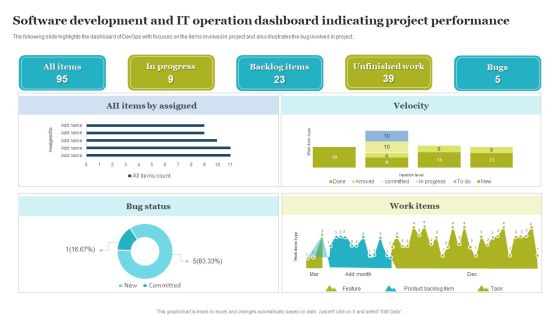
Software Development And IT Operation Dashboard Indicating Project Performance Demonstration PDF
The following slide highlights the dashboard of DevOps with focuses on the items involved in project and also illustrates the bug involved in project. Showcasing this set of slides titled Software Development And IT Operation Dashboard Indicating Project Performance Demonstration PDF. The topics addressed in these templates are Software Development, IT Operation Dashboard, Indicating Project Performance. All the content presented in this PPT design is completely editable. Download it and make adjustments in color, background, font etc. as per your unique business setting.
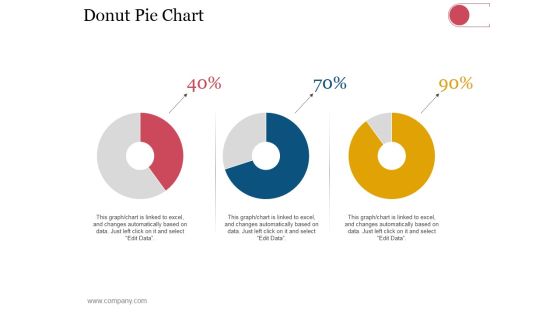
Donut Pie Chart Ppt PowerPoint Presentation Infographics Outfit
This is a donut pie chart ppt powerpoint presentation infographics outfit. This is a three stage process. The stages in this process are business, strategy, analysis, planning, dashboard, finance.

Key Team Members KPI Metrics And Dashboards Ppt Slides Objects PDF
Presenting this set of slides with name key team members kpi metrics and dashboards ppt slides objects pdf. This is a two stage process. The stages in this process are kpi metrics, dashboard metrics. This is a completely editable PowerPoint presentation and is available for immediate download. Download now and impress your audience.

7 Stages Analysis And Implementation Process Business Plans PowerPoint Slides
We present our 7 stages analysis and implementation process business plans PowerPoint Slides.Download and present our Business PowerPoint Templates because It will let you Set new benchmarks with our PowerPoint Templates and Slides. They will keep your prospects well above par. Download our Venn Diagrams PowerPoint Templates because You are an avid believer in ethical practices. Highlight the benefits that accrue with our PowerPoint Templates and Slides. Use our Layers PowerPoint Templates because Our PowerPoint Templates and Slides will provide weight to your words. They will bring out the depth of your thought process. Use our Circle Charts PowerPoint Templates because Our PowerPoint Templates and Slides provide you with a vast range of viable options. Select the appropriate ones and just fill in your text. Download our Shapes PowerPoint Templates because you should once Tap the ingenuity of our PowerPoint Templates and Slides. They are programmed to succeed.Use these PowerPoint slides for presentations relating to diagram, process, business, graphic, design, ideas, model, data, chart, project, schema, corporate, implementation, tag, plan, engineering, concept, vector, success, symbol, stack, circle, guide, work flow, development, shape, team, management, cycle, steps, illustration, system, strategy, objects, phase, professional, organization, implement, background, image, detail, structure, product. The prominent colors used in the PowerPoint template are Blue, Black, Gray.

Confidential Computing System Technology Confidential Computing Architecture Based Inspiration PDF
This slide represents the architecture of confidential computing based on Azure confidential computing services. The purpose of this slide is to showcase the problems with typical approaches and confidential computing solutions. It also includes the architecture components such as sensitive data, etc. Are you in need of a template that can accommodate all of your creative concepts This one is crafted professionally and can be altered to fit any style. Use it with Google Slides or PowerPoint. Include striking photographs, symbols, depictions, and other visuals. Fill, move around, or remove text boxes as desired. Test out color palettes and font mixtures. Edit and save your work, or work with colleagues. Download Confidential Computing System Technology Confidential Computing Architecture Based Inspiration PDF and observe how to make your presentation outstanding. Give an impeccable presentation to your group and make your presentation unforgettable.
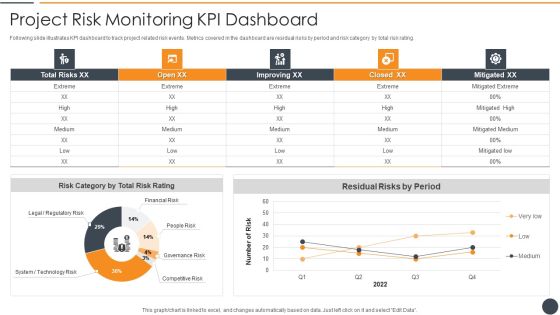
Effective Initiation Of Information Technology Project Project Risk Monitoring Kpi Dashboard Microsoft PDF
Following slide illustrates KPI dashboard to track project related risk events. Metrics covered in the dashboard are residual risks by period and risk category by total risk rating. Deliver and pitch your topic in the best possible manner with this effective initiation of information technology project project risk monitoring kpi dashboard microsoft pdf. Use them to share invaluable insights on mitigated extreme, residual risks by period, risk category by total risk rating and impress your audience. This template can be altered and modified as per your expectations. So, grab it now.
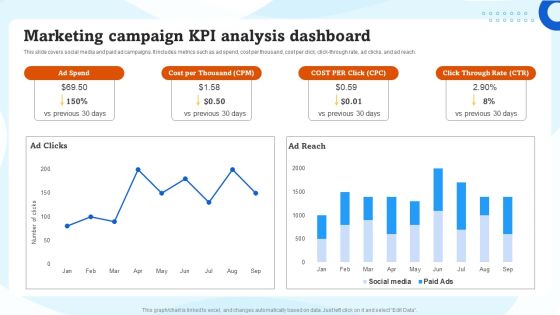
Marketing Campaign KPI Analysis Dashboard Ppt Inspiration Example File PDF
This slide covers social media and paid ad campaigns. It includes metrics such as ad spend, cost per thousand, cost per click, click-through rate, ad clicks, and ad reach. Coming up with a presentation necessitates that the majority of the effort goes into the content and the message you intend to convey. The visuals of a PowerPoint presentation can only be effective if it supplements and supports the story that is being told. Keeping this in mind our experts created Marketing Campaign KPI Analysis Dashboard Ppt Inspiration Example File PDF to reduce the time that goes into designing the presentation. This way, you can concentrate on the message while our designers take care of providing you with the right template for the situation.
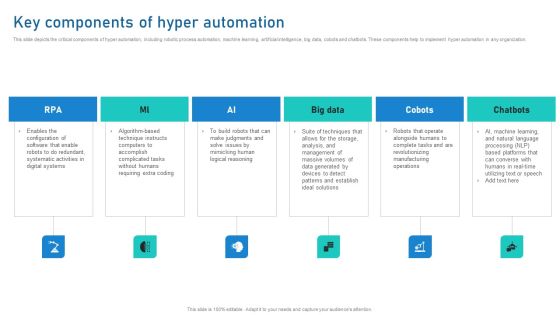
Intelligent Process Automation IPA Key Components Of Hyper Automation Portrait PDF
This slide depicts the critical components of hyper automation, including robotic process automation, machine learning, artificial intelligence, big data, cobots and chatbots. These components help to implement hyper automation in any organization. Do you have to make sure that everyone on your team knows about any specific topic I yes, then you should give Intelligent Process Automation IPA Key Components Of Hyper Automation Portrait PDF a try. Our experts have put a lot of knowledge and effort into creating this impeccable Intelligent Process Automation IPA Key Components Of Hyper Automation Portrait PDF. You can use this template for your upcoming presentations, as the slides are perfect to represent even the tiniest detail. You can download these templates from the Slidegeeks website and these are easy to edit. So grab these today

Website Performance Review Template 2 Ppt PowerPoint Presentation Infographics Vector
This is a website performance review template 2 ppt powerpoint presentation infographics vector. This is a three stage process. The stages in this process are conversion rate, return on investment, visits, average visit value, total visits.

7 Stages Analysis And Implementation Process Business Plan PowerPoint Slides
We present our 7 stages analysis and implementation process business plan PowerPoint Slides.Download our Business PowerPoint Templates because Our PowerPoint Templates and Slides will let you Hit the right notes. Watch your audience start singing to your tune. Download our Gear Wheels PowerPoint Templates because It will Strengthen your hand with your thoughts. They have all the aces you need to win the day. Present our Process and Flows PowerPoint Templates because Our PowerPoint Templates and Slides will definately Enhance the stature of your presentation. Adorn the beauty of your thoughts with their colourful backgrounds. Download and present our Circle Charts PowerPoint Templates because you can Set pulses racing with our PowerPoint Templates and Slides. They will raise the expectations of your team. Present our Leadership PowerPoint Templates because our PowerPoint Templates and Slides will give your ideas the shape.Use these PowerPoint slides for presentations relating to project, development, system, task, 3d, plan, data, process, design, leadership, isolated, requirement, collaboration, corporate, business, tag, concept, render, teamwork, graphic, schedule, goal, word, shape, gear, abstract, team, mind, management, creative, illustration, stage, connection, strategy, metaphor, company, organization, information, background, work, manager, structure. The prominent colors used in the PowerPoint template are Brown, Gray, White.

7 Stages Analysis And Implementation Process Business Plan PowerPoint Templates
We present our 7 stages analysis and implementation process business plan PowerPoint templates.Download and present our Business PowerPoint Templates because Our PowerPoint Templates and Slides will let you Leave a lasting impression to your audiences. They possess an inherent longstanding recall factor. Download our Gear Wheels PowerPoint Templates because You have the co-ordinates for your destination of success. Let our PowerPoint Templates and Slides map out your journey. Use our Process and Flows PowerPoint Templates because Our PowerPoint Templates and Slides come in all colours, shades and hues. They help highlight every nuance of your views. Download our Circle Charts PowerPoint Templates because Our PowerPoint Templates and Slides come in all colours, shades and hues. They help highlight every nuance of your views. Present our Leadership PowerPoint Templates because It can Conjure up grand ideas with our magical PowerPoint Templates and Slides. Leave everyone awestruck by the end of your presentation.Use these PowerPoint slides for presentations relating to project, development, system, task, 3d, plan, data, process, design, leadership, isolated, requirement, collaboration, corporate, business, tag, concept, render, teamwork, graphic, schedule, goal, word, shape, gear, abstract, team, mind, management, creative, illustration, stage, connection, strategy, metaphor, company, organization, information, background, work, manager, structure. The prominent colors used in the PowerPoint template are Green, Gray, White.
Key Performance Indicator Vector Icon Ppt PowerPoint Presentationmodel Brochure
This is a key performance indicator vector icon ppt powerpoint presentationmodel brochure. This is a three stage process. The stages in this process are kpi proposal, kpi plan, kpi scheme.
Project Capabilities Kpis And Dashboards Ppt Gallery Slide Download PDF
Presenting this set of slides with name project capabilities kpis and dashboards ppt gallery slide download pdf. This is a two stage process. The stages in this process are metrics, dashboard. This is a completely editable PowerPoint presentation and is available for immediate download. Download now and impress your audience.
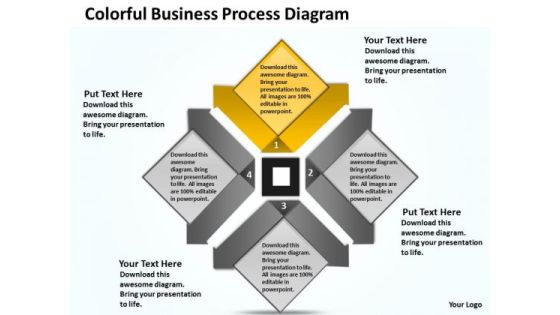
Business Model Diagrams PowerPoint Templates Backgrounds For Slides
We present our business model diagrams PowerPoint templates backgrounds for slides.Download our Business PowerPoint Templates because Our PowerPoint Templates and Slides will generate and maintain the level of interest you desire. They will create the impression you want to imprint on your audience. Present our Process and Flows PowerPoint Templates because You should Press the right buttons with our PowerPoint Templates and Slides. They will take your ideas down the perfect channel. Download our Success PowerPoint Templates because It will Raise the bar of your Thoughts. They are programmed to take you to the next level. Download our Flow Charts PowerPoint Templates because Our PowerPoint Templates and Slides will embellish your thoughts. See them provide the desired motivation to your team. Download and present our Arrows PowerPoint Templates because You can Zap them with our PowerPoint Templates and Slides. See them reel under the impact.Use these PowerPoint slides for presentations relating to Business, catalog, chart, demonstration, description, design, diagram, five, futuristic, green, illustration, information, interface, internet, level, list, marketing, model, multiple, navigation, network, pattern, pie, presentation, registry, report, section, space, sphere, statement, statistics, steps, structure, target. The prominent colors used in the PowerPoint template are Yellow, Gray, Black. People tell us our business model diagrams PowerPoint templates backgrounds for slides are specially created by a professional team with vast experience. They diligently strive to come up with the right vehicle for your brilliant Ideas. PowerPoint presentation experts tell us our five PowerPoint templates and PPT Slides will save the presenter time. Presenters tell us our business model diagrams PowerPoint templates backgrounds for slides look good visually. Use our chart PowerPoint templates and PPT Slides provide great value for your money. Be assured of finding the best projection to highlight your words. Customers tell us our business model diagrams PowerPoint templates backgrounds for slides have awesome images to get your point across. People tell us our five PowerPoint templates and PPT Slides effectively help you save your valuable time.
KPI Dashboard For Tracking Corporate Objectives Progress Template PDF
Following slide demonstrates progress tracking dashboard to determine objectives achieved by business. It includes elements such as objectives achieved, unachieved objectives, objectives achievement in progress and all objectives status. Showcasing this set of slides titled KPI Dashboard For Tracking Corporate Objectives Progress Template PDF. The topics addressed in these templates are Objectives Achieved, Unachieved Objectives, Objectives Progress . All the content presented in this PPT design is completely editable. Download it and make adjustments in color, background, font etc. as per your unique business setting.

Core Tools And Techniques Used In DSDM Timeboxing Ppt File Inspiration PDF Wd Ppt Icon Graphics Example PDF
This slide portrays details about core tools and techniques used in dynamic system development model. Here the technique covered is Timeboxing along with its benefits. This is a core tools and techniques used in dsdm timeboxing ppt file inspiration pdf template with various stages. Focus and dispense information on two stages using this creative set, that comes with editable features. It contains large content boxes to add your information on topics like core tools and techniques used in dsdm timeboxing. You can also showcase facts, figures, and other relevant content using this PPT layout. Grab it now.

Diverging Arrow Pointing Strategic Planning Process Radial PowerPoint Slide
We present our diverging arrow pointing strategic planning process Radial PowerPoint Slide.Download our Process and Flows PowerPoint Templates because your findings are here to help arrive at an accurate diagnosis. Download and present our Flow Charts PowerPoint Templates because to achieve sureshot success you need to come together at the right time, place and manner. Download our Arrows PowerPoint Templates because you have had your share of being a goldfish in a small bowl.you are ready to launch out and spread your wings. Use our Marketing PowerPoint Templates because customer satisfaction is a mantra of the marketplace. Building a loyal client base is an essential element of your business. Download our Shapes PowerPoint Templates because this structure meant to ensure smooth transition to the next level.Use these PowerPoint slides for presentations relating to Arrow, art, artistic,background, caricature, chart, childish,circular, creative, design, diagram,doodle, draw, flow, graffiti, graphic,grunge, hand, handwritten, icon,illustration, image, isolated, object, pie, pieces, process, raster,report, retro, rough, scribble, segmented, simple, sketch, sketchy, slices,statistic, styling, succeed, success,symbol. The prominent colors used in the PowerPoint template are Yellow, Black, White. Professionals tell us our diverging arrow pointing strategic planning process Radial PowerPoint Slide are Amazing. People tell us our artistic PowerPoint templates and PPT Slides help you meet deadlines which are an element of today's workplace. Just browse and pick the slides that appeal to your intuitive senses. The feedback we get is that our diverging arrow pointing strategic planning process Radial PowerPoint Slide are Breathtaking. Presenters tell us our background PowerPoint templates and PPT Slides are Dynamic. You can be sure our diverging arrow pointing strategic planning process Radial PowerPoint Slide are Gorgeous. PowerPoint presentation experts tell us our artistic PowerPoint templates and PPT Slides are Fun.

Diverging Arrow Process Diagram Relative Circular Flow PowerPoint Templates
We present our diverging arrow process diagram Relative Circular Flow PowerPoint templates.Present our Circle Charts PowerPoint Templates because this slide brings grey areas to the table and explain in detail you assessment of the need for care to ensure continued smooth progress. Download and present our Globe PowerPoint Templates because you can see In any endeavour people matter most. Present our Process and Flows PowerPoint Templates because this slide depicts the occasion for gifting and giving. Download and present our Flow Charts PowerPoint Templates because you can Organize your thoughts and illuminate your ideas accordingly. Use our Business PowerPoint Templates because you can Lead your flock steadily to greater heights. Look around at the vast potential of achievement around you.Use these PowerPoint slides for presentations relating to Arrow, art, artistic,background, caricature, chart, childish,circular, creative, design, diagram,doodle, draw, flow, graffiti, graphic,grunge, hand, handwritten, icon,illustration, image, isolated, object, pie, pieces, process, raster,report, retro, rough, scribble, segmented, simple, sketch, sketchy, slices,statistic, styling, succeed, success,symbol. The prominent colors used in the PowerPoint template are Green, Black, Blue. Professionals tell us our diverging arrow process diagram Relative Circular Flow PowerPoint templates look good visually. People tell us our chart PowerPoint templates and PPT Slides are second to none. The feedback we get is that our diverging arrow process diagram Relative Circular Flow PowerPoint templates are Wonderful. Presenters tell us our caricature PowerPoint templates and PPT Slides provide great value for your money. Be assured of finding the best projection to highlight your words. You can be sure our diverging arrow process diagram Relative Circular Flow PowerPoint templates are Lush. PowerPoint presentation experts tell us our artistic PowerPoint templates and PPT Slides are Attractive.

Four Steps Pyramid Diagram Templates PowerPoint Chart
We present our Four steps Pyramid Diagram templates powerpoint Chart.Present our Finance PowerPoint Templates because this template helps you to delve on these thoughts and brief your team on the value of your depth of understanding of the subject. Download our Business PowerPoint Templates because it helps you to explain your plans in all earnest to your colleagues and raise the bar for all. Use our Shapes PowerPoint Templates because to achieve sureshot success you need to come together at the right time, place and manner. Use our Pyramids PowerPoint Templates because pyramids are a symbol of the continuity of life. Download our Signs PowerPoint Templates because this diagram provides trainers a tool to teach the procedure in a highly visual, engaging way.Use these PowerPoint slides for presentations relating to 3d, Abstract, Business, Chart, Color, Colorful, Concept, Conceptual, Diagram, Financial, Four, Graph, Green, Growth, Hierarchy, Illustration, Increase, Isolated, Layer, Level, Multi-Colored, Multicolored, Orange, Part, Performance, Polychrome, Presentation, Progress, Pyramid, Red, Render, Rendered, Report, Results, Section, Shape, Sliced, Stage, Statistics, Status, Step, Success, Triangle. The prominent colors used in the PowerPoint template are Blue, Red, Green. We assure you our Four steps Pyramid Diagram templates powerpoint Chart are Awesome. Customers tell us our Diagram PowerPoint templates and PPT Slides are Radiant. The feedback we get is that our Four steps Pyramid Diagram templates powerpoint Chart are Clever. We assure you our Conceptual PowerPoint templates and PPT Slides are Fashionable. People tell us our Four steps Pyramid Diagram templates powerpoint Chart are incredible easy to use. We assure you our Colorful PowerPoint templates and PPT Slides are specially created by a professional team with vast experience. They diligently strive to come up with the right vehicle for your brilliant Ideas.

Keyword Performance Analysis With KPI Dashboard Ppt Summary Templates PDF
The following slide depicts the campaign keyword results to grab valuable insights and refine targeting. It includes key performance indicators such as cost per lead, total page likes, exit rate, organic click through rate, website traffic average ranking etc. Welcome to our selection of the Keyword Performance Analysis With KPI Dashboard Ppt Summary Templates PDF. These are designed to help you showcase your creativity and bring your sphere to life. Planning and Innovation are essential for any business that is just starting out. This collection contains the designs that you need for your everyday presentations. All of our PowerPoints are 100 percent editable, so you can customize them to suit your needs. This multi purpose template can be used in various situations. Grab these presentation templates today.
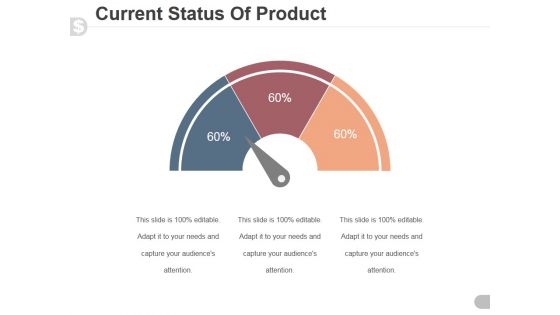
Current Status Of Product Ppt PowerPoint Presentation Designs Download
This is a current status of product ppt powerpoint presentation designs download. This is a three stage process. The stages in this process are speedometer, dashboard, business, marketing, finance.
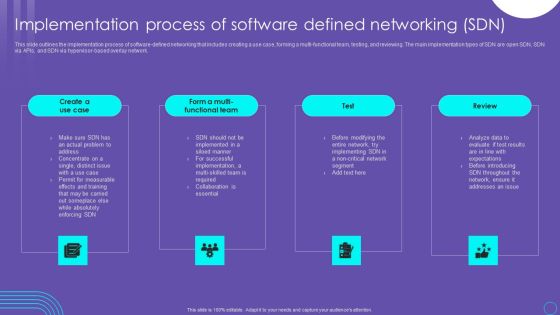
SDN Security Architecture Implementation Process Of Software Defined Networking SDN Diagrams PDF
This slide outlines the implementation process of software defined networking that includes creating a use case, forming a multi functional team, testing, and reviewing. The main implementation types of SDN are open SDN, SDN via APIs, and SDN via hypervisor based overlay network. The SDN Security Architecture Implementation Process Of Software Defined Networking SDN Diagrams PDF is a compilation of the most recent design trends as a series of slides. It is suitable for any subject or industry presentation, containing attractive visuals and photo spots for businesses to clearly express their messages. This template contains a variety of slides for the user to input data, such as structures to contrast two elements, bullet points, and slides for written information. Slidegeeks is prepared to create an impression.

KPI Compare Dashboard Indicating Website Visitors With Sales Conversion Demonstration PDF
Pitch your topic with ease and precision using this KPI Compare Dashboard Indicating Website Visitors With Sales Conversion Demonstration PDF This layout presents information on KPI Compare Dashboard Indicating Website Visitors With Sales Conversion It is also available for immediate download and adjustment. So, changes can be made in the color, design, graphics or any other component to create a unique layout.
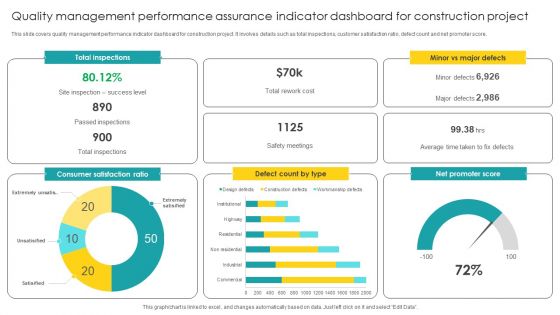
Quality Management Performance Assurance Indicator Dashboard For Construction Project Pictures PDF
Pitch your topic with ease and precision using this Quality Management Performance Assurance Indicator Dashboard For Construction Project Pictures PDF. This layout presents information on Assurance Indicator, Dashboard For Construction Project. It is also available for immediate download and adjustment. So, changes can be made in the color, design, graphics or any other component to create a unique layout.

Edtech Service Launch And Promotion Plan What Strategies Can Be Adopted For Overcoming Issues Designs PDF
This slide showcases organic and inorganic strategies that can help organization to achieve goals and grow in target market. It also showcases risk and investment involved in both strategies. The Edtech Service Launch And Promotion Plan What Strategies Can Be Adopted For Overcoming Issues Designs PDF is a compilation of the most recent design trends as a series of slides. It is suitable for any subject or industry presentation, containing attractive visuals and photo spots for businesses to clearly express their messages. This template contains a variety of slides for the user to input data, such as structures to contrast two elements, bullet points, and slides for written information. Slidegeeks is prepared to create an impression.

Key Performance Indicator Analytics Dashboard Ppt PowerPoint Presentation Model Example Topics
This is a key performance indicator analytics dashboard ppt powerpoint presentation model example topics. This is a five stage process. The stages in this process are kpi proposal, kpi plan, kpi scheme.
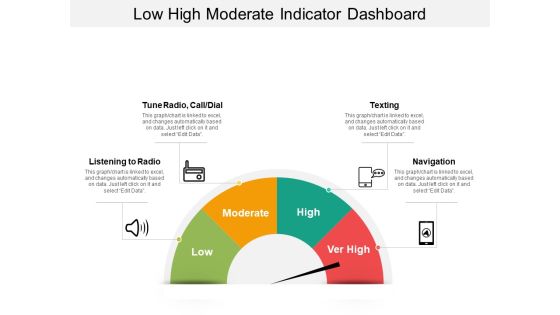
Low High Moderate Indicator Dashboard Ppt Powerpoint Presentation Infographic Template Example 2015
This is a low high moderate indicator dashboard ppt powerpoint presentation infographic template example 2015. This is a four stage process. The stages in this process are disturbance, distraction, interruption, diversion.

Kpi And Dashboard Kpi Dashboards Ppt PowerPoint Presentation Layouts
This is a kpi and dashboard kpi dashboards ppt powerpoint presentation layouts. This is a two stage process. The stages in this process are finance, strategy, analysis, marketing.

Consumer Statistics Dashboard Highlighting Transaction KPI Ppt PowerPoint Presentation Gallery Graphics Design PDF
Presenting this set of slides with name consumer statistics dashboard highlighting transaction kpi ppt powerpoint presentation gallery graphics design pdf. The topics discussed in these slides are transaction, social, process. This is a completely editable PowerPoint presentation and is available for immediate download. Download now and impress your audience.
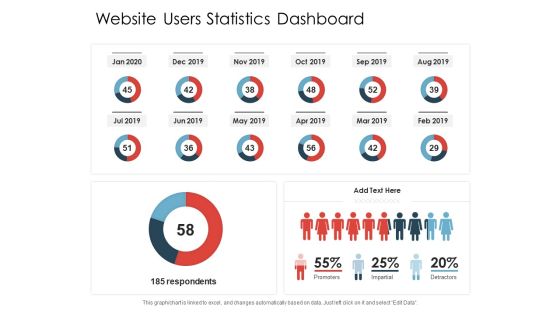
Website Users Statistics Dashboard Ppt PowerPoint Presentation Gallery Design Inspiration PDF
Presenting this set of slides with name website users statistics dashboard ppt powerpoint presentation gallery design inspiration pdf. The topics discussed in these slides are promoters, impartial, detractors. This is a completely editable PowerPoint presentation and is available for immediate download. Download now and impress your audience.

Employee Statistics Dashboard With Satisfaction Survey Result Ppt PowerPoint Presentation Portfolio Slide Download PDF
Presenting this set of slides with name employee statistics dashboard with satisfaction survey result ppt powerpoint presentation portfolio slide download pdf. The topics discussed in these slides are satisfaction survey result, employee age breakdown, employee turnover rate, employee absenteeism, employee status, employee gender split. This is a completely editable PowerPoint presentation and is available for immediate download. Download now and impress your audience.
Key Statistics Of Marketing Marketing Management Dashboard Customers Ppt PowerPoint Presentation Icon Microsoft PDF
Deliver an awe-inspiring pitch with this key statistics of marketing marketing management dashboard customers ppt powerpoint presentation icon microsoft pdf bundle. Topics like active customers, solid units, total revenue, net profit, customers region, new customer signups can be discussed with this completely editable template. It is available for immediate download depending on the needs and requirements of the user.

Key Statistics Of Marketing Marketing Management Dashboard Spend Ppt PowerPoint Presentation Portfolio Slide Portrait PDF
Deliver an awe-inspiring pitch with this creative key statistics of marketing marketing management dashboard spend ppt powerpoint presentation portfolio slide portrait pdf bundle. Topics like display, organic, paid, referral, roi per marketing channel, spend, revenue, roi can be discussed with this completely editable template. It is available for immediate download depending on the needs and requirements of the user.

Visual Representation Of 8 Stages 2 Sales Business Plan Outline PowerPoint Slides
We present our visual representation of 8 stages 2 sales business plan outline PowerPoint Slides.Present our Process and flow PowerPoint Templates because all elements of the venture are equally critical. Download and present our Business PowerPoint Templates because different people with differing ideas and priorities perform together to score. Download and present our Arrows PowerPoint Templates because there is a vision, a need you can meet. Download our Flow chart PowerPoint Templates because this template with an image of helps you chart the course of your presentation. Download our Marketing PowerPoint Templates because this slide imprint them on the minds of your audience via our slides.Use these PowerPoint slides for presentations relating to Arrow, art, artistic,background, caricature, chart, childish,circular, creative, design, diagram,doodle, draw, flow, graffiti, graphic,grunge, hand, handwritten, icon,illustration, image, isolated, object, pie, pieces, process, raster,report, retro, rough, scribble, segmented, simple, sketch, sketchy, slices,statistic, styling, succeed, success,symbol. The prominent colors used in the PowerPoint template are Brown, Black, White. PowerPoint presentation experts tell us our visual representation of 8 stages 2 sales business plan outline PowerPoint Slides will get their audience's attention. PowerPoint presentation experts tell us our creative PowerPoint templates and PPT Slides are Gorgeous. You can be sure our visual representation of 8 stages 2 sales business plan outline PowerPoint Slides are Versatile. You can be sure our circular PowerPoint templates and PPT Slides are designed to make your presentations professional. PowerPoint presentation experts tell us our visual representation of 8 stages 2 sales business plan outline PowerPoint Slides are Wonderful. People tell us our creative PowerPoint templates and PPT Slides are Dynamic.
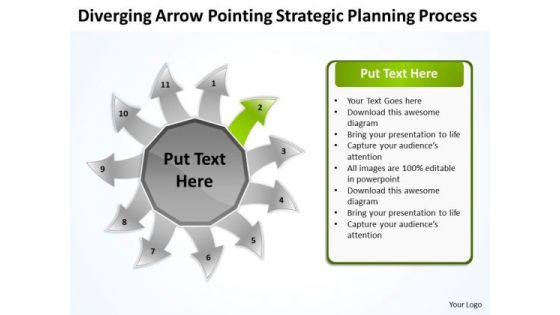
Diverging Arrow Pointing Strategic Planning Process Ppt Radial PowerPoint Slides
We present our diverging arrow pointing strategic planning process ppt Radial PowerPoint Slides.Present our Process and Flows PowerPoint Templates because this slide illuminates the spiritual brilliance of Jesus and showers the love for mankind he showed even while being crucified. Download our Flow Charts PowerPoint Templates because with the help of our Slides you can Illustrate your plans to your listeners with the same accuracy. Download our Arrows PowerPoint Templates because your marketing strategies can funnel down to the cone, stage by stage, refining as you go along. Download our Marketing PowerPoint Templates because networking is an imperative in todays world. You need to access the views of others. Similarly you need to give access to them of your abilities. Use our Shapes PowerPoint Templates because it shows them how to persistently hit bullseye.Use these PowerPoint slides for presentations relating to Arrow, art, artistic,background, caricature, chart, childish,circular, creative, design, diagram,doodle, draw, flow, graffiti, graphic,grunge, hand, handwritten, icon,illustration, image, isolated, object, pie, pieces, process, raster,report, retro, rough, scribble, segmented, simple, sketch, sketchy, slices,statistic, styling, succeed, success,symbol. The prominent colors used in the PowerPoint template are Yellow, Gray, Black. Professionals tell us our diverging arrow pointing strategic planning process ppt Radial PowerPoint Slides are topically designed to provide an attractive backdrop to any subject. People tell us our circular PowerPoint templates and PPT Slides are specially created by a professional team with vast experience. They diligently strive to come up with the right vehicle for your brilliant Ideas. The feedback we get is that our diverging arrow pointing strategic planning process ppt Radial PowerPoint Slides are Wistful. Presenters tell us our childish PowerPoint templates and PPT Slides are Luxuriant. You can be sure our diverging arrow pointing strategic planning process ppt Radial PowerPoint Slides are Fashionable. PowerPoint presentation experts tell us our chart PowerPoint templates and PPT Slides are Elevated.
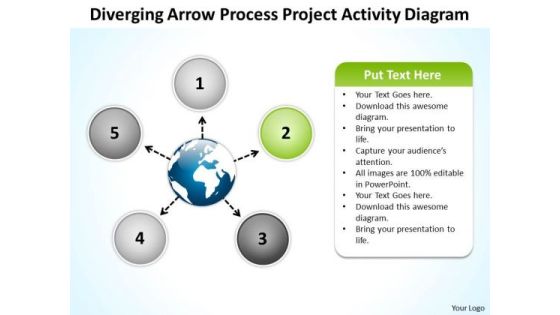
Diverging Arrow Process Project Activity Diagram Circle Radial Chart PowerPoint Slides
We present our diverging arrow process project activity diagram circle Radial Chart PowerPoint Slides.Download and present our Globe PowerPoint Templates because you can Flutter your wings and enchant the world. Impress them with the innate attractiveness of your thoughts and words. Use our Process and Flows PowerPoint Templates because your listeners do not have to put on their thinking caps. Present our Circle Charts PowerPoint Templates because they are Designed to attract the attention of your audience. Present our Ring Charts PowerPoint Templates because it is all there in bits and pieces. Download our Marketing PowerPoint Templates because The marketplace is the merger of your dreams and your ability. Use these PowerPoint slides for presentations relating to Arrow, art, chart, childish,circular, creative, design, diagram,doodle, draw, flow, graffiti, graphic,grunge, hand, handwritten, icon,illustration, image, isolated, object, pie, pieces, process, raster,report, retro, rough, scribble, segmented, simple, sketch, sketchy, slices,statistic, styling, succeed, success,symbol. The prominent colors used in the PowerPoint template are Yellow, Black, Blue. Professionals tell us our diverging arrow process project activity diagram circle Radial Chart PowerPoint Slides effectively help you save your valuable time. People tell us our chart PowerPoint templates and PPT Slides are Upbeat. The feedback we get is that our diverging arrow process project activity diagram circle Radial Chart PowerPoint Slides are Spiffy. Presenters tell us our design PowerPoint templates and PPT Slides are Appealing. You can be sure our diverging arrow process project activity diagram circle Radial Chart PowerPoint Slides are Adorable. PowerPoint presentation experts tell us our creative PowerPoint templates and PPT Slides are Dazzling.

Diverging Arrow Process Project Activity Diagram Ppt Radial Chart PowerPoint Slides
We present our diverging arrow process project activity diagram ppt Radial Chart PowerPoint Slides.Use our Arrows PowerPoint Templates because this slide illustrates your thoughts and experiences to your staff. Present our Flow Charts PowerPoint Templates because there are a bucketful of brilliant ideas swirling around within your group. Present our Process and Flows PowerPoint Templates because Our PowerPoint Templates and Slides will give you great value for your money. Be assured of finding the best projection to highlight your words. Download and present our Business PowerPoint Templates because the fruits of your labour are beginning to show.Enlighten them on the great plans you have for their enjoyment. Use our Shapes PowerPoint Templates because stable ideas are the building blocks of a sucessful structure.Use these PowerPoint slides for presentations relating to Arrow, art, artistic,background, caricature, chart, childish,circular, creative, design, diagram,doodle, draw, flow, graffiti, graphic,grunge, hand, handwritten, icon,illustration, image, isolated, object, pie, pieces, process, raster,report, retro, rough, scribble, segmented, simple, sketch, sketchy, slices,statistic, styling, succeed, success,symbol. The prominent colors used in the PowerPoint template are Blue navy, Black, Gray. Professionals tell us our diverging arrow process project activity diagram ppt Radial Chart PowerPoint Slides are Flirty. People tell us our caricature PowerPoint templates and PPT Slides are Bold. The feedback we get is that our diverging arrow process project activity diagram ppt Radial Chart PowerPoint Slides are Stylish. Presenters tell us our circular PowerPoint templates and PPT Slides are Clever. You can be sure our diverging arrow process project activity diagram ppt Radial Chart PowerPoint Slides are Energetic. PowerPoint presentation experts tell us our creative PowerPoint templates and PPT Slides are Great.
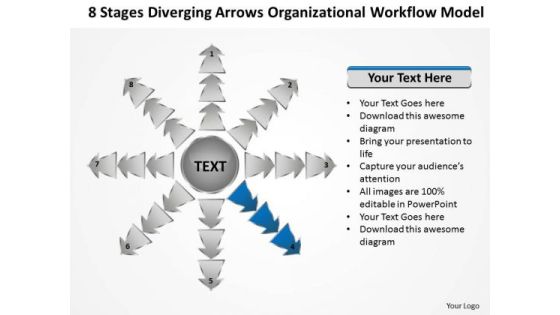
Diverging Arrows Organizational Workflow Model Circular Spoke Diagram PowerPoint Slides
We present our diverging arrows organizational workflow model Circular Spoke Diagram PowerPoint Slides.Use our Process and Flows PowerPoint Templates because you have a clear vision of the cake you want. Use our Arrows PowerPoint Templates because you can Unravel the desired and essential elements of your overall strategy. Download and present our Flow Charts PowerPoint Templates because this is An innovative slide design depicting driving home the relevance of a steady rhythm. Download and present our Marketing PowerPoint Templates because profit is fairly earned in what you believe. Use our Business PowerPoint Templates because you too have got the framework of your companys growth in place.Use these PowerPoint slides for presentations relating to Arrow, art, artistic,background, caricature, chart, childish,circular, creative, design, diagram,doodle, draw, flow, graffiti, graphic,grunge, hand, handwritten, icon,illustration, image, isolated, object, pie, pieces, process, raster,report, retro, rough, scribble, segmented, simple, sketch, sketchy, slices,statistic, styling, succeed, success,symbol. The prominent colors used in the PowerPoint template are Blue, Gray, White. Professionals tell us our diverging arrows organizational workflow model Circular Spoke Diagram PowerPoint Slides are Energetic. People tell us our childish PowerPoint templates and PPT Slides are Elegant. The feedback we get is that our diverging arrows organizational workflow model Circular Spoke Diagram PowerPoint Slides are Fashionable. Presenters tell us our caricature PowerPoint templates and PPT Slides are Great. You can be sure our diverging arrows organizational workflow model Circular Spoke Diagram PowerPoint Slides are readymade to fit into any presentation structure. PowerPoint presentation experts tell us our childish PowerPoint templates and PPT Slides are the best it can get when it comes to presenting.
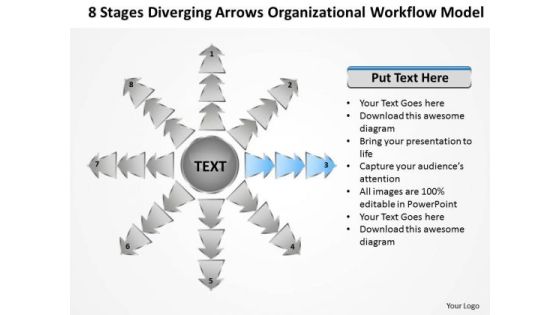
Diverging Arrows Organizational Workflow Model Cycle Process Diagram PowerPoint Slide
We present our diverging arrows organizational workflow model Cycle Process Diagram PowerPoint Slide.Download our Process and Flows PowerPoint Templates because you have the entire picture in mind. Download and present our Arrows PowerPoint Templates because this is the unerring accuracy in reaching the target. the effortless ability to launch into flight. Download and present our Flow Charts PowerPoint Templates because this diagram helps to reaffirm to your team your faith in maintaining the highest ethical standards. Download our Marketing PowerPoint Templates because networking is an imperative in todays world. You need to access the views of others. Similarly you need to give access to them of your abilities. Download our Business PowerPoint Templates because your product has established a foothold in the market. Customers are happy with the value it brings to their lives.Use these PowerPoint slides for presentations relating to Arrow, art, artistic,background, caricature, chart, childish,circular, creative, design, diagram,doodle, draw, flow, graffiti, graphic,grunge, hand, handwritten, icon,illustration, image, isolated, object, pie, pieces, process, raster,report, retro, rough, scribble, segmented, simple, sketch, sketchy, slices,statistic, styling, succeed, success,symbol. The prominent colors used in the PowerPoint template are Yellow, Black, Gray. Professionals tell us our diverging arrows organizational workflow model Cycle Process Diagram PowerPoint Slide are Fun. People tell us our circular PowerPoint templates and PPT Slides are Efficacious. The feedback we get is that our diverging arrows organizational workflow model Cycle Process Diagram PowerPoint Slide will get their audience's attention. Presenters tell us our background PowerPoint templates and PPT Slides are Luxuriant. You can be sure our diverging arrows organizational workflow model Cycle Process Diagram PowerPoint Slide are Breathtaking. PowerPoint presentation experts tell us our circular PowerPoint templates and PPT Slides are Charming.
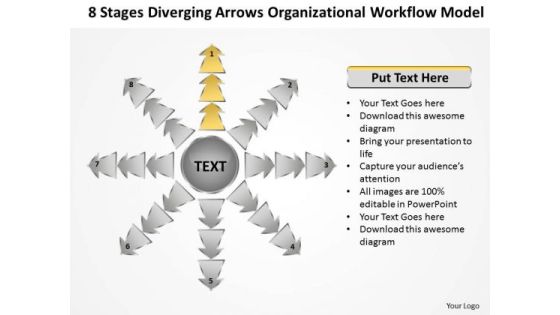
Diverging Arrows Organizational Workflow Model Cycle Process Diagram PowerPoint Slides
We present our diverging arrows organizational workflow model Cycle Process Diagram PowerPoint Slides.Use our Process and Flows PowerPoint Templates because you have it all down to a nicety, slice by slice, layer by layer. Use our Arrows PowerPoint Templates because this is a good example of the strength of teamwork. Download our Flow Charts PowerPoint Templates because this is a wonderful graphics to see the smiles of happiness spread as your audience realizes the value of your words. Present our Marketing PowerPoint Templates because The marketplace is the merger of your dreams and your ability. Download our Business PowerPoint Templates because you are sure you have the right people for your plans.Use these PowerPoint slides for presentations relating to Circular, creative, design, diagram,doodle, draw, flow, graffiti, graphic,grunge, hand, handwritten, icon,illustration, image, isolated, object, pie, pieces, process, raster,report, retro, rough, scribble, segmented, simple, sketch, sketchy, slices,statistic, styling, succeed, success,symbol. The prominent colors used in the PowerPoint template are Gray, Black, White. Professionals tell us our diverging arrows organizational workflow model Cycle Process Diagram PowerPoint Slides will save the presenter time. People tell us our graphic PowerPoint templates and PPT Slides are Tasteful. The feedback we get is that our diverging arrows organizational workflow model Cycle Process Diagram PowerPoint Slides effectively help you save your valuable time. Presenters tell us our doodle PowerPoint templates and PPT Slides are Luxurious. You can be sure our diverging arrows organizational workflow model Cycle Process Diagram PowerPoint Slides are Striking. PowerPoint presentation experts tell us our diagram PowerPoint templates and PPT Slides are One-of-a-kind.
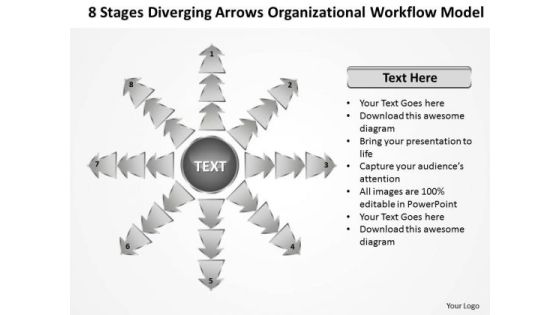
Diverging Arrows Organizational Workflow Model Network Software PowerPoint Slides
We present our diverging arrows organizational workflow model Network Software PowerPoint Slides.Use our Process and Flows PowerPoint Templates because your marketing strategies can funnel down to the cone, stage by stage, refining as you go along. Download our Arrows PowerPoint Templates because you have the people in place, selected the team leaders and all are raring to go. Present our Flow Charts PowerPoint Templates because it Creates a winner with your passion and dream. Download and present our Marketing PowerPoint Templates because networking is an imperative in todays world. You need to access the views of others. Similarly you need to give access to them of your abilities. Use our Business PowerPoint Templates because this structure meant to ensure smooth transition to the next level.Use these PowerPoint slides for presentations relating to Arrow, art, artistic,background, caricature, chart, childish,circular, creative, design, diagram,doodle, draw, flow, graffiti, graphic,grunge, hand, handwritten, icon,illustration, image, isolated, object, pie, pieces, process, raster,report, retro, rough, scribble, segmented, simple, sketch, sketchy, slices,statistic, styling, succeed, success,symbol. The prominent colors used in the PowerPoint template are Green, Black, White. Professionals tell us our diverging arrows organizational workflow model Network Software PowerPoint Slides are Chic. People tell us our circular PowerPoint templates and PPT Slides are Perfect. The feedback we get is that our diverging arrows organizational workflow model Network Software PowerPoint Slides are Swanky. Presenters tell us our background PowerPoint templates and PPT Slides are Ritzy. You can be sure our diverging arrows organizational workflow model Network Software PowerPoint Slides are Fabulous. PowerPoint presentation experts tell us our circular PowerPoint templates and PPT Slides are Attractive.

Kpi Metrics Dashboard To Measure Online Merchandising Strategy Effectiveness Retail Merchandising Techniques Sample PDF
The following slide outlines KPI metrics dashboard which can be used to measure the effectiveness of online marketing on retail store. The metrics covered in the slide are new orders, total income, expense, new users, best selling products, etc.Are you searching for a Kpi Metrics Dashboard To Measure Online Merchandising Strategy Effectiveness Retail Merchandising Techniques Sample PDF that is uncluttered, straightforward, and original Its easy to edit, and you can change the colors to suit your personal or business branding. For a presentation that expresses how much effort you ve put in, this template is ideal With all of its features, including tables, diagrams, statistics, and lists, its perfect for a business plan presentation. Make your ideas more appealing with these professional slides. Download Kpi Metrics Dashboard To Measure Online Merchandising Strategy Effectiveness Retail Merchandising Techniques Sample PDF from Slidegeeks today.

Financial Highlights Template 1 Ppt PowerPoint Presentation Slides
This is a financial highlights template 1 ppt powerpoint presentation slides. This is a two stage process. The stages in this process are sales, operating expenses, operating income, net income.

Digital And Offline Marketing Campaign Comparison Dashboard Ppt Inspiration Microsoft PDF
This slide showcases analysis of offline and online marketing in a dashboard covering key metrics. Performance indicators involved are purchases, free trial pay up rate and sign ups and monthly visitors. Pitch your topic with ease and precision using this Digital And Offline Marketing Campaign Comparison Dashboard Ppt Inspiration Microsoft PDF. This layout presents information on Online Marketing, Offline Marketing, Free Trial Sign, UPS. It is also available for immediate download and adjustment. So, changes can be made in the color, design, graphics or any other component to create a unique layout.
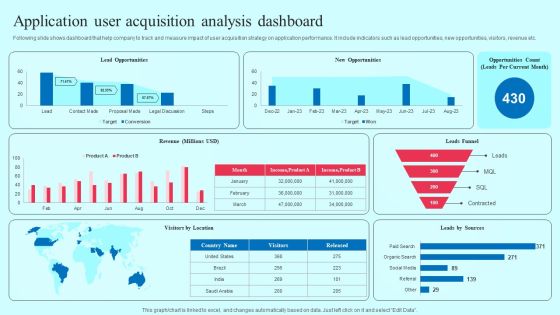
Smartphone Application User Acquisition Techniques Application User Acquisition Analysis Dashboard Information PDF
Following slide shows dashboard that help company to track and measure impact of user acquisition strategy on application performance. It include indicators such as lead opportunities, new opportunities, visitors, revenue etc. Boost your pitch with our creative Smartphone Application User Acquisition Techniques Application User Acquisition Analysis Dashboard Information PDF. Deliver an awe inspiring pitch that will mesmerize everyone. Using these presentation templates you will surely catch everyones attention. You can browse the ppts collection on our website. We have researchers who are experts at creating the right content for the templates. So you do not have to invest time in any additional work. Just grab the template now and use them.

Biochips Use Cases Blood Glucose Monitoring Dashboard Introduction PDF
This slide demonstrates the dashboard for monitoring the glucose level in blood-based on insulin onboard, carb intake, physical activity. Slidegeeks has constructed Biochips Use Cases Blood Glucose Monitoring Dashboard Introduction PDF after conducting extensive research and examination. These presentation templates are constantly being generated and modified based on user preferences and critiques from editors. Here, you will find the most attractive templates for a range of purposes while taking into account ratings and remarks from users regarding the content. This is an excellent jumping-off point to explore our content and will give new users an insight into our top-notch PowerPoint Templates.

Business Accomplishment Monitoring Process For Employee Evaluation Infographics PDF
This slide depicts comparative chart for performance management cycle. It includes stages such as feedback, setting goals, performance, development, recognition and workflow integration. Persuade your audience using this business accomplishment monitoring process for employee evaluation infographics pdf. This PPT design covers four stages, thus making it a great tool to use. It also caters to a variety of topics including business performance, leadership practices, customer results. Download this PPT design now to present a convincing pitch that not only emphasizes the topic but also showcases your presentation skills.
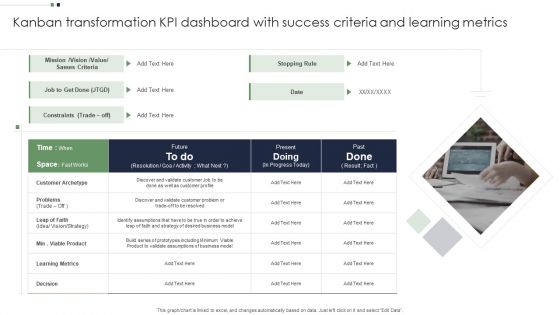
Kanban Transformation KPI Dashboard With Success Criteria And Learning Metrics Microsoft PDF
Persuade your audience using this Kanban Transformation KPI Dashboard With Success Criteria And Learning Metrics Microsoft PDF. This PPT design covers one stages, thus making it a great tool to use. It also caters to a variety of topics including Kanban Transformation KPI Dashboard, Success Criteria Learning Metrics. Download this PPT design now to present a convincing pitch that not only emphasizes the topic but also showcases your presentation skills.

Quarterly Employee Performance Appraisal Review Timeline Pictures PDF
This slide demonstrates about an employee performance review during its quarterly appraisal time to know exactly how he performed and what else is needed from his side. It also includes goals achieved, core values and improvements. Persuade your audience using this Quarterly Employee Performance Appraisal Review Timeline Pictures PDF. This PPT design covers Four stages, thus making it a great tool to use. It also caters to a variety of topics including Overall Performance, Goals Achieved, Improvement. Download this PPT design now to present a convincing pitch that not only emphasizes the topic but also showcases your presentation skills.

Content Marketing Dashboard For Effective Tracking B2B Electronic Commerce Startup Information PDF
Purpose of the following slide is to show key metrics that can help the organization to track their content marketing efforts, these metrics are ad cost, visits, cost per click etc. Find highly impressive Content Marketing Dashboard For Effective Tracking B2B Electronic Commerce Startup Information PDF on Slidegeeks to deliver a meaningful presentation. You can save an ample amount of time using these presentation templates. No need to worry to prepare everything from scratch because Slidegeeks experts have already done a huge research and work for you. You need to download Content Marketing Dashboard For Effective Tracking B2B Electronic Commerce Startup Information PDF for your upcoming presentation. All the presentation templates are 100 percent editable and you can change the color and personalize the content accordingly. Download now.

Monetary Planning And Evaluation Guide KPI Metrics Dashboard Highlighting Organization Revenue Profitability And Liquidity Ppt Diagram Images PDF
The following slide outlines key performance indicator KPI dashboard showcasing various financial metrics of the organization. The key metrics are gross revenue, product revenue, service revenue, gross profit, net profit etc. Coming up with a presentation necessitates that the majority of the effort goes into the content and the message you intend to convey. The visuals of a PowerPoint presentation can only be effective if it supplements and supports the story that is being told. Keeping this in mind our experts created Monetary Planning And Evaluation Guide KPI Metrics Dashboard Highlighting Organization Revenue Profitability And Liquidity Ppt Diagram Images PDF to reduce the time that goes into designing the presentation. This way, you can concentrate on the message while our designers take care of providing you with the right template for the situation.

Company Financial Performance Indicators Dashboard With Working Capital And Cash Conversion Icons PDF
This slide shows dashboard of finance KPIs . It covers working capital, cash conversion cycle, vendor payment error rate ,current assets and liabilities. Showcasing this set of slides titled Company Financial Performance Indicators Dashboard With Working Capital And Cash Conversion Icons PDF. The topics addressed in these templates are Current Working Capital, Current Liabilities, Working Capital. All the content presented in this PPT design is completely editable. Download it and make adjustments in color, background, font etc. as per your unique business setting.
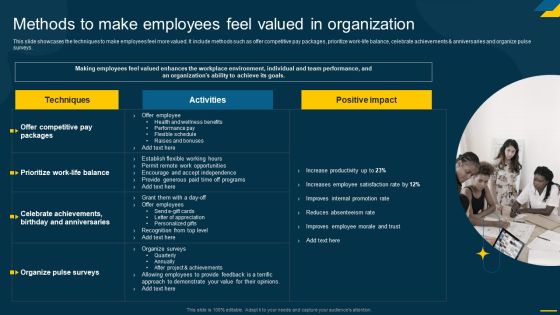
Engaging Employees Strategic Methods To Make Employees Feel Valued In Organization Infographics PDF
This slide showcases the techniques to make employees feel more valued. It include methods such as offer competitive pay packages, prioritize work-life balance, celebrate achievements and anniversaries and organize pulse surveys. The Engaging Employees Strategic Methods To Make Employees Feel Valued In Organization Infographics PDF is a compilation of the most recent design trends as a series of slides. It is suitable for any subject or industry presentation, containing attractive visuals and photo spots for businesses to clearly express their messages. This template contains a variety of slides for the user to input data, such as structures to contrast two elements, bullet points, and slides for written information. Slidegeeks is prepared to create an impression.

E Commerce Marketing Techniques To Boost Sales Mobile Marketing Plan For Online Retailer To Target Customers On Phone Summary PDF
This slide provides a glimpse of mobile marketing plan for an online retailer to set targets for customer engagements and revenue growth. It includes mobile marketing strategies to employ for achieving customer reach targets. The E Commerce Marketing Techniques To Boost Sales Mobile Marketing Plan For Online Retailer To Target Customers On Phone Summary PDF is a compilation of the most recent design trends as a series of slides. It is suitable for any subject or industry presentation, containing attractive visuals and photo spots for businesses to clearly express their messages. This template contains a variety of slides for the user to input data, such as structures to contrast two elements, bullet points, and slides for written information. Slidegeeks is prepared to create an impression.
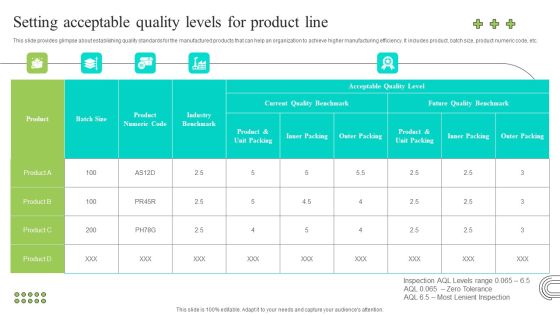
Effective Production Planning And Monitoring Techniques Setting Acceptable Quality Levels For Product Line Guidelines PDF
This slide provides glimpse about establishing quality standards for the manufactured products that can help an organization to achieve higher manufacturing efficiency. It includes product, batch size, product numeric code, etc. The Effective Production Planning And Monitoring Techniques Setting Acceptable Quality Levels For Product Line Guidelines PDF is a compilation of the most recent design trends as a series of slides. It is suitable for any subject or industry presentation, containing attractive visuals and photo spots for businesses to clearly express their messages. This template contains a variety of slides for the user to input data, such as structures to contrast two elements, bullet points, and slides for written information. Slidegeeks is prepared to create an impression.
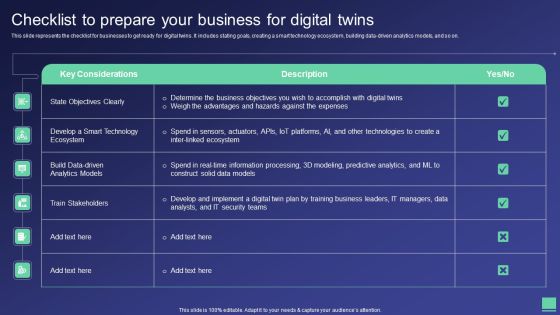
Digital Twin Tech IT Checklist To Prepare Your Business For Digital Twins Inspiration PDF
This slide represents the checklist for businesses to get ready for digital twins. It includes stating goals, creating a smart technology ecosystem, building data-driven analytics models, and so on. Present like a pro with Digital Twin Tech IT Checklist To Prepare Your Business For Digital Twins Inspiration PDF Create beautiful presentations together with your team, using our easy-to-use presentation slides. Share your ideas in real-time and make changes on the fly by downloading our templates. So whether youre in the office, on the go, or in a remote location, you can stay in sync with your team and present your ideas with confidence. With Slidegeeks presentation got a whole lot easier. Grab these presentations today.
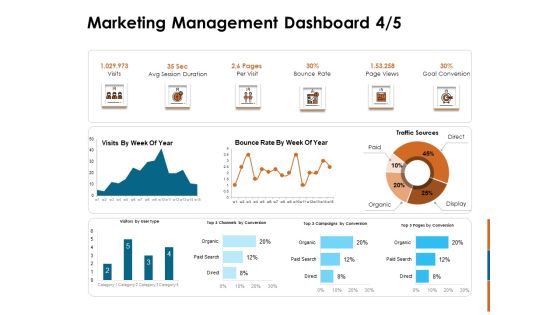
Key Statistics Of Marketing Marketing Management Dashboard Rate Ppt PowerPoint Presentation Show Graphics Template PDF
Deliver and pitch your topic in the best possible manner with this key statistics of marketing marketing management dashboard rate ppt powerpoint presentation show graphics template pdf. Use them to share invaluable insights on visits, avg session duration, per visit, bounce rate, page views, goal conversion and impress your audience. This template can be altered and modified as per your expectations. So, grab it now.
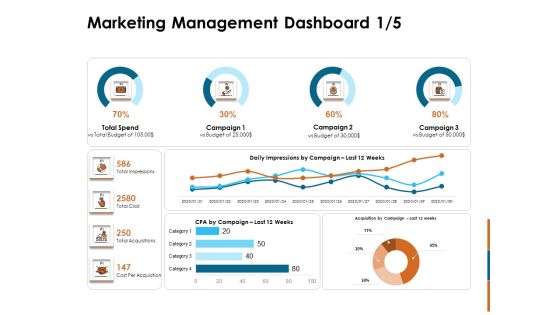
Key Statistics Of Marketing Marketing Management Dashboard Ppt PowerPoint Presentation Slides Templates PDF
Deliver and pitch your topic in the best possible manner with this key statistics of marketing marketing management dashboard ppt powerpoint presentation slides templates pdf. Use them to share invaluable insights on total impressions, total click, total acquisitions, cost per acquisition, total spend, acquisition campaign last 12 weeks and impress your audience. This template can be altered and modified as per your expectations. So, grab it now.

Vendor Relationship Management Strategic Plan KPI Dashboard For Supplier Monitoring Infographics PDF
The slide depicts the KPI dashboard for the supplier monitoring. It provides information regarding the monthly purchase value, number of contracted suppliers, scheduled and completed audits along with vendors quality performance. Coming up with a presentation necessitates that the majority of the effort goes into the content and the message you intend to convey. The visuals of a PowerPoint presentation can only be effective if it supplements and supports the story that is being told. Keeping this in mind our experts created Vendor Relationship Management Strategic Plan KPI Dashboard For Supplier Monitoring Infographics PDF to reduce the time that goes into designing the presentation. This way, you can concentrate on the message while our designers take care of providing you with the right template for the situation.
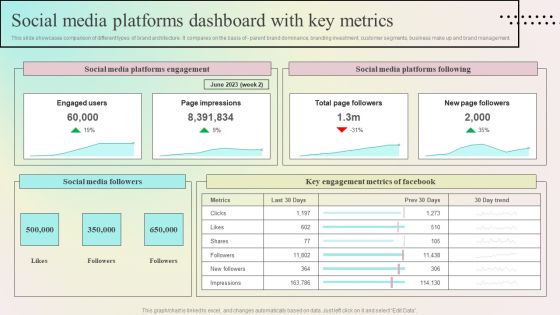
Enhancing Organic Reach Social Media Platforms Dashboard With Key Metrics Guidelines PDF
This slide showcases comparison of different types of brand architecture. It compares on the basis of - parent brand dominance, branding investment, customer segments, business make up and brand management. Are you searching for a Enhancing Organic Reach Social Media Platforms Dashboard With Key Metrics Guidelines PDF that is uncluttered, straightforward, and original Its easy to edit, and you can change the colors to suit your personal or business branding. For a presentation that expresses how much effort youve put in, this template is ideal With all of its features, including tables, diagrams, statistics, and lists, its perfect for a business plan presentation. Make your ideas more appealing with these professional slides. Download Enhancing Organic Reach Social Media Platforms Dashboard With Key Metrics Guidelines PDF from Slidegeeks today.

Skill Requirement For The Success Of Key Account Manager Ideas PDF
This slide provides information about the skills that are required by the key account manager in the company such as awareness of client strategy, effective leadership qualities, strong business acumen and analytical skill ability. The Skill Requirement For The Success Of Key Account Manager Ideas PDF is a compilation of the most recent design trends as a series of slides. It is suitable for any subject or industry presentation, containing attractive visuals and photo spots for businesses to clearly express their messages. This template contains a variety of slides for the user to input data, such as structures to contrast two elements, bullet points, and slides for written information. Slidegeeks is prepared to create an impression.

Employee Health And Risk Key Performance Indicator Dashboard Ppt Layouts Brochure PDF
The following slide highlights the employee health and safety key performance indicator dashboard illustrating narrow escapes, potential hazards, improvement opportunity, total incidents, health and safety learning, safety visit by management, ltir and trir, severe injuries and fatalities and safety goals. Showcasing this set of slides titled Employee Health And Risk Key Performance Indicator Dashboard Ppt Layouts Brochure PDF. The topics addressed in these templates are Narrow Escapes, Potential Hazards, Improvement Opportunity. All the content presented in this PPT design is completely editable. Download it and make adjustments in color, background, font etc. as per your unique business setting.
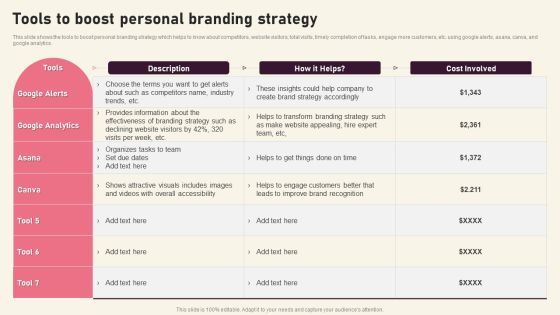
Tools To Boost Personal Branding Strategy Creating Branding Techniques To Increase Brand Awareness Clipart PDF
This slide shows the tools to boost personal branding strategy which helps to know about competitors, website visitors, total visits, timely completion of tasks, engage more customers, etc. using google alerts, asana, canva, and google analytics.The Tools To Boost Personal Branding Strategy Creating Branding Techniques To Increase Brand Awareness Clipart PDF is a compilation of the most recent design trends as a series of slides. It is suitable for any subject or industry presentation, containing attractive visuals and photo spots for businesses to clearly express their messages. This template contains a variety of slides for the user to input data, such as structures to contrast two elements, bullet points, and slides for written information. Slidegeeks is prepared to create an impression.

Energy Efficiency Dashboard To Track Campaign Effectiveness Pictures PDF
This slide consists of a dashboard which presents an energy saving dashboard which can be used to track effectiveness of energy saving program. The key performance indicators relate to energy sources, energy consumption by sectors, energy consumption by sectors etc. Pitch your topic with ease and precision using this Energy Efficiency Dashboard To Track Campaign Effectiveness Pictures PDF. This layout presents information on Energy Sources, Energy Usage, Trend Analysis. It is also available for immediate download and adjustment. So, changes can be made in the color, design, graphics or any other component to create a unique layout.
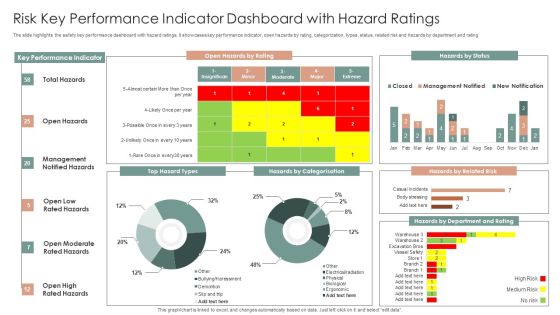
Risk Key Performance Indicator Dashboard With Hazard Ratings Ppt Layouts Slideshow PDF
The slide highlights the safety key performance dashboard with hazard ratings. It showcases key performance indicator, open hazards by rating, categorization, types, status, related risk and hazards by department and rating. Showcasing this set of slides titled Risk Key Performance Indicator Dashboard With Hazard Ratings Ppt Layouts Slideshow PDF. The topics addressed in these templates are Key Performance Indicator, Open Hazards, Hazards By Status. All the content presented in this PPT design is completely editable. Download it and make adjustments in color, background, font etc. as per your unique business setting.

Dashboard Of India Country Profile Statistics Ppt Ideas Format Ideas PDF
Persuade your audience using this Dashboard Of India Country Profile Statistics Ppt Ideas Format Ideas PDF. This PPT design covers one stages, thus making it a great tool to use. It also caters to a variety of topics including Human Development Index, Global Ghg Emissions, GDP Per Capita. Download this PPT design now to present a convincing pitch that not only emphasizes the topic but also showcases your presentation skills.

Brazil Country Profile Statistics Dashboard With GDP Per Capita Mockup PDF
Persuade your audience using this Brazil Country Profile Statistics Dashboard With GDP Per Capita Mockup PDF. This PPT design covers one stages, thus making it a great tool to use. It also caters to a variety of topics including Global Ghg Emissions, Human Development Index, GDP Per Capita. Download this PPT design now to present a convincing pitch that not only emphasizes the topic but also showcases your presentation skills.

Training Needs Assessment Dashboard For Employee Development Demonstration PDF
This slide shows the dashboard of training and development needs analysis. It includes KPIs such as average result area score and their reviews for different areas. Showcasing this set of slides titled training needs assessment dashboard for employee development demonstration pdf. The topics addressed in these templates are development, team, implementation. All the content presented in this PPT design is completely editable. Download it and make adjustments in color, background, font etc. as per your unique business setting.
 Home
Home