Data Quality
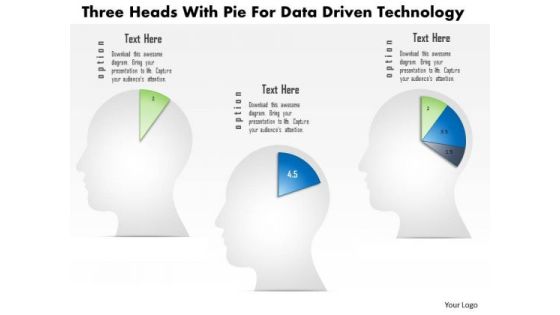
Business Diagram Three Heads With Pie For Data Driven Technology PowerPoint Slide
This business diagram displays three human faces with pie charts. This Power Point template has been designed to compare and present business data. You may use this diagram to impart professional appearance to your presentations.
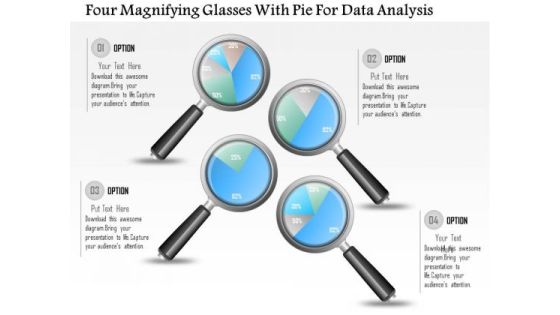
Business Diagram Four Magnifying Glasses With Pie For Data Analysis PowerPoint Slide
This business diagram displays graphic of pie charts in shape of magnifying glasses This business slide is suitable to present and compare business data. Use this diagram to build professional presentations for your viewers.
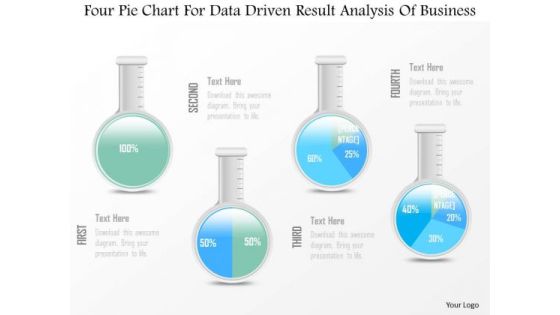
Business Diagram Four Pie Chart For Data Driven Result Analysis Of Business PowerPoint Slide
This business diagram displays graphic of pie charts in shape of flasks. This business slide is suitable to present and compare business data. Use this diagram to build professional presentations for your viewers.

Internal And External Sources Of Data Generation Ppt PowerPoint Presentation Gallery Information
Presenting this set of slides with name internal and external sources of data generation ppt powerpoint presentation gallery information. This is a three stage process. The stages in this process are data sources, database management, marketing. This is a completely editable PowerPoint presentation and is available for immediate download. Download now and impress your audience.

Data Collection Methods And Tools With Icons Ppt PowerPoint Presentation Pictures Structure
Presenting this set of slides with name data collection methods and tools with icons ppt powerpoint presentation pictures structure. This is a six stage process. The stages in this process are data sources, database management, marketing. This is a completely editable PowerPoint presentation and is available for immediate download. Download now and impress your audience.
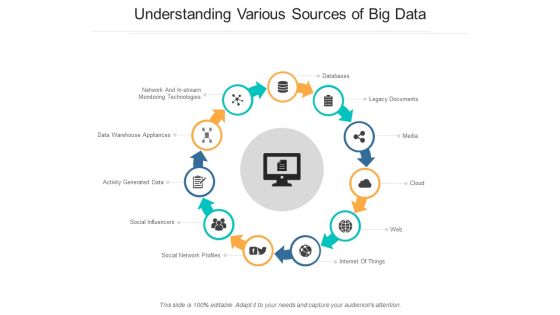
Understanding Various Sources Of Big Data Ppt PowerPoint Presentation Model Slide Download
Presenting this set of slides with name understanding various sources of big data ppt powerpoint presentation model slide download. This is a eleven stage process. The stages in this process are data sources, database management, marketing. This is a completely editable PowerPoint presentation and is available for immediate download. Download now and impress your audience.
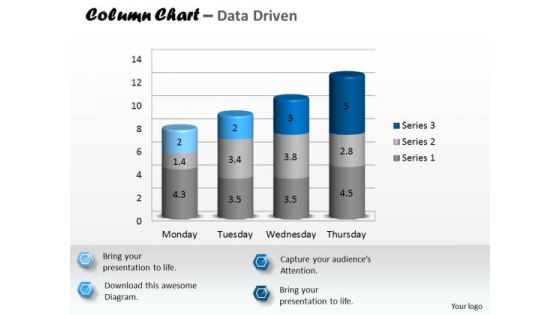
Data Analysis In Excel 3d Column Chart To Represent Information PowerPoint Templates
Rake In The Dough With
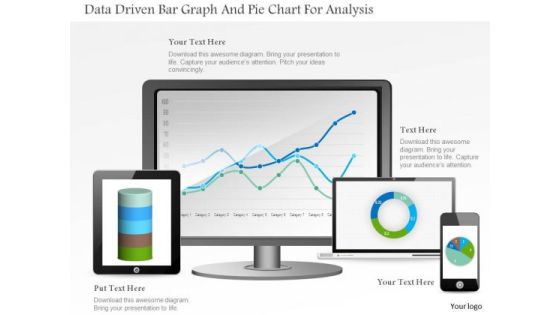
Business Diagram Data Driven Bar Graph And Pie Chart For Analysis PowerPoint Slide
This PowerPoint template displays technology gadgets with various business charts. Use this diagram slide, in your presentations to make business reports for statistical analysis. You may use this diagram to impart professional appearance to your presentations.
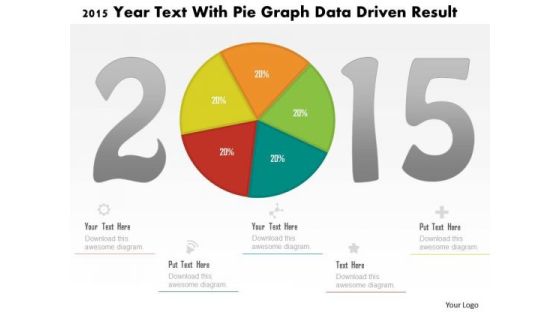
Business Diagram 2015 Year Text With Pie Graph Data Driven Result PowerPoint Slide
This business diagram displays 2015 year numbers with pie chart. This diagram is suitable to display business strategy for year 2015. Download this professional slide to present information in an attractive manner
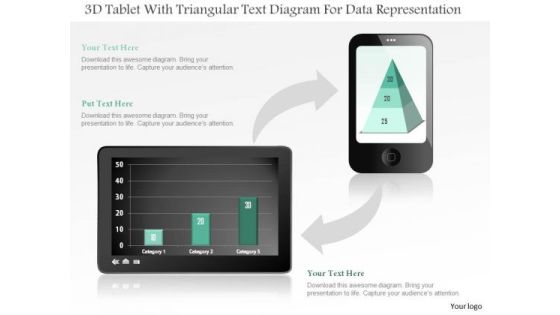
Business Diagram 3d Tablet With Triangular Text Diagram For Data Representation PowerPoint Slide
This business diagram displays bar graph on tablet and pyramid chart on mobile phone. Use this diagram, to make reports for interactive business presentations. Create professional presentations using this diagram.
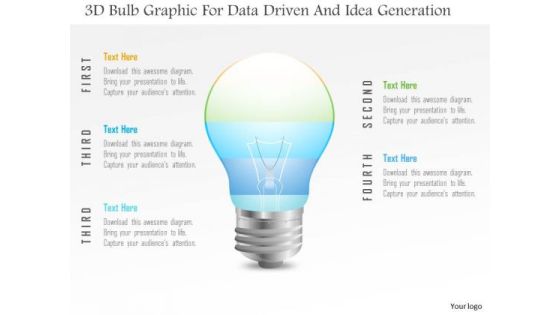
Business Diagram 3d Bulb Graphic For Data Driven And Idea Generation PowerPoint Slide
This Power Point template has been designed with 3d bulb graphic. Use this slide to represent technology idea and strategy concepts. Download this diagram for your business presentations and get exclusive comments on your efforts.
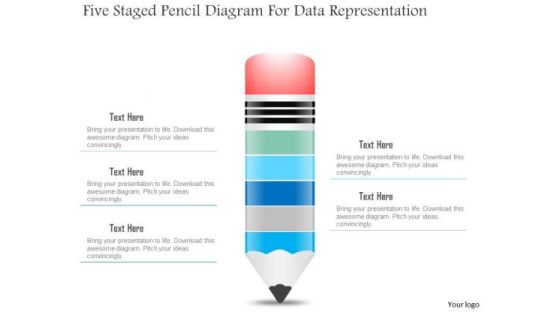
Business Diagram Five Staged Pencil Diagram For Data Representation PowerPoint Slide
This business slide displays five staged pencil diagram. It contains pencil graphic divided into five parts. This diagram slide depicts processes, stages, steps, points, options and education information display. Use this diagram, in your presentations to express your views innovatively.
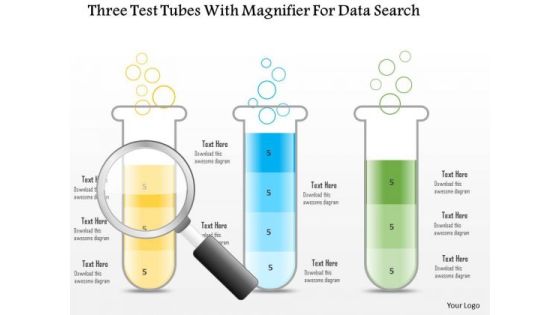
Business Diagram Three Test Tubes With Magnifier For Data Search PowerPoint Slide
This business diagram displays three test tubes with magnifying glass. This diagram is suitable to depict flow of business activities or steps. Download this professional slide to present information in an attractive manner.

Multivariate Data Analysis Driven Line Chart For Market Survey PowerPoint Slides Templates
Rake In The Dough With
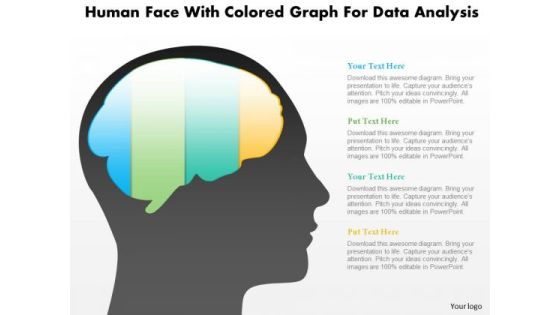
Business Diagram Human Face With Colored Graph For Data Analysis PowerPoint Slide
This diagram displays human face graphic with colored graph. This diagram can be used to represent strategy, planning, thinking of business plan. Display business options in your presentations by using this creative diagram.

Business Diagram Three Trucks For Data Representation For Business PowerPoint Slide
This business diagram displays three trucks graphic. This diagram contains trucks for percentage value growth. Use this diagram to display business growth over a period of time.
Threats Management Of Confidential Data Reports Icon Ppt Ideas Summary PDF
Persuade your audience using this Threats Management Of Confidential Data Reports Icon Ppt Ideas Summary PDF. This PPT design covers two stages, thus making it a great tool to use. It also caters to a variety of topics including Threats Management, Confidential Data Reports, Icon. Download this PPT design now to present a convincing pitch that not only emphasizes the topic but also showcases your presentation skills.

Deploying Content Distribution Network System Data Security Handled By CDN Sample PDF
This slide demonstrates how CDN protects data by issuing TLS or SSL certificates, blocking Bots and crawlers, and defending against DDoS assaults. If your project calls for a presentation, then Slidegeeks is your go-to partner because we have professionally designed, easy-to-edit templates that are perfect for any presentation. After downloading, you can easily edit Deploying Content Distribution Network System Data Security Handled By CDN Sample PDF and make the changes accordingly. You can rearrange slides or fill them with different images. Check out all the handy templates
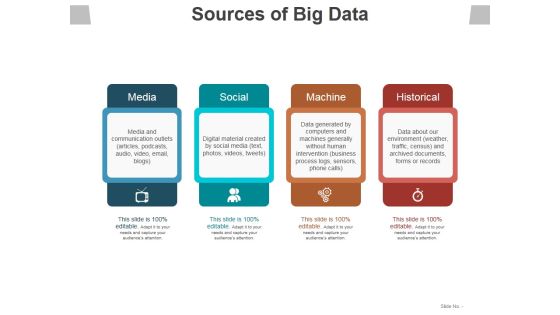
Sources Of Big Data Template 1 Ppt PowerPoint Presentation Summary Example Topics
This is a sources of big data template 1 ppt powerpoint presentation summary example topics. This is a four stage process. The stages in this process are media, social, machine, historical.
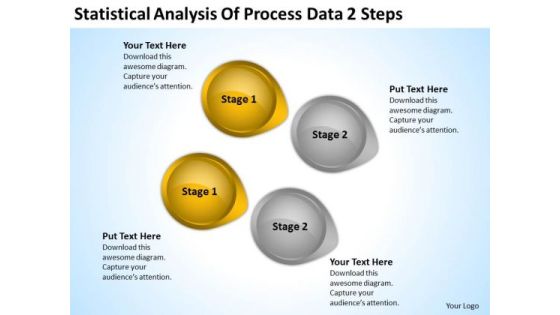
Levels Of Parallel Processing Data 2 Steps Ppt PowerPoint Templates Backgrounds For Slides
We present our levels of parallel processing data 2 steps ppt PowerPoint templates backgrounds for slides.Download and present our Business PowerPoint Templates because Our PowerPoint Templates and Slides will embellish your thoughts. See them provide the desired motivation to your team. Present our Circle Charts PowerPoint Templates because Our PowerPoint Templates and Slides offer you the needful to organise your thoughts. Use them to list out your views in a logical sequence. Download and present our Arrows PowerPoint Templates because Our PowerPoint Templates and Slides provide you with a vast range of viable options. Select the appropriate ones and just fill in your text. Present our Shapes PowerPoint Templates because Our PowerPoint Templates and Slides team portray an attitude of elegance. Personify this quality by using them regularly. Use our Signs PowerPoint Templates because Our PowerPoint Templates and Slides offer you the needful to organise your thoughts. Use them to list out your views in a logical sequence.Use these PowerPoint slides for presentations relating to 3d, abstract, analysis, arrow, background, business, button, chart, circle, circular, color, concept, conservation, cycle, development, diagram, direction, eco, ecology, energy, environment, flow, flowchart, globe, graphic, growing, growth, icon, internet, isolated, object, power, process, protection, recyclable, recycle, recycling, render, resource, saving, sign, solution, sphere, statistic, sustainable, symbol, technology, white. The prominent colors used in the PowerPoint template are Brown, Gray, Black. You can be sure our levels of parallel processing data 2 steps ppt PowerPoint templates backgrounds for slides look good visually. People tell us our analysis PowerPoint templates and PPT Slides are specially created by a professional team with vast experience. They diligently strive to come up with the right vehicle for your brilliant Ideas. You can be sure our levels of parallel processing data 2 steps ppt PowerPoint templates backgrounds for slides will impress their bosses and teams. Use our chart PowerPoint templates and PPT Slides are the best it can get when it comes to presenting. Presenters tell us our levels of parallel processing data 2 steps ppt PowerPoint templates backgrounds for slides look good visually. We assure you our chart PowerPoint templates and PPT Slides are topically designed to provide an attractive backdrop to any subject.
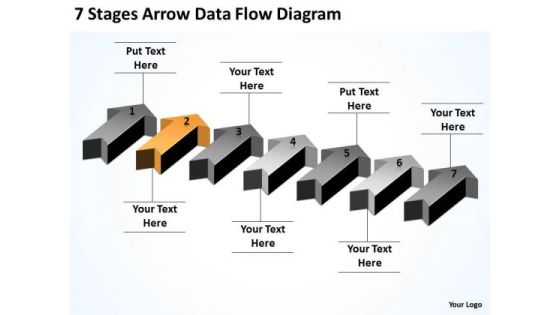
Explain Parallel Processing 7 Stages Arrow Data Flow Diagram PowerPoint Slides
We present our explain parallel processing 7 stages arrow data flow diagram PowerPoint Slides.Download our Business PowerPoint Templates because you can Break through with our PowerPoint Templates and Slides. Bring down the mental barriers of your audience. Use our Arrows PowerPoint Templates because It is Aesthetically crafted by artistic young minds. Our PowerPoint Templates and Slides are designed to display your dexterity. Use our Shapes PowerPoint Templates because They will Put your wonderful verbal artistry on display. Our PowerPoint Templates and Slides will provide you the necessary glam and glitter. Download and present our Success PowerPoint Templates because It can Conjure up grand ideas with our magical PowerPoint Templates and Slides. Leave everyone awestruck by the end of your presentation. Use our Signs PowerPoint Templates because Our PowerPoint Templates and Slides team portray an attitude of elegance. Personify this quality by using them regularly.Use these PowerPoint slides for presentations relating to 3d, achievement, aim, arrows, business, career, chart, competition,development, direction, education, financial, forecast, forward, glossy, graph,group, growth, higher, icon, increase, investment, leader, leadership, moving,onwards, outlook, path, plan, prediction, price, profit, progress, property, race,sales, series, success, target, team, teamwork, turn, up, upwards, vector, win,winner. The prominent colors used in the PowerPoint template are Orange, Gray, Black. We assure you our explain parallel processing 7 stages arrow data flow diagram PowerPoint Slides will get their audience's attention. PowerPoint presentation experts tell us our arrows PowerPoint templates and PPT Slides are second to none. The feedback we get is that our explain parallel processing 7 stages arrow data flow diagram PowerPoint Slides are specially created by a professional team with vast experience. They diligently strive to come up with the right vehicle for your brilliant Ideas. We assure you our business PowerPoint templates and PPT Slides will help them to explain complicated concepts. PowerPoint presentation experts tell us our explain parallel processing 7 stages arrow data flow diagram PowerPoint Slides will generate and maintain the level of interest you desire. They will create the impression you want to imprint on your audience. We assure you our business PowerPoint templates and PPT Slides are topically designed to provide an attractive backdrop to any subject.
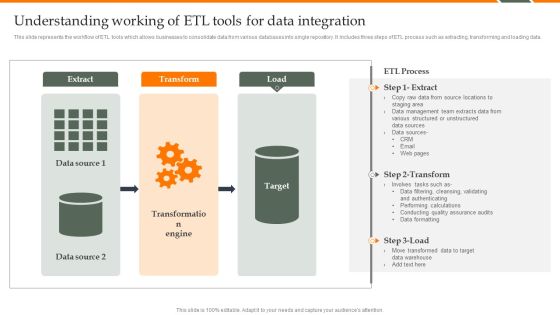
Human Resource Analytics Understanding Working Of ETL Tools For Data Integration Microsoft PDF
This slide represents the workflow of ETL tools which allows businesses to consolidate data from various databases into single repository. It includes three steps of ETL process such as extracting, transforming and loading data. Do you know about Slidesgeeks Human Resource Analytics Understanding Working Of ETL Tools For Data Integration Microsoft PDF These are perfect for delivering any kind od presentation. Using it, create PowerPoint presentations that communicate your ideas and engage audiences. Save time and effort by using our pre-designed presentation templates that are perfect for a wide range of topic. Our vast selection of designs covers a range of styles, from creative to business, and are all highly customizable and easy to edit. Download as a PowerPoint template or use them as Google Slides themes.

Characteristics Of Big Data Venn Diagram Ppt PowerPoint Presentation Example 2015
This is a characteristics of big data venn diagram ppt powerpoint presentation example 2015. This is a three stage process. The stages in this process are volume, velocity, variety, tables, files, transactions, records, terabytes.

Business Diagram Four Colored Pie Charts For Result Analysis Data Driven PowerPoint Slide
This business diagram displays graphic of pie charts. This business slide is suitable to present and compare business data. Use this diagram to build professional presentations for your viewers.

1 Flow Of Data Through 7 Layers Of The Osi Reference Model Through Physical Link Ppt Slides
This image slide displays flow diagram through 7 layers. This image slide has been designed with diagram to depict flow of data. This image slide depicts data transmission. The layered concept of networking was developed to accommodate changes in technology. Each layer of a specific network model may be responsible for a different function of the network. Each layer will pass information up and down to the next subsequent layer as data is processed. You may change size, color and orientation of any icon to your liking. Use this PowerPoint template, in your presentations to explain transmission of data through different network layers. This image slide will enhance the quality of your presentations.

1 Data Replication From Primary To Replica Over Local Area Network Or Wide Are Network Ppt Slides
This image slide displays data replication. This image slide has been designed with graphic of cloud, two servers and clients over network. This image slide depicts process of data replication. Database replication can be used on many database management systems, usually with a master slave relationship between the original and the copies. The master logs the updates, which then pass through to the slaves. You may change size, color and orientation of any icon to your liking. Use this PowerPoint template, in your presentations to explain concept of data replication and cloud computing. This image slide will enhance the quality of your presentations.

Example Of Data Policy And Governance Framework Ppt Example Ppt Presentation
This is a example of data policy and governance framework ppt example ppt presentation. This is a six stage process. The stages in this process are it objectives and technology initiatives, business objectives and value, data governance, identify data, procure acquire data, transform data, measure and monitor data, store data, deliver data and manage change.

1 Data Center With Servers As A Cloud Connected To Devices Mobile Tables Desktop Ppt Slides
This Powerpoint image slide contains the graphic of cloud server with multiple device connections. This PPT slide explain the concept of data transfer and sharing. This data sharing and transfer is done in between cloud server and devices. We have used mobile, laptops and desktops to show the data sharing and transfer technology.

1 Data Replication From Primary To Secondary Storage Media Representing Hard Drives Ppt Slides
This Powerpoint image has been designed to display the concept of data replication. We have defined specific replication over networks. To display this data replication we have used graphic of two different databases. In this PPT slide we have displayed primary to secondary data replication in between databases. Use this PPT slide in your network technology and data replication related presentations.
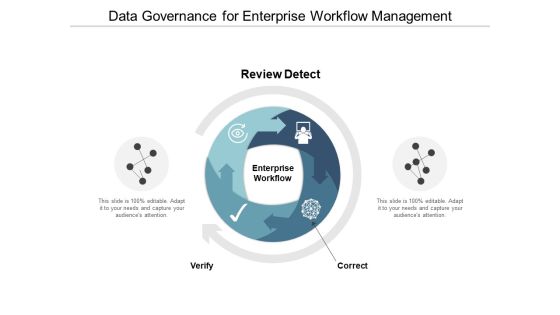
Data Governance For Enterprise Workflow Management Ppt PowerPoint Presentation Model Outline
This is a data governance for enterprise workflow management ppt powerpoint presentation model outline. This is a two stage process. The stages in this process are data analysis, data review, data evaluation.

Data Governance Steps Review Tools Setup Ppt PowerPoint Presentation Visual Aids Diagrams
This is a data governance steps review tools setup ppt powerpoint presentation visual aids diagrams. This is a five stage process. The stages in this process are data analysis, data review, data evaluation.

Data Governance For Business Process Management Ppt PowerPoint Presentation Visual Aids Files
This is a data governance for business process management ppt powerpoint presentation visual aids files. This is a five stage process. The stages in this process are data flow, data management, big data.

Data Governance Model With Change Management Ppt PowerPoint Presentation Gallery Styles PDF
Presenting data governance model with change management ppt powerpoint presentation gallery styles pdf to dispense important information. This template comprises four stages. It also presents valuable insights into the topics including policies and standards, compliance and security, information quality. This is a completely customizable PowerPoint theme that can be put to use immediately. So, download it and address the topic impactfully.

Data Analysis Reports Under Magnifying Glass Ppt Powerpoint Presentation Summary Slideshow
This is a data analysis reports under magnifying glass ppt powerpoint presentation summary slideshow. This is a three stage process. The stages in this process are data visualization icon, data management icon.

Data Management Building Blocks For Improved BI Ppt PowerPoint Presentation Gallery Design Templates PDF
Presenting this set of slides with name data management building blocks for improved bi ppt powerpoint presentation gallery design templates pdf. This is a four stage process. The stages in this process are policies, information quality, integration. This is a completely editable PowerPoint presentation and is available for immediate download. Download now and impress your audience.

5 Pillars For Data Storage And Management Ppt PowerPoint Presentation File Background Images PDF
Presenting this set of slides with name 5 pillars for data storage and management ppt powerpoint presentation file background images pdf. This is a five stage process. The stages in this process are connectability, value, quality. This is a completely editable PowerPoint presentation and is available for immediate download. Download now and impress your audience.

Benchmarking Supplier Operation Control Procedure Performance Rating Data Sheet Portrait PDF
Following slide displays performance rating data sheet. It includes vendor performance rating in various criterias set by the firm namely delivery, quality, price and reliability performance. Deliver an awe-inspiring pitch with this creative benchmarking supplier operation control procedure performance rating data sheet portrait pdf bundle. Topics like project, assignment, supplier can be discussed with this completely editable template. It is available for immediate download depending on the needs and requirements of the user.
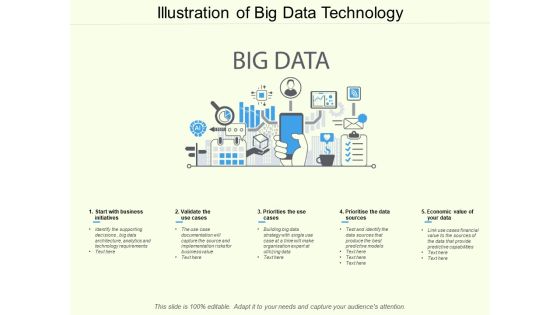
Illustration Of Big Data Technology Ppt PowerPoint Presentation Pictures Slide Download
Presenting this set of slides with name illustration of big data technology ppt powerpoint presentation pictures slide download. This is a five stage process. The stages in this process are big data strategy, data governance strategy, big data technology. This is a completely editable PowerPoint presentation and is available for immediate download. Download now and impress your audience.

Cloud Computing Data Center Web Hosting Ppt Powerpoint Presentation Outline Portrait
This is a cloud computing data center web hosting ppt powerpoint presentation outline portrait. This is a four stage process. The stages in this process are data management, data centre, storage system.

Data Center And Virtualization Vector Icon Ppt Powerpoint Presentation Outline Objects
This is a data center and virtualization vector icon ppt powerpoint presentation outline objects. This is a three stage process. The stages in this process are data management icon, big data icon.
IT Management Plan With Data Governance Icon Ppt Styles Design Templates PDF
Presenting it management plan with data governance icon ppt styles design templates pdf to dispense important information. This template comprises three stages. It also presents valuable insights into the topics including it management plan with data governance icon. This is a completely customizable PowerPoint theme that can be put to use immediately. So, download it and address the topic impactfully.
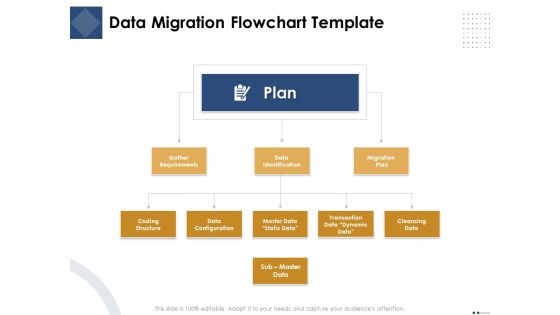
Introducing And Implementing Approaches Within The Business Data Migration Flowchart Template Graphics PDF
Presenting this set of slides with name introducing and implementing approaches within the business data migration flowchart template graphics pdf. This is a three stage process. The stages in this process are plan, gather requirements, data identification, migration, plan, coding structure, data configuration, master data static data, transaction data dynamic data, cleansing data, sub master data. This is a completely editable PowerPoint presentation and is available for immediate download. Download now and impress your audience.

Data Management And Information Delivery Timeline Ppt PowerPoint Presentation Inspiration Example File
This is a data management and information delivery timeline ppt powerpoint presentation inspiration example file. This is a six stage process. The stages in this process are data flow, data management, big data.
Data Science Server Network Vector Icon Ppt Powerpoint Presentation Model Infographics
This is a data science server network vector icon ppt powerpoint presentation model infographics. The topics discussed in this diagram are data management icon, big data icon. This is a completely editable PowerPoint presentation, and is available for immediate download.

Data Storage And Server Network Ppt Powerpoint Presentation Icon Design Inspiration
This is a data storage and server network ppt powerpoint presentation icon design inspiration. This is a four stage process. The stages in this process are data management, data centre, storage system.
Business Diagram Icons Of Big Data Content Surrounding A Public Of Private Cloud Ppt Slide
This diagram has been designed with graphic of big data icons. This technology slide contains the concept of data transfer. Display public and private data transfer with cloud technology. Download this diagram to make technical presentations.

Business Diagram Exponentially Growing Big Data With Icons Surrounding Cloud Ppt Slide
This slide contains the graphic of clouds and icons. This diagram has been designed with concept of big data growth. This diagram displays the exponential growth of data analysis. Use this diagram slide for your data technology related presentations.

Data Management Best Practices With Icons Ppt PowerPoint Presentation Pictures Guidelines
This is a data management best practices with icons ppt powerpoint presentation pictures guidelines. This is a five stage process. The stages in this process are data flow, data management, big data.

Data Management Steps With Icons Ppt PowerPoint Presentation Infographic Template Deck
This is a data management steps with icons ppt powerpoint presentation infographic template deck. This is a five stage process. The stages in this process are data flow, data management, big data.

Data Process Management With Icons Ppt PowerPoint Presentation Infographic Template Images
This is a data process management with icons ppt powerpoint presentation infographic template images. This is a four stage process. The stages in this process are data flow, data management, big data.

Data Strategy Management And Audit Corrective And Preventive Actions Ppt PowerPoint Presentation Pictures Designs Download
This is a data strategy management and audit corrective and preventive actions ppt powerpoint presentation pictures designs download. This is a nine stage process. The stages in this process are data flow, data management, big data.
Four Steps Data Process Management With Icons Ppt PowerPoint Presentation Slides Guide
This is a four steps data process management with icons ppt powerpoint presentation slides guide. This is a four stage process. The stages in this process are data flow, data management, big data.

Six Linear Steps For Data Management Ppt PowerPoint Presentation Infographic Template Layout Ideas
This is a six linear steps for data management ppt powerpoint presentation infographic template layout ideas. This is a six stage process. The stages in this process are data flow, data management, big data.

Data Processing System Input And Output Ppt PowerPoint Presentation Icon Information
This is a data processing system input and output ppt powerpoint presentation icon information. This is a four stage process. The stages in this process are data flow, data management, big data.

Data Analysis And Interpretation Reviewed And Resolved Ppt PowerPoint Presentation Pictures Graphics
This is a data analysis and interpretation reviewed and resolved ppt powerpoint presentation pictures graphics. This is a four stage process. The stages in this process are data analysis, data review, data evaluation.

Data Analysis Funnel Showing Critical Appraisal And Rapid Review Ppt PowerPoint Presentation Model Deck
This is a data analysis funnel showing critical appraisal and rapid review ppt powerpoint presentation model deck. This is a six stage process. The stages in this process are data analysis, data review, data evaluation.
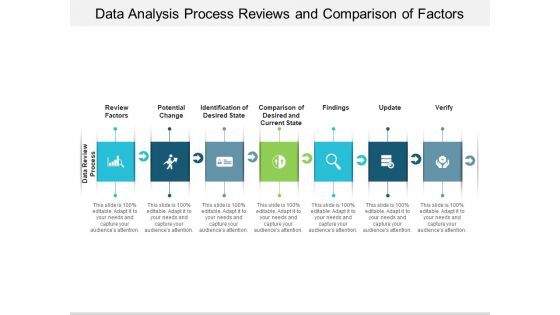
Data Analysis Process Reviews And Comparison Of Factors Ppt PowerPoint Presentation Infographic Template Graphics Template
This is a data analysis process reviews and comparison of factors ppt powerpoint presentation infographic template graphics template. This is a seven stage process. The stages in this process are data analysis, data review, data evaluation.
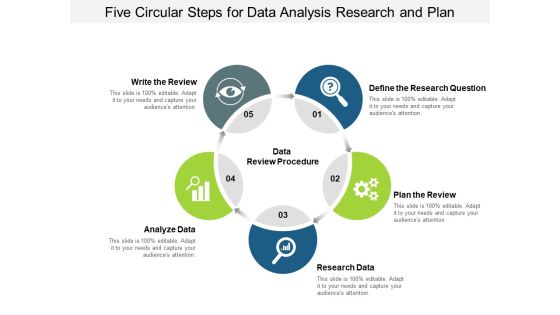
Five Circular Steps For Data Analysis Research And Plan Ppt PowerPoint Presentation Outline Show
This is a five circular steps for data analysis research and plan ppt powerpoint presentation outline show. This is a five stage process. The stages in this process are data analysis, data review, data evaluation.

 Home
Home
