Data Processing

Data Statistics Charts And Key Performance Indicators Ppt Powerpoint Presentation Layouts Guide
This is a data statistics charts and key performance indicators ppt powerpoint presentation layouts guide. This is a four stage process. The stages in this process are business metrics, business kpi, business dashboard.

Data Flow Diagram Algorithm Operations Standard And Service Requests Ppt Powerpoint Presentation Inspiration Ideas
This is a data flow diagram algorithm operations standard and service requests ppt powerpoint presentation inspiration ideas. This is a six stage process. The stages in this process are context diagram, context shapes, context visuals.

Bar Graph Icon For Data Analysis Ppt PowerPoint Presentation Pictures Ideas
This is a bar graph icon for data analysis ppt powerpoint presentation pictures ideas. This is a four stage process. The stages in this process are financial analysis, quantitative, statistical modelling.

Data Chart For Individual Income Analysis Ppt PowerPoint Presentation Layouts Visual Aids
This is a data chart for individual income analysis ppt powerpoint presentation layouts visual aids. This is a five stage process. The stages in this process are financial analysis, quantitative, statistical modelling.

Quantitative Bar Chart For Data Analysis Ppt PowerPoint Presentation Model Graphic Tips
This is a quantitative bar chart for data analysis ppt powerpoint presentation model graphic tips. This is a two stage process. The stages in this process are financial analysis, quantitative, statistical modelling.
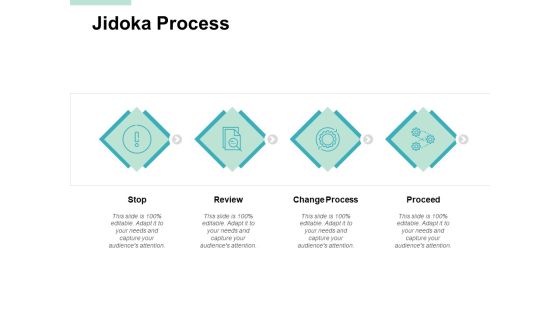
Jidoka Process Change Process Ppt PowerPoint Presentation Outline Portfolio
Presenting this set of slides with name jidoka process change process ppt powerpoint presentation outline portfolio. This is a four stage process. The stages in this process are change process, proceed, process, review, technology. This is a completely editable PowerPoint presentation and is available for immediate download. Download now and impress your audience.

Competitors Analysis Charts Graphs To Display Data Company Profiles Ppt PowerPoint Presentation Outline Visual Aids
This is a competitors analysis charts graphs to display data company profiles ppt powerpoint presentation outline visual aids. This is a five stage process. The stages in this process are finance, analysis, business, investment, marketing.

Data Chart For Distribution Of Vehicles By Origin And Type Ppt PowerPoint Presentation Infographics Topics
This is a data chart for distribution of vehicles by origin and type ppt powerpoint presentation infographics topics. This is a four stage process. The stages in this process are financial analysis, quantitative, statistical modelling.
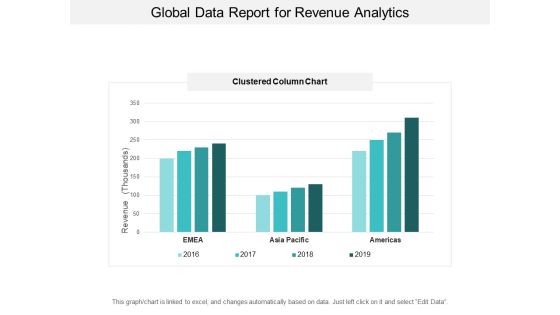
Global Data Report For Revenue Analytics Ppt PowerPoint Presentation Inspiration Visuals
This is a global data report for revenue analytics ppt powerpoint presentation inspiration visuals. This is a four stage process. The stages in this process are financial analysis, quantitative, statistical modelling.

Computer Screen With Pie Chart For Data Analysis Ppt PowerPoint Presentation Show Picture
This is a computer screen with pie chart for data analysis ppt powerpoint presentation show picture. This is a six stage process. The stages in this process are computer icon, desktop icon, laptop screen icon.

Big Data Insight For Time Spent Analysis Over Internet Diagram Slides
This is a big data insight for time spent analysis over internet diagram slides. This is a one stage process. The stages in this process are social networking, online shopping, multimedia sites, searches, reading content, emails communication.
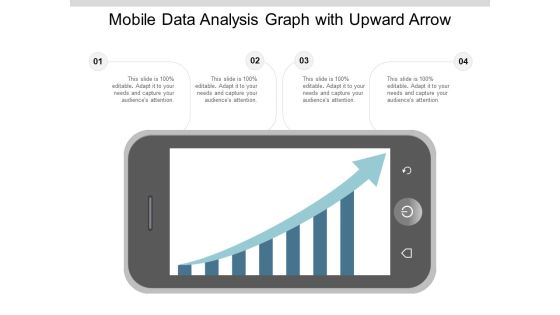
Mobile Data Analysis Graph With Upward Arrow Ppt PowerPoint Presentation Summary Styles
This is a mobile data analysis graph with upward arrow ppt powerpoint presentation summary styles. This is a four stage process. The stages in this process are mobile analytics, mobile tracking, mobile web analytics.

Example Of Data Driven Marketing For Improved Profitability Diagram Powerpoint Guide
This is a example of data driven marketing for improved profitability diagram powerpoint guide. This is a five stage process. The stages in this process are customer acquisition, customer relation, customer upsell cross sell, lead customer reactivation, customer advocacy.

Financial Waterfall Chart For Data Visualization Ppt PowerPoint Presentation Ideas Elements
This is a financial waterfall chart for data visualization ppt powerpoint presentation ideas elements. This is a five stage process. The stages in this process are sales waterfall, waterfall chart, business.

Business Analysis Data Charts And Reports Ppt Powerpoint Presentation Ideas Portrait
This is a business analysis data charts and reports ppt powerpoint presentation ideas portrait. This is a three stage process. The stages in this process are business metrics, business kpi, business dashboard.
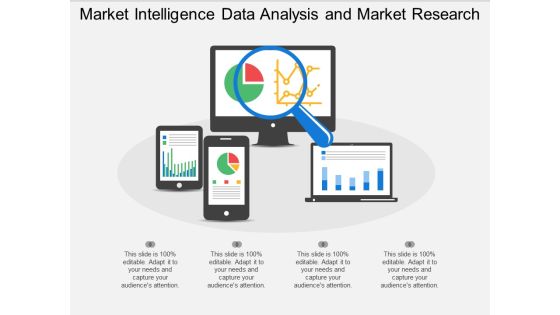
Market Intelligence Data Analysis And Market Research Ppt PowerPoint Presentation Professional Templates
This is a market intelligence data analysis and market research ppt powerpoint presentation professional templates. This is a four stage process. The stages in this process are digital analytics, digital dashboard, marketing.
Web Analytics Icons Computer Screen With Data Charts Ppt PowerPoint Presentation Ideas Outline
This is a web analytics icons computer screen with data charts ppt powerpoint presentation ideas outline. This is a four stage process. The stages in this process are digital analytics, digital dashboard, marketing.

Big Data Benefits Analytics In Healthcare Ppt PowerPoint Presentation Example 2015
This is a big data benefits analytics in healthcare ppt powerpoint presentation example 2015. This is a four stage process. The stages in this process are increased efficiency, better business decision making, improved customer experience and engagement, achieved financial savings.

Data Driven Customer Insights In Digital Marketing Diagram Example Of Ppt
This is data driven customer insights in digital marketing diagram example of ppt. This is a eight stage process. The stages in this process are digital marketing, situation analysis, market trend, review, objective setting, customer analysis, competitor, mission.

Segmentation Analysis Grouping Of Data Sets Ppt PowerPoint Presentation Ideas Backgrounds
This is a segmentation analysis grouping of data sets ppt powerpoint presentation ideas backgrounds. This is a two stage process. The stages in this process are cluster analysis, cluster examination, cluster investigation.
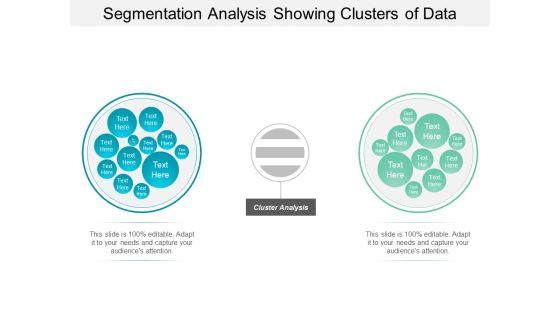
Segmentation Analysis Showing Clusters Of Data Ppt PowerPoint Presentation Ideas Designs Download
This is a segmentation analysis showing clusters of data ppt powerpoint presentation ideas designs download. This is a two stage process. The stages in this process are cluster analysis, cluster examination, cluster investigation.
Eight Sections Pie Chart For Percentage Data Analysis Ppt PowerPoint Presentation Styles Icons
This is a eight sections pie chart for percentage data analysis ppt powerpoint presentation styles icons. This is a eight stage process. The stages in this process are 6 piece pie chart, 6 segment pie chart, 6 parts pie chart.
Data Research And Analysis For Mobile Users Ppt PowerPoint Presentation Icon Inspiration
This is a data research and analysis for mobile users ppt powerpoint presentation icon inspiration. This is a four stage process. The stages in this process are mobile analytics, mobile tracking, mobile web analytics.
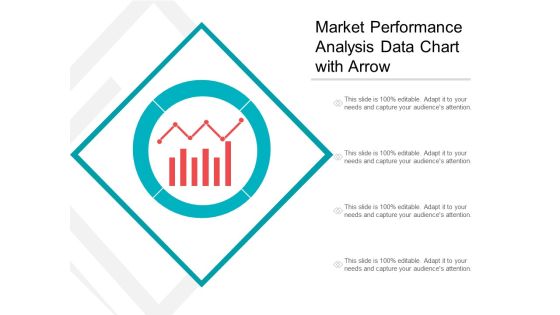
Market Performance Analysis Data Chart With Arrow Ppt PowerPoint Presentation Inspiration Graphics
This is a market performance analysis data chart with arrow ppt powerpoint presentation inspiration graphics. This is a four stage process. The stages in this process are marketing analytics, marketing performance, marketing discovery.
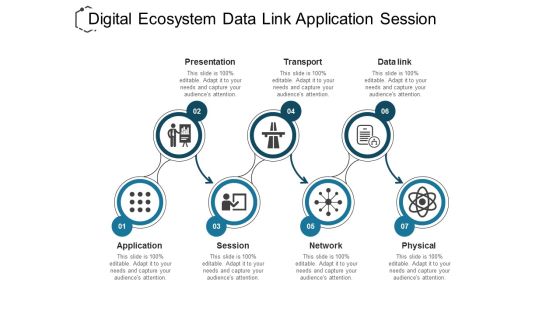
Digital Ecosystem Data Link Application Session Ppt PowerPoint Presentation Ideas Rules
This is a digital ecosystem data link application session ppt powerpoint presentation ideas rules. This is a stage process. The stages in this process are osi model, technology layers, internetworking layer.
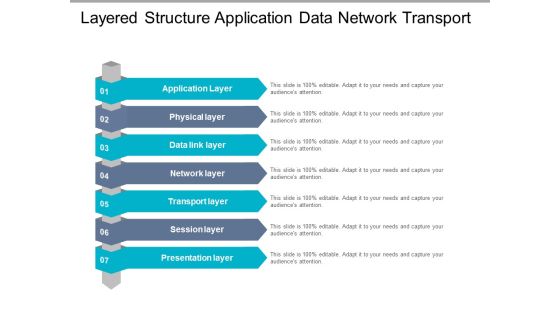
Layered Structure Application Data Network Transport Ppt PowerPoint Presentation Show Clipart Images
This is a layered structure application data network transport ppt powerpoint presentation show clipart images. This is a seven stage process. The stages in this process are osi model, technology layers, internetworking layer.
Mobile Storage Data Consolidation Vector Icon Ppt Powerpoint Presentation Visual Aids Diagrams
This is a mobile storage data consolidation vector icon ppt powerpoint presentation visual aids diagrams. This is a three stage process. The stages in this process are combination icon, incorporation icon, integration icon.

Computer Screen With Business Data Charts Ppt Powerpoint Presentation Show Vector
This is a computer screen with business data charts ppt powerpoint presentation show vector. This is a four stage process. The stages in this process are business metrics, business kpi, business dashboard.

Big Data Opportunities And Challenges Template Ppt PowerPoint Presentation Design Ideas
This is a big data opportunities and challenges template ppt powerpoint presentation design ideas. This is a three stage process. The stages in this process are business, marketing, success, finance, analysis.

Big Data Opportunities And Challenges Template 2 Ppt PowerPoint Presentation Summary
This is a big data opportunities and challenges template 2 ppt powerpoint presentation summary. This is a three stage process. The stages in this process are business, donut, marketing, finance, strategy, analysis, success.

Big Data Opportunities And Challenges Template 1 Ppt PowerPoint Presentation Infographic Template Summary
This is a big data opportunities and challenges template 1 ppt powerpoint presentation infographic template summary. This is a three stage process. The stages in this process are business, pie chart, finance, marketing, analysis, strategy.

Discounted Free Cash Flow Dcf Technique Data Set Ppt PowerPoint Presentation Gallery Display
This is a discounted free cash flow dcf technique data set ppt powerpoint presentation gallery display. This is a five stage process. The stages in this process are analysis, finance, donut, business, marketing.
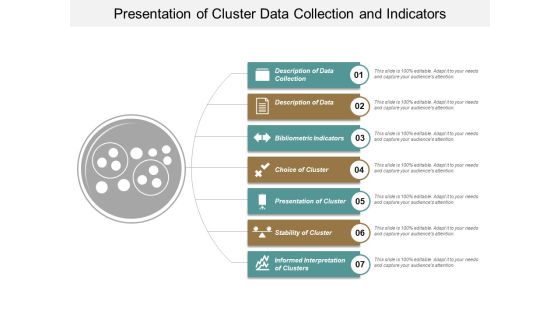
Presentation Of Cluster Data Collection And Indicators Ppt PowerPoint Presentation Model Structure
This is a presentation of cluster data collection and indicators ppt powerpoint presentation model structure. This is a seven stage process. The stages in this process are cluster analysis, cluster examination, cluster investigation.
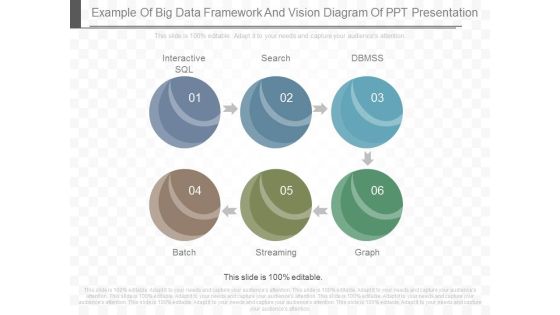
Example Of Big Data Framework And Vision Diagram Of Ppt Presentation
This is a example of big data framework and vision diagram of ppt presentation. This is a six stage process. The stages in this process are interactive sql, search, dbmss, batch, streaming, graph.
Four Ds Data Sets Shape Icons Diagrams Ppt PowerPoint Presentation Guidelines
This is a four ds data sets shape icons diagrams ppt powerpoint presentation guidelines. This is a four stage process. The stages in this process are deposit, discover, design, decide.

3 Vs Of Big Data Characteristics Ppt PowerPoint Presentation Example File
This is a 3 vs of big data characteristics ppt powerpoint presentation example file. This is a three stage process. The stages in this process are volume, velocity, variety.

Big Data Size Threshold For Social Media Ppt PowerPoint Presentation Example
This is a big data size threshold for social media ppt powerpoint presentation example. This is a eight stage process. The stages in this process are million, megabytes, hours, petabytes, items.

Big Data Opportunities And Challenges Template 1 Ppt PowerPoint Presentation Visual Aids
This is a big data opportunities and challenges template 1 ppt powerpoint presentation visual aids. This is a two stage process. The stages in this process are business, stairs, growth, opportunity, strategy, success.
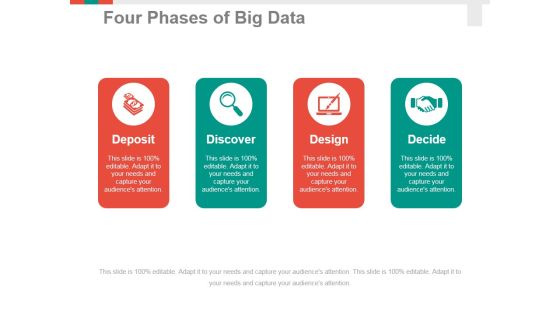
Four Phases Of Big Data Ppt PowerPoint Presentation Professional Format Ideas
This is a four phases of big data ppt powerpoint presentation professional format ideas. This is a four stage process. The stages in this process are deposit, discover, design, decide.

Discounted Free Cash Flow Technique Data Set Ppt PowerPoint Presentation File Summary
This is a discounted free cash flow technique data set ppt powerpoint presentation file summary. This is a five stage process. The stages in this process are beta, infinite growth rate, cost of equity, cost of debt.
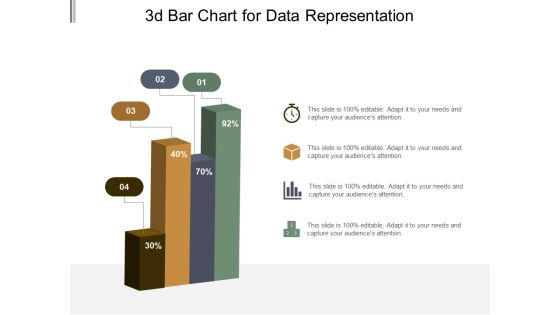
3D Bar Chart For Data Representation Ppt PowerPoint Presentation Model Graphic Tips
This is a 3d bar chart for data representation ppt powerpoint presentation model graphic tips. This is a four stage process. The stages in this process are art, colouring, paint brush.

3D Bar Chart To Display Data Ppt PowerPoint Presentation Icon Design Inspiration
This is a 3d bar chart to display data ppt powerpoint presentation icon design inspiration. This is a four stage process. The stages in this process are art, colouring, paint brush.
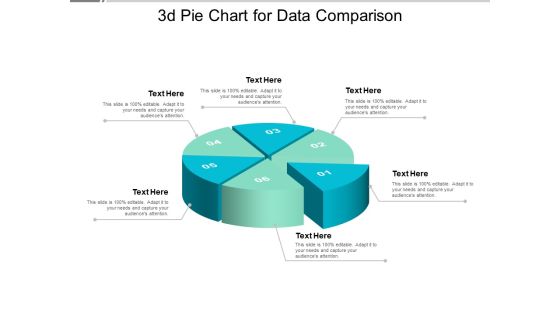
3D Pie Chart For Data Comparison Ppt PowerPoint Presentation Model Design Ideas
This is a 3d pie chart for data comparison ppt powerpoint presentation model design ideas. This is a six stage process. The stages in this process are art, colouring, paint brush.

6 Piece Pie Chart For Data Representation Ppt PowerPoint Presentation Professional Brochure
This is a 6 piece pie chart for data representation ppt powerpoint presentation professional brochure. This is a six stage process. The stages in this process are 6 piece pie chart, 6 segment pie chart, 6 parts pie chart.

6 Segments Pie Chart For Data Representation Ppt PowerPoint Presentation Icon Graphics
This is a 6 segments pie chart for data representation ppt powerpoint presentation icon graphics. This is a six stage process. The stages in this process are 6 piece pie chart, 6 segment pie chart, 6 parts pie chart.

7 Piece Pie Chart For Data Representation Ppt PowerPoint Presentation Portfolio Graphics
This is a 7 piece pie chart for data representation ppt powerpoint presentation portfolio graphics. This is a seven stage process. The stages in this process are 6 piece pie chart, 6 segment pie chart, 6 parts pie chart.

7 Segments Pie Chart For Data Representation Ppt PowerPoint Presentation Styles Summary
This is a 7 segments pie chart for data representation ppt powerpoint presentation styles summary. This is a seven stage process. The stages in this process are 6 piece pie chart, 6 segment pie chart, 6 parts pie chart.

8 Segments Pie Chart For Data Representation Ppt PowerPoint Presentation Infographics Design Templates
This is a 8 segments pie chart for data representation ppt powerpoint presentation infographics design templates. This is a eight stage process. The stages in this process are 6 piece pie chart, 6 segment pie chart, 6 parts pie chart.

Planning Cycle Data Collection Implementation And Evaluation Ppt PowerPoint Presentation File Pictures
This is a planning cycle data collection implementation and evaluation ppt powerpoint presentation file pictures. This is a four stage process. The stages in this process are environmental scan, environmental study, environmental examine.

Big Data Framework With Functional Areas Ppt Powerpoint Presentation Infographic Template Infographics
This is a big data framework with functional areas ppt powerpoint presentation infographic template infographics. This is a three stage process. The stages in this process are functional architecture, functional planning, functional designing.

Big Data Platform Scheduling Provisioning Execution Ppt Powerpoint Presentation Professional File Formats
This is a big data platform scheduling provisioning execution ppt powerpoint presentation professional file formats. This is a four stage process. The stages in this process are functional architecture, functional planning, functional designing.

Data Strategy Framework Trends And Vision Ppt PowerPoint Presentation Portfolio Graphics Design
This is a data strategy framework trends and vision ppt powerpoint presentation portfolio graphics design. This is a three stage process. The stages in this process are delta model, delta framework, customer based approach.
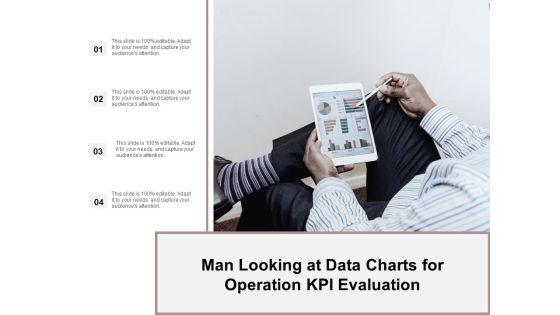
Man Looking At Data Charts For Operation Kpi Evaluation Ppt Powerpoint Presentation Ideas Demonstration
This is a man looking at data charts for operation kpi evaluation ppt powerpoint presentation ideas demonstration. This is a four stage process. The stages in this process are business metrics, business kpi, business dashboard.

Data Cube Operations Retailer Product Outdoor Shops Ppt PowerPoint Presentation Ideas Skills
This is a data cube operations retailer product outdoor shops ppt powerpoint presentation ideas skills. This is a two stage process. The stages in this process are hierarchy, drill down, top downwards.

Visual Data Presentation With Bar Chart Ppt PowerPoint Presentation Portfolio Brochure
This is a visual data presentation with bar chart ppt powerpoint presentation portfolio brochure. This is a four stage process. The stages in this process are visual aids, communication, business.

Automatically Controlling Process Objectives For Business Process Automation Summary PDF
Presenting this set of slides with name automatically controlling process objectives for business process automation summary pdf. This is a six stage process. The stages in this process are processes, technology, perform, cost, efficient. This is a completely editable PowerPoint presentation and is available for immediate download. Download now and impress your audience.
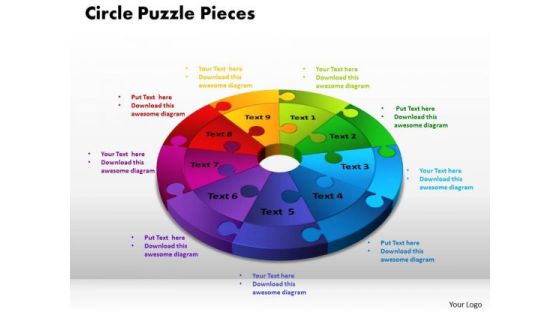
PowerPoint Process Circle Puzzle Pieces Business Ppt Theme
PowerPoint Process Circle Puzzle Pieces Business PPT Theme-This diagram is a graphical illustration of the relationships between and among sets of data, groups of objects.-PowerPoint Process Circle Puzzle Pieces Business PPT Theme
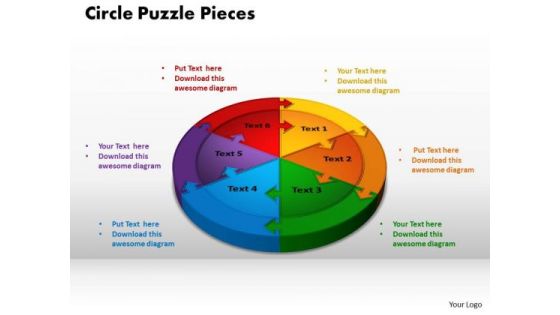
PowerPoint Process Circle Puzzle Pieces Success Ppt Presentation
PowerPoint Process Circle Puzzle Pieces Success PPT Presentation-This diagram is a graphical illustration of the relationships between and among sets of data, groups of objects.-PowerPoint Process Circle Puzzle Pieces Success PPT Presentation

PowerPoint Process Circle Puzzle Pieces Success Ppt Template
PowerPoint Process Circle Puzzle Pieces Success PPT Template-This diagram is a graphical illustration of the relationships between and among sets of data, groups of objects.-PowerPoint Process Circle Puzzle Pieces Success PPT Template

Deploying Content Distribution Network System Data Security Handled By CDN Sample PDF
This slide demonstrates how CDN protects data by issuing TLS or SSL certificates, blocking Bots and crawlers, and defending against DDoS assaults. If your project calls for a presentation, then Slidegeeks is your go-to partner because we have professionally designed, easy-to-edit templates that are perfect for any presentation. After downloading, you can easily edit Deploying Content Distribution Network System Data Security Handled By CDN Sample PDF and make the changes accordingly. You can rearrange slides or fill them with different images. Check out all the handy templates

 Home
Home