Data Platform

Data Analysis Chart For Funds Management Ppt PowerPoint Presentation Infographic Template Files
This is a data analysis chart for funds management ppt powerpoint presentation infographic template files. This is a five stage process. The stages in this process are financial analysis, quantitative, statistical modelling.

Data Chart For Individual Income Analysis Ppt PowerPoint Presentation Layouts Visual Aids
This is a data chart for individual income analysis ppt powerpoint presentation layouts visual aids. This is a five stage process. The stages in this process are financial analysis, quantitative, statistical modelling.

Quantitative Bar Chart For Data Analysis Ppt PowerPoint Presentation Model Graphic Tips
This is a quantitative bar chart for data analysis ppt powerpoint presentation model graphic tips. This is a two stage process. The stages in this process are financial analysis, quantitative, statistical modelling.
Statistical Analysis Data Mining Skills Ppt PowerPoint Presentation Slides Grid Cpb
Presenting this set of slides with name statistical analysis data mining skills ppt powerpoint presentation slides grid cpb. This is an editable Powerpoint four stages graphic that deals with topics like statistical analysis data mining skills to help convey your message better graphically. This product is a premium product available for immediate download and is 100 percent editable in Powerpoint. Download this now and use it in your presentations to impress your audience.
Statistical Analysis Big Data Ppt PowerPoint Presentation Summary Master Slide Cpb
Presenting this set of slides with name statistical analysis big data ppt powerpoint presentation summary master slide cpb. This is an editable Powerpoint seven stages graphic that deals with topics like statistical analysis big data to help convey your message better graphically. This product is a premium product available for immediate download and is 100 percent editable in Powerpoint. Download this now and use it in your presentations to impress your audience.

Manager Analyzing Statistical Data On Tablet Ppt PowerPoint Presentation Inspiration Graphics Download PDF
Persuade your audience using this manager analyzing statistical data on tablet ppt powerpoint presentation inspiration graphics download pdf. This PPT design covers three stages, thus making it a great tool to use. It also caters to a variety of topics including manager analyzing statistical data on tablet. Download this PPT design now to present a convincing pitch that not only emphasizes the topic but also showcases your presentation skills.
Icon Showing Transformation Shift Of Digital Data With Statistics Ppt PowerPoint Presentation Diagram PDF
Persuade your audience using this Icon Showing Transformation Shift Of Digital Data With Statistics Ppt PowerPoint Presentation Diagram PDF. This PPT design covers three stages, thus making it a great tool to use. It also caters to a variety of topics including Icon Showing Transformation Shift, Digital Data With Statistics. Download this PPT design now to present a convincing pitch that not only emphasizes the topic but also showcases your presentation skills.

Information Transformation Process Toolkit Work Streams Organizational Structure For Data Analytics Guidelines PDF
This slide shows the organization structure model including the analytics leadership, analytical tool for to obtain the business results. This is a Information Transformation Process Toolkit Work Streams Organizational Structure For Data Analytics Guidelines PDF template with various stages. Focus and dispense information on one stages using this creative set, that comes with editable features. It contains large content boxes to add your information on topics like Business Owner, Business Sponsor, Data Science. You can also showcase facts, figures, and other relevant content using this PPT layout. Grab it now.

Qualitative Analysis Of Interview Data Focus Groups And Content Analysis Ppt PowerPoint Presentation Ideas Guidelines
This is a qualitative analysis of interview data focus groups and content analysis ppt powerpoint presentation ideas guidelines. This is a five stage process. The stages in this process are analysis, observation, qualitative.
Manger Presenting Business Data Statistics Report Ppt PowerPoint Presentation File Images PDF
Persuade your audience using this manger presenting business data statistics report ppt powerpoint presentation file images pdf. This PPT design covers three stages, thus making it a great tool to use. It also caters to a variety of topics including manger presenting business data statistics report. Download this PPT design now to present a convincing pitch that not only emphasizes the topic but also showcases your presentation skills.

Data Chart For Distribution Of Vehicles By Origin And Type Ppt PowerPoint Presentation Infographics Topics
This is a data chart for distribution of vehicles by origin and type ppt powerpoint presentation infographics topics. This is a four stage process. The stages in this process are financial analysis, quantitative, statistical modelling.
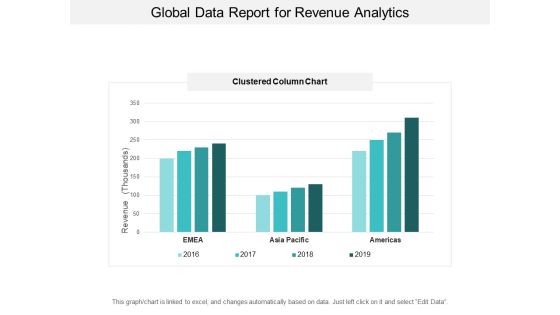
Global Data Report For Revenue Analytics Ppt PowerPoint Presentation Inspiration Visuals
This is a global data report for revenue analytics ppt powerpoint presentation inspiration visuals. This is a four stage process. The stages in this process are financial analysis, quantitative, statistical modelling.

IT Policies And Procedures Data Classification Policy Overview And Approaches Mockup PDF
This slide represents the data classification policy overview and approaches. Approaches include highly restricted, restricted, and internal use and types of data each approach will include. Whether you have daily or monthly meetings, a brilliant presentation is necessary. IT Policies And Procedures Data Classification Policy Overview And Approaches Mockup PDF can be your best option for delivering a presentation. Represent everything in detail using IT Policies And Procedures Data Classification Policy Overview And Approaches Mockup PDF and make yourself stand out in meetings. The template is versatile and follows a structure that will cater to your requirements. All the templates prepared by Slidegeeks are easy to download and edit. Our research experts have taken care of the corporate themes as well. So, give it a try and see the results.
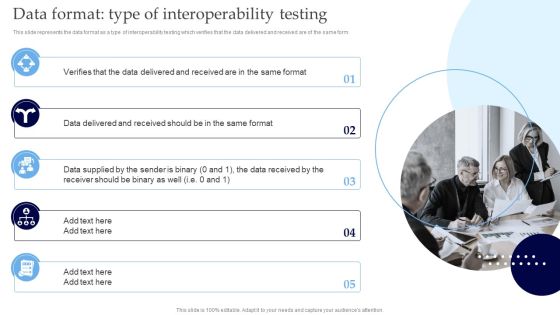
Interoperability Software Testing Data Format Type Of Interoperability Testing Slides PDF
This slide represents the data format as a type of interoperability testing which verifies that the data delivered and received are of the same form. Whether you have daily or monthly meetings, a brilliant presentation is necessary. Interoperability Software Testing Data Format Type Of Interoperability Testing Slides PDF can be your best option for delivering a presentation. Represent everything in detail using Interoperability Software Testing Data Format Type Of Interoperability Testing Slides PDF and make yourself stand out in meetings. The template is versatile and follows a structure that will cater to your requirements. All the templates prepared by Slidegeeks are easy to download and edit. Our research experts have taken care of the corporate themes as well. So, give it a try and see the results.

Data Center Relocation Process Step 4 Selecting The Destination For Relocation Topics PDF
This slide shows the fourth step that is involved in data center relocation process which is to be implemented for minimizing data center costs and improving scalability i.e. selecting the destination for relocation. Whether you have daily or monthly meetings, a brilliant presentation is necessary. Data Center Relocation Process Step 4 Selecting The Destination For Relocation Topics PDF can be your best option for delivering a presentation. Represent everything in detail using Data Center Relocation Process Step 4 Selecting The Destination For Relocation Topics PDF and make yourself stand out in meetings. The template is versatile and follows a structure that will cater to your requirements. All the templates prepared by Slidegeeks are easy to download and edit. Our research experts have taken care of the corporate themes as well. So, give it a try and see the results.

Techniques To Decrease Customer Different Ways To Collect Customer Data Professional PDF
This slide shows the different ways to collect customer data which covers web tracking, transactional data, surveys and marketing analytics to understand customer behavior, activities, etc. Whether you have daily or monthly meetings, a brilliant presentation is necessary. Techniques To Decrease Customer Different Ways To Collect Customer Data Professional PDF can be your best option for delivering a presentation. Represent everything in detail using Techniques To Decrease Customer Different Ways To Collect Customer Data Professional PDF and make yourself stand out in meetings. The template is versatile and follows a structure that will cater to your requirements. All the templates prepared by Slidegeeks are easy to download and edit. Our research experts have taken care of the corporate themes as well. So, give it a try and see the results.

Assessment And Workflow Data Center Relocation Process Step 6 Development Phase Structure PDF
This slide shows the sixth step that is involved in data center relocation process which is to be implemented for minimizing data center costs and improving scalability i.e. development phase. Whether you have daily or monthly meetings, a brilliant presentation is necessary. Assessment And Workflow Data Center Relocation Process Step 6 Development Phase Structure PDF can be your best option for delivering a presentation. Represent everything in detail using Assessment And Workflow Data Center Relocation Process Step 6 Development Phase Structure PDF and make yourself stand out in meetings. The template is versatile and follows a structure that will cater to your requirements. All the templates prepared by Slidegeeks are easy to download and edit. Our research experts have taken care of the corporate themes as well. So, give it a try and see the results.

Optimizing Digital Marketing Strategy Generate First Party Data Using Other Sources Background PDF
This template covers techniques and benefits of generating first-party data using app users and offline touchpoints. It also includes steps for data generation, such as adding a software development kit, using Google Analytics, invest in CRM and measurement tools. Whether you have daily or monthly meetings, a brilliant presentation is necessary. Optimizing Digital Marketing Strategy Generate First Party Data Using Other Sources Background PDF can be your best option for delivering a presentation. Represent everything in detail using Optimizing Digital Marketing Strategy Generate First Party Data Using Other Sources Background PDF and make yourself stand out in meetings. The template is versatile and follows a structure that will cater to your requirements. All the templates prepared by Slidegeeks are easy to download and edit. Our research experts have taken care of the corporate themes as well. So, give it a try and see the results.

Key Factors Driving Data Center Relocation Ppt PowerPoint Presentation File Ideas PDF
This slide shows the major factorsdrivers due to which the company is looking for data center relocation. The drivers for data center relocation are increasing performance capabilities, taking advantage of geographical proximity, reduction in capital expenses and improved energy efficiency. Whether you have daily or monthly meetings, a brilliant presentation is necessary. Key Factors Driving Data Center Relocation Ppt PowerPoint Presentation File Ideas PDF can be your best option for delivering a presentation. Represent everything in detail using Key Factors Driving Data Center Relocation Ppt PowerPoint Presentation File Ideas PDF and make yourself stand out in meetings. The template is versatile and follows a structure that will cater to your requirements. All the templates prepared by Slidegeeks are easy to download and edit. Our research experts have taken care of the corporate themes as well. So, give it a try and see the results.
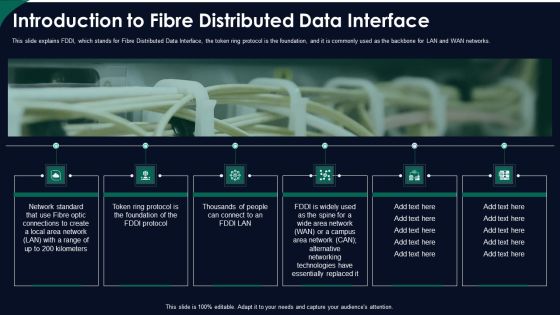
FDDI Network Standard IT Introduction To Fibre Distributed Data Interface Ppt Infographic Template Tips PDF
This slide explains FDDI, which stands for Fibre Distributed Data Interface, the token ring protocol is the foundation, and it is commonly used as the backbone for LAN and WAN networks. Deliver an awe inspiring pitch with this creative fddi network standard it introduction to fibre distributed data interface ppt infographic template tips pdf bundle. Topics like connections, protocol, network can be discussed with this completely editable template. It is available for immediate download depending on the needs and requirements of the user.
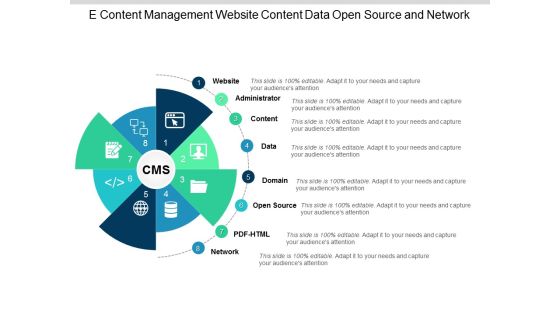
E Content Management Website Content Data Open Source And Network Ppt Powerpoint Presentation Portfolio Deck
This is a e content management website content data open source and network ppt powerpoint presentation portfolio deck. This is a eight stage process. The stages in this process are cms, content management system.
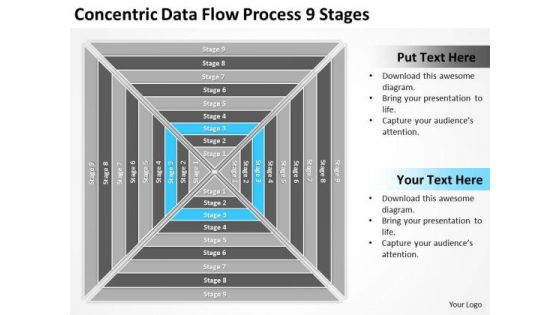
Concentric Data Flow Process 9 Stages Ppt Business Plan PowerPoint Slides
We present our concentric data flow process 9 stages ppt business plan PowerPoint Slides.Download our Flow Charts PowerPoint Templates because our PowerPoint Templates and Slides are the string of your bow. Fire of your ideas and conquer the podium. Use our Process and Flows PowerPoint Templates because You should Kick up a storm with our PowerPoint Templates and Slides. The heads of your listeners will swirl with your ideas. Download our Marketing PowerPoint Templates because You are working at that stage with an air of royalty. Let our PowerPoint Templates and Slides be the jewels in your crown. Download our Business PowerPoint Templates because You should Bet on your luck with our PowerPoint Templates and Slides. Be assured that you will hit the jackpot. Present our Shapes PowerPoint Templates because You have the co-ordinates for your destination of success. Let our PowerPoint Templates and Slides map out your journey.Use these PowerPoint slides for presentations relating to Flow, network, platform, diagram, connection, connect, business, flowchart, function, organization, coordinates, molecular, square, plan, interrelations, scheme, graphic, technology, graph, molecule, arrangement, comparison, scientific, variable, project, relationships, lines,attached, segments, interconnected, solution, organize, device, analyze, draft, pattern, construction, structure, nine, steps. The prominent colors used in the PowerPoint template are Blue light, White, Gray.

Computer Screen With Pie Chart For Data Analysis Ppt PowerPoint Presentation Show Picture
This is a computer screen with pie chart for data analysis ppt powerpoint presentation show picture. This is a six stage process. The stages in this process are computer icon, desktop icon, laptop screen icon.

Table Of Contents Information Analytics And Ml Strategy Playbook Data Graphics PDF
This is a Table Of Contents Information Analytics And Ml Strategy Playbook Data Graphics PDF template with various stages. Focus and dispense information on one stages using this creative set, that comes with editable features. It contains large content boxes to add your information on topics like Automated Data Analysis, Strategy Playbook, Information. You can also showcase facts, figures, and other relevant content using this PPT layout. Grab it now.

Building Clean Data With Profit Margins And Sales Prices Designs PDF
The following slide illustrates the steps to organize and maintain clean data for improved customer relationship management. It also includes activities such as determining, cleaning and restricting duplicate data etc. Create an editable Building Clean Data With Profit Margins And Sales Prices Designs PDF that communicates your idea and engages your audience. Whether you are presenting a business or an educational presentation, pre designed presentation templates help save time. Building Clean Data With Profit Margins And Sales Prices Designs PDF is highly customizable and very easy to edit, covering many different styles from creative to business presentations. Slidegeeks has creative team members who have crafted amazing templates. So, go and get them without any delay.

Building Clean Data With Profit Margins And Sales Prices Template PDF
The following slide illustrates the steps to organize and maintain clean data for improved customer relationship management. It also includes activities such as determining, cleaning and restricting duplicate data etc. Create an editable Building Clean Data With Profit Margins And Sales Prices Template PDF that communicates your idea and engages your audience. Whether you are presenting a business or an educational presentation, pre designed presentation templates help save time. Building Clean Data With Profit Margins And Sales Prices Template PDF is highly customizable and very easy to edit, covering many different styles from creative to business presentations. Slidegeeks has creative team members who have crafted amazing templates. So, go and get them without any delay.

Business Data Statistical Dashboard Vector Icon Ppt PowerPoint Presentation Icon Graphics Template PDF
Persuade your audience using this business data statistical dashboard vector icon ppt powerpoint presentation icon graphics template pdf. This PPT design covers three stages, thus making it a great tool to use. It also caters to a variety of topics including business data statistical dashboard vector icon. Download this PPT design now to present a convincing pitch that not only emphasizes the topic but also showcases your presentation skills.
Statistical Data Icon Of Poll Graph Depicting Elections Result Introduction PDF
Persuade your audience using this statistical data icon of poll graph depicting elections result introduction pdf. This PPT design covers four stages, thus making it a great tool to use. It also caters to a variety of topics including statistical data icon of poll graph depicting elections result. Download this PPT design now to present a convincing pitch that not only emphasizes the topic but also showcases your presentation skills.

Big Data Insight For Time Spent Analysis Over Internet Diagram Slides
This is a big data insight for time spent analysis over internet diagram slides. This is a one stage process. The stages in this process are social networking, online shopping, multimedia sites, searches, reading content, emails communication.
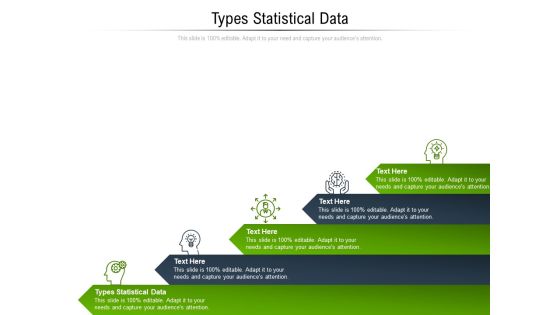
Types Statistical Data Ppt PowerPoint Presentation Outline Designs Download Cpb Pdf
Presenting this set of slides with name types statistical data ppt powerpoint presentation outline designs download cpb pdf. This is an editable Powerpoint five stages graphic that deals with topics like data leakage detection to help convey your message better graphically. This product is a premium product available for immediate download and is 100 percent editable in Powerpoint. Download this now and use it in your presentations to impress your audience.

Web Based Content Management System Data Administration Ppt Powerpoint Presentation Model Graphics Pictures
This is a web based content management system data administration ppt powerpoint presentation model graphics pictures. This is a eight stage process. The stages in this process are cms, content management system.
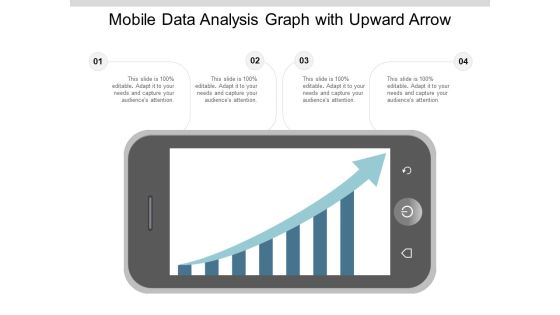
Mobile Data Analysis Graph With Upward Arrow Ppt PowerPoint Presentation Summary Styles
This is a mobile data analysis graph with upward arrow ppt powerpoint presentation summary styles. This is a four stage process. The stages in this process are mobile analytics, mobile tracking, mobile web analytics.

Stages Triangular Shaped Donut Diagram Data Comparison It Business Plan PowerPoint Templates
We present our stages triangular shaped donut diagram data comparison it business plan PowerPoint templates.Present our Business PowerPoint Templates because Our PowerPoint Templates and Slides will let you meet your Deadlines. Use our Construction PowerPoint Templates because Our PowerPoint Templates and Slides will let you Clearly mark the path for others to follow. Download and present our Triangles PowerPoint Templates because Our PowerPoint Templates and Slides have the Brilliant backdrops. Guaranteed to illuminate the minds of your audience. Present our Pyramids PowerPoint Templates because Our PowerPoint Templates and Slides will provide you a launch platform. Give a lift off to your ideas and send them into orbit. Use our Shapes PowerPoint Templates because Our PowerPoint Templates and Slides will definately Enhance the stature of your presentation. Adorn the beauty of your thoughts with their colourful backgrounds.Use these PowerPoint slides for presentations relating to 3d, chart, shape, part, icon, design, diagram, layout, vector, cone, triangular, isolated, tower, model, conical, triangle, sign, column, architectural, glossy, symbol, scheme, graphic, drawing, illustration, geometric, figure, three, colour, shiny, illustrated, dimensional, clipart, architecture, color, clip, picture, art, 3, background, image. The prominent colors used in the PowerPoint template are Blue , Green, Yellow.

Business Analysis Data Charts And Reports Ppt Powerpoint Presentation Ideas Portrait
This is a business analysis data charts and reports ppt powerpoint presentation ideas portrait. This is a three stage process. The stages in this process are business metrics, business kpi, business dashboard.
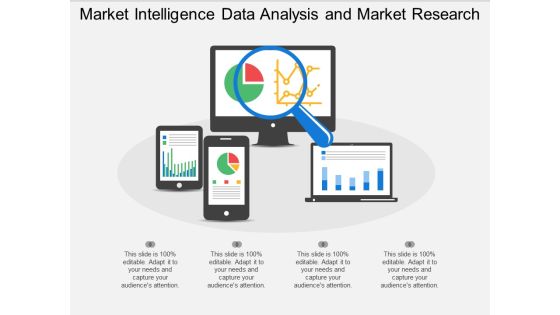
Market Intelligence Data Analysis And Market Research Ppt PowerPoint Presentation Professional Templates
This is a market intelligence data analysis and market research ppt powerpoint presentation professional templates. This is a four stage process. The stages in this process are digital analytics, digital dashboard, marketing.

Data Analysis For Customer Relationship Management Consulting Ppt PowerPoint Presentation Ideas Templates
This is a data analysis for customer relationship management consulting ppt powerpoint presentation ideas templates. This is a one stage process. The stages in this process are employee performance review, job evaluation, customer 360.

Donut Chart For Data Comparisons 3 Stages Ppt Business Plan PowerPoint Templates
We present our donut chart for data comparisons 3 stages ppt business plan PowerPoint templates.Use our Process and Flows PowerPoint Templates because Our PowerPoint Templates and Slides provide you with a vast range of viable options. Select the appropriate ones and just fill in your text. Download our Circle Charts PowerPoint Templates because Our PowerPoint Templates and Slides will let you Hit the right notes. Watch your audience start singing to your tune. Download our Business PowerPoint Templates because It can Bubble and burst with your ideas. Use our Marketing PowerPoint Templates because Our PowerPoint Templates and Slides will provide you a launch platform. Give a lift off to your ideas and send them into orbit. Use our Shapes PowerPoint Templates because Our PowerPoint Templates and Slides will weave a web of your great ideas. They are gauranteed to attract even the most critical of your colleagues.Use these PowerPoint slides for presentations relating to Diagram, wheel, graphic, graph, chart, vector, round, fuel, wiper, change, circle, brakes, vehicle, illustration, circular, system, surfaces, tune-up, clipart, care, reflection, upkeep, clip, text, maintenance, blades , art, filter, routine. The prominent colors used in the PowerPoint template are Blue light, Gray, Black.

Concentric Data Flow Process 9 Stages Business Plans For PowerPoint Templates
We present our concentric data flow process 9 stages business plans for PowerPoint templates.Download and present our Flow Charts PowerPoint Templates because They will Put the wind in your sails. Skim smoothly over the choppy waters of the market. Use our Business PowerPoint Templates because You can Hit the nail on the head with our PowerPoint Templates and Slides. Embed your ideas in the minds of your audience. Download our Marketing PowerPoint Templates because Our PowerPoint Templates and Slides help you meet the demand of the Market. Just browse and pick the slides that appeal to your intuitive senses. Download our Process and Flow PowerPoint Templates because Our PowerPoint Templates and Slides will let Your superior ideas hit the target always and everytime. Present our Shapes PowerPoint Templates because Our PowerPoint Templates and Slides will let you Illuminate the road ahead to Pinpoint the important landmarks along the way.Use these PowerPoint slides for presentations relating to Flow, network, platform, diagram, connection, connect, business, flowchart, function, organization, coordinates, molecular, square, plan, interrelations, scheme, graphic, technology, graph, molecule, arrangement, comparison, scientific, variable, project, relationships, lines,attached, segments, interconnected, solution, organize, device, analyze, draft, pattern, construction, structure, nine, steps. The prominent colors used in the PowerPoint template are Gray, Blue, White.

Concentric Data Flow Process 9 Stages Ppt Business Plan PowerPoint Templates
We present our concentric data flow process 9 stages ppt business plan PowerPoint templates.Download our Business PowerPoint Templates because It will get your audience in sync. Present our Flow Charts PowerPoint Templates because Watching this your Audience will Grab their eyeballs, they wont even blink. Use our Process and Flows PowerPoint Templates because Our PowerPoint Templates and Slides will fulfill your every need. Use them and effectively satisfy the desires of your audience. Download and present our Marketing PowerPoint Templates because Our PowerPoint Templates and Slides will let you meet your Deadlines. Use our Shapes PowerPoint Templates because Our PowerPoint Templates and Slides will bullet point your ideas. See them fall into place one by one.Use these PowerPoint slides for presentations relating to Flow, network, platform, diagram, connection, connect, business, flowchart, function, organization, coordinates, molecular, square, plan, interrelations, scheme, graphic, technology, graph, molecule, arrangement, comparison, scientific, variable, project, relationships, lines,attached, segments, interconnected, solution, organize, device, analyze, draft, pattern, construction, structure, nine, steps. The prominent colors used in the PowerPoint template are White, Gray, Blue.
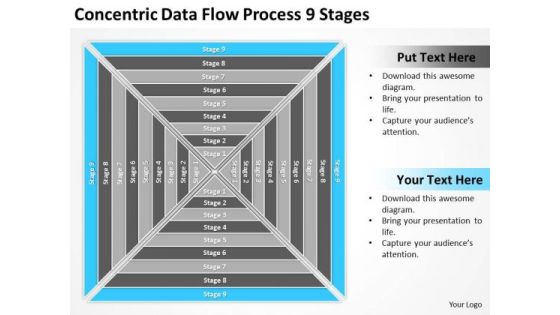
Concentric Data Flow Process 9 Stages Ppt Easy Business Plan Template PowerPoint Slides
We present our concentric data flow process 9 stages ppt easy business plan template PowerPoint Slides.Use our Process and Flows PowerPoint Templates because Our PowerPoint Templates and Slides will effectively help you save your valuable time. They are readymade to fit into any presentation structure. Download our Flow Charts PowerPoint Templates because You can Zap them with our PowerPoint Templates and Slides. See them reel under the impact. Download and present our Business PowerPoint Templates because You aspire to touch the sky with glory. Let our PowerPoint Templates and Slides provide the fuel for your ascent. Present our Shapes PowerPoint Templates because Our PowerPoint Templates and Slides are topically designed to provide an attractive backdrop to any subject. Download and present our Success PowerPoint Templates because Our PowerPoint Templates and Slides offer you the widest possible range of options.Use these PowerPoint slides for presentations relating to Flow, network, platform, diagram, connection, connect, business, flowchart, function, organization, coordinates, molecular, square, plan, interrelations, scheme, graphic, technology, graph, molecule, arrangement, comparison, scientific, variable, project, relationships, lines,attached, segments, interconnected, solution, organize, device, analyze, draft, pattern, construction, structure, nine, steps. The prominent colors used in the PowerPoint template are Blue light, White, Gray.

Stages Of Pie Chart Data Interpretation How To Write Business Plan PowerPoint Templates
We present our stages of pie chart data interpretation how to write business plan PowerPoint templates.Present our Circle Charts PowerPoint Templates because Our PowerPoint Templates and Slides will provide you a launch platform. Give a lift off to your ideas and send them into orbit. Present our Marketing PowerPoint Templates because Our PowerPoint Templates and Slides will let you Hit the right notes. Watch your audience start singing to your tune. Use our Business PowerPoint Templates because Our PowerPoint Templates and Slides come in all colours, shades and hues. They help highlight every nuance of your views. Download our Shapes PowerPoint Templates because It can Leverage your style with our PowerPoint Templates and Slides. Charm your audience with your ability. Use our Process and Flows PowerPoint Templates because You can Connect the dots. Fan expectations as the whole picture emerges.Use these PowerPoint slides for presentations relating to achievement, analysis, background, bank, banking, business, calculation, chart, circle, commerce, commercial, commission, concept, credit, crisis, debt, deposit, design, detail, diagram, earnings, economics, economy, element, finance, goal, gold, golden, graph, graphic, growth, icon, idea, illustration, income, increase, invest, isolated, level, loss, market, marketing, metal, modern, money, new, object, part, percent, percentage, pie, plot, politics, profit, progress, ratio, reflection, reflective. The prominent colors used in the PowerPoint template are Blue, Gray, Black.
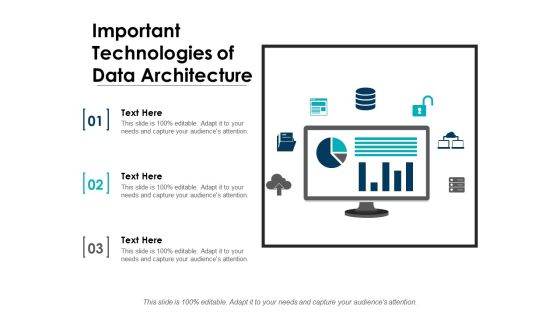
Important Technologies Of Data Architecture Finance Ppt PowerPoint Presentation Styles Introduction
This is a important technologies of data architecture finance ppt powerpoint presentation styles introduction. This is a three stage process. The stages in this process are marketing, management, strategy, business, technology.
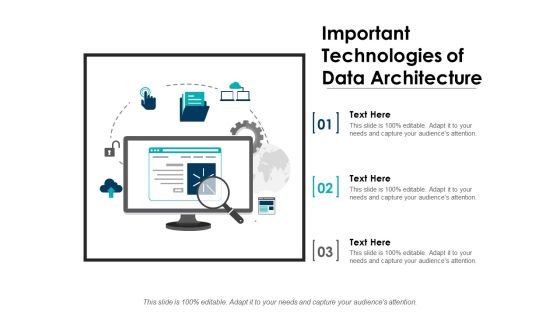
Important Technologies Of Data Architecture Ppt PowerPoint Presentation Model Designs Download
This is a important technologies of data architecture ppt powerpoint presentation model designs download. This is a three stage process. The stages in this process are marketing, management, strategy, business, technology.

Big Data Technology Development And Management Word Cloud Ppt Powerpoint Presentation Pictures Infographic Template
This is a big data technology development and management word cloud ppt powerpoint presentation pictures infographic template. This is a four stage process. The stages in this process are success, business, motivation, management, always, objectives, item, organizational, money, taking.

Data Driven Customer Insights In Digital Marketing Diagram Example Of Ppt
This is data driven customer insights in digital marketing diagram example of ppt. This is a eight stage process. The stages in this process are digital marketing, situation analysis, market trend, review, objective setting, customer analysis, competitor, mission.
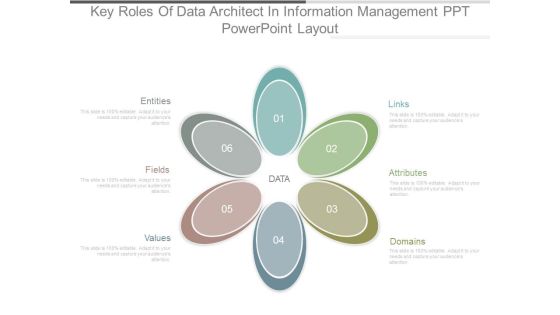
Key Roles Of Data Architect In Information Management Ppt Powerpoint Layout
This is a key roles of data architect in information management ppt powerpoint layout. This is a six stage process. The stages in this process are links, attributes, domains, values, fields, entities.
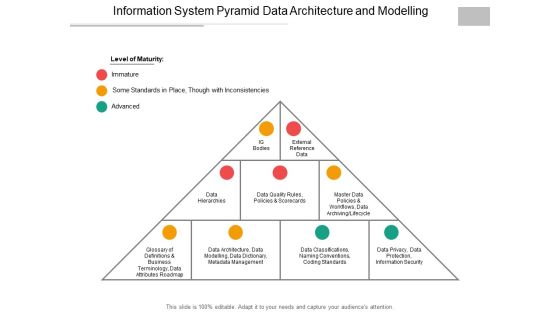
Information System Pyramid Data Architecture And Modelling Ppt PowerPoint Presentation Infographic Template Layout
This is a information system pyramid data architecture and modelling ppt powerpoint presentation infographic template layout. This is a three stage process. The stages in this process are governance pyramid, risk management pyramid, business.

Ways To Improve Crm Strategy Predictive And Big Data Analytics Ppt PowerPoint Presentation Portfolio Information
This is a ways to improve crm strategy predictive and big data analytics ppt powerpoint presentation portfolio information. This is a six stage process. The stages in this process are employee performance review, job evaluation, customer 360.

Data Collection And Analysis Control Chart Ppt PowerPoint Presentation Model Backgrounds
This is a data collection and analysis control chart ppt powerpoint presentation model backgrounds. This is a two stage process. The stages in this process are business, marketing, strategy, finance, analysis.

Segmentation Analysis Grouping Of Data Sets Ppt PowerPoint Presentation Ideas Backgrounds
This is a segmentation analysis grouping of data sets ppt powerpoint presentation ideas backgrounds. This is a two stage process. The stages in this process are cluster analysis, cluster examination, cluster investigation.
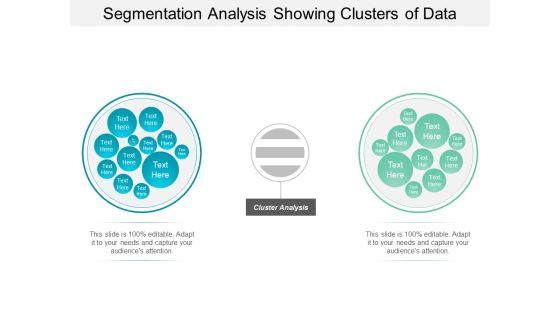
Segmentation Analysis Showing Clusters Of Data Ppt PowerPoint Presentation Ideas Designs Download
This is a segmentation analysis showing clusters of data ppt powerpoint presentation ideas designs download. This is a two stage process. The stages in this process are cluster analysis, cluster examination, cluster investigation.

Competitors Analysis Charts Graphs To Display Data Company Profiles Ppt PowerPoint Presentation Outline Visual Aids
This is a competitors analysis charts graphs to display data company profiles ppt powerpoint presentation outline visual aids. This is a five stage process. The stages in this process are finance, analysis, business, investment, marketing.

Data Collection And Analysis Flow Chart Template 1 Ppt PowerPoint Presentation Ideas Gridlines
This is a data collection and analysis flow chart template 1 ppt powerpoint presentation ideas gridlines. This is a nine stage process. The stages in this process are business, chart, organization, process, structure.

Data Collection And Analysis Flow Chart Template 2 Ppt PowerPoint Presentation Inspiration Layout Ideas
This is a data collection and analysis flow chart template 2 ppt powerpoint presentation inspiration layout ideas. This is a four stage process. The stages in this process are business, chart, organization, process, structure.

Data Collection And Analysis Flow Chart Ppt PowerPoint Presentation Ideas Images
This is a data collection and analysis flow chart ppt powerpoint presentation ideas images. This is a five stage process. The stages in this process are flow, marketing, strategy, process, arrows.

Data Collection And Analysis Control Chart Ppt PowerPoint Presentation Summary Templates
This is a data collection and analysis control chart ppt powerpoint presentation summary templates. This is a one stage process. The stages in this process are business, marketing, point label, upper limit, lower limit.

Data Collection And Analysis Flow Chart Ppt PowerPoint Presentation Model Rules
This is a data collection and analysis flow chart ppt powerpoint presentation model rules. This is a six stage process. The stages in this process are business, marketing, management, planning, chart.
Eight Sections Pie Chart For Percentage Data Analysis Ppt PowerPoint Presentation Styles Icons
This is a eight sections pie chart for percentage data analysis ppt powerpoint presentation styles icons. This is a eight stage process. The stages in this process are 6 piece pie chart, 6 segment pie chart, 6 parts pie chart.

Customer Data Research And Analysis Ppt PowerPoint Presentation Portfolio Designs Download
This is a customer data research and analysis ppt powerpoint presentation portfolio designs download. This is a two stage process. The stages in this process are customer experience, customer insight, consumer insight.
Data Research And Analysis For Mobile Users Ppt PowerPoint Presentation Icon Inspiration
This is a data research and analysis for mobile users ppt powerpoint presentation icon inspiration. This is a four stage process. The stages in this process are mobile analytics, mobile tracking, mobile web analytics.
 Home
Home