Data Model
Business Diagram Concepts Of Business With Icons Diagram PowerPoint Ppt Presentation
This business diagram displays 3d pie chart. It contains graphics of pie chart for business planning. This pie chart is a visual way of displaying data. Use this diagram to make outstanding presentations.
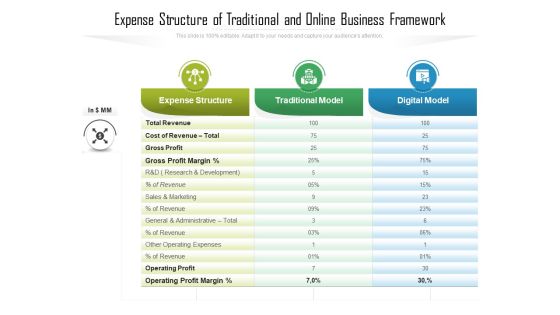
Expense Structure Of Traditional And Online Business Framework Ppt PowerPoint Presentation Ideas Graphics Design PDF
Showcasing this set of slides titled expense structure of traditional and online business framework ppt powerpoint presentation ideas graphics design pdf. The topics addressed in these templates are expense structure, traditional model, digital model. All the content presented in this PPT design is completely editable. Download it and make adjustments in color, background, font etc. as per your unique business setting.

Three Ways To Manage Trader Risk In Enrollment Summary PDF
This slide contains the information related to the ways of managing merchant risk that he may face during onboarding as well as for the monitoring purpose. It includes gathering actionable data, leverage analytics and rules and ensure comprehensive monitoring approach. Presenting Three Ways To Manage Trader Risk In Enrollment Summary PDF to dispense important information. This template comprises three stages. It also presents valuable insights into the topics including Leverage Analytics, Application Data, External Data. This is a completely customizable PowerPoint theme that can be put to use immediately. So, download it and address the topic impactfully.

Change Management Process Steps To Conduct Impacted Employee Analysis Professional PDF
This slide covers the steps to conduct impacted employee analysis which includes collecting data, identifying impacted groups, job roles and duties, authenticating employee analysis data, etc. The Change Management Process Steps To Conduct Impacted Employee Analysis Professional PDF is a compilation of the most recent design trends as a series of slides. It is suitable for any subject or industry presentation, containing attractive visuals and photo spots for businesses to clearly express their messages. This template contains a variety of slides for the user to input data, such as structures to contrast two elements, bullet points, and slides for written information. Slidegeeks is prepared to create an impression.

Customer Relationship Management Salesperson Dashboard With Pipeline And Activity Level Designs PDF
This slide illustrates graphical representation of CRM sales team member data. It includes pipeline, business components and activity level, categories etc. Pitch your topic with ease and precision using this Customer Relationship Management Salesperson Dashboard With Pipeline And Activity Level Designs PDF. This layout presents information on Categories, Business Components, Team Member. It is also available for immediate download and adjustment. So, changes can be made in the color, design, graphics or any other component to create a unique layout.

Hr Accomplishment Framework Template Powerpoint Slide Themes
This is a hr accomplishment framework template powerpoint slide themes. This is a six stage process. The stages in this process are meet with org leadership, assimilate, analyze data, implement, collaborate and discuss, discover.

Comprehensive Guide For Launch Sales By Lead Source Performance Indicator Inspiration PDF
This graph or chart is linked to excel, and changes automatically based on data. Just left click on it and select Edit Data. The Comprehensive Guide For Launch Sales By Lead Source Performance Indicator Inspiration PDF is a compilation of the most recent design trends as a series of slides. It is suitable for any subject or industry presentation, containing attractive visuals and photo spots for businesses to clearly express their messages. This template contains a variety of slides for the user to input data, such as structures to contrast two elements, bullet points, and slides for written information. Slidegeeks is prepared to create an impression.
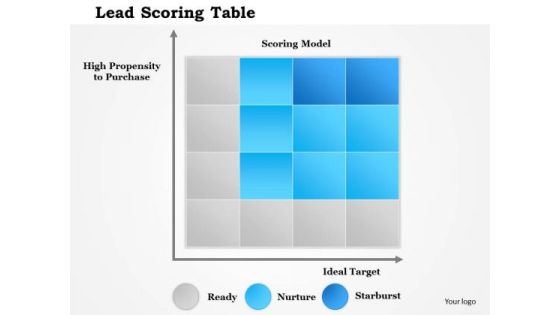
Business Framework Lead Scoring Table PowerPoint Presentation
A graph style cubical chart has been used to decorate this power point template slide. This PPT slide contains the concept of explaining score. Use this score table for displaying any data.

Accounting System Flowchart Ppt Presentation Portfolio
This is an accounting system flowchart ppt presentation portfolio. This is a one stage process. The stages in this process are sales receipt, look up price, product price file, sales transaction file, transmit sales data.

Artificial Intelligence Machine Learning Deep Learning Machine Learning Ppt PowerPoint Presentation Portfolio Microsoft PDF
Presenting this set of slides with name artificial intelligence machine learning deep learning machine learning ppt powerpoint presentation portfolio microsoft pdf. This is a four stage process. The stages in this process are information, machine learning, deliver predictive models, explicit programming, predictive model. This is a completely editable PowerPoint presentation and is available for immediate download. Download now and impress your audience.

Security Monitoring Dashboard With Application Control And Operating System Statistics Template PDF
This graph or chart is linked to excel, and changes automatically based on data. Just left click on it and select Edit Data. Deliver and pitch your topic in the best possible manner with this security monitoring dashboard with application control and operating system statistics template pdf. Use them to share invaluable insights on application control, restrict office macros, application patching, application hardening and impress your audience. This template can be altered and modified as per your expectations. So, grab it now.

Business Framework Shed Light On Topic Flashlight PowerPoint Presentation
This Power Point template slide has been designed with graphic of torch. This flash light has been used to display the concept of highlighting the any business data. Use this business slide for your technical presentation.

Customer Value Management Framework Diagram Ppt Example 2015
This is a customer value management framework diagram ppt example 2015. This is a seven stage process. The stages in this process are closed loop cvm process, evaluate campaigns, generate insights, price, analyze data, service, product, execute campaigns.

Dashboard For Real Time Telemarketing Process Management Themes PDF
The following slide highlights the dashboard for real time telesales process management illustrating real time data, employee data, performance, daily data, average handled call vs average answered call, employee ranking, AHT, AvgACW, ASA and hold percentage Showcasing this set of slides titled dashboard for real time telemarketing process management themes pdf The topics addressed in these templates are dashboard for real time telemarketing process management All the content presented in this PPT design is completely editable. Download it and make adjustments in color, background, font etc. as per your unique business setting.

Acquisition Analytics For Category Management Program Download PDF
This slide depicts the impact of using procurement analytics for managing category plan and sourcing strategies. It lists down visibility areas with corresponding actions involved and how it impacts the business in general. Showcasing this set of slides titled Acquisition Analytics For Category Management Program Download PDF. The topics addressed in these templates are Supplier Data, Spend Data, Performance Data. All the content presented in this PPT design is completely editable. Download it and make adjustments in color, background, font etc. as per your unique business setting.
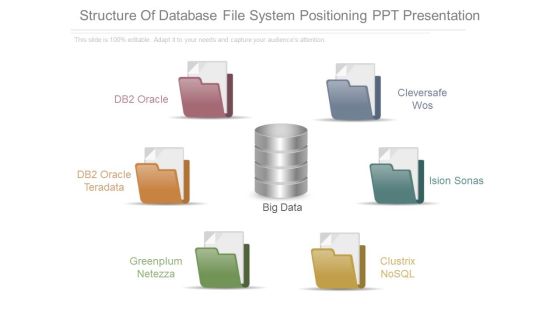
Structure Of Database File System Positioning Ppt Presentation
This is a structure of database file system positioning ppt presentation. This is a six stage process. The stages in this process are db2 oracle, db2 oracle teradata, greenplum netezza, big data, cleversafe wos, ision sonas, clustrix nosql.

Integrated Business Analysis Powerpoint Slides Design
This is a integrated business analysis powerpoint slides design. This is a five stage process. The stages in this process are approach data, investigation, statistics, practice methods, solution optimization.

Customer Relationship Management Dashboard Customer Retention Benefits Inspiration PDF
This graph or chart is linked to excel, and changes automatically based on data. Just left click on it and select Edit Data.Deliver an awe inspiring pitch with this creative customer relationship management dashboard customer retention benefits inspiration pdf bundle. Topics like increasing customer retention rates, on average, loyal customers are worth up to 10 times as ,much as their first purchase, profits by 25percent to 95percent can be discussed with this completely editable template. It is available for immediate download depending on the needs and requirements of the user.

Information Technology Corporate Evolution Journey Summary PDF
The slide showcases business transformation journey for information technology. It includes bottom line, business models, transformation, realignment etc. Persuade your audience using this Information Technology Corporate Evolution Journey Summary PDF. This PPT design covers seven stages, thus making it a great tool to use. It also caters to a variety of topics including Bottom Line, Business Models, Transformation. Download this PPT design now to present a convincing pitch that not only emphasizes the topic but also showcases your presentation skills.

Telemarketing Report Template 1 Ppt PowerPoint Presentation Show Structure
This is a telemarketing report template 1 ppt powerpoint presentation show structure. This is a four stage process. The stages in this process are inbound calls connected, appointment requested, appointment results, key data, daily connected calls.

Augmented And Virtual Reality Technologies Checklist To Create AR Application Slides PDF
This slide depicts the checklist to create an AR application, including identifying a problem, keeping it simple, re-engaging users, leveraging data, and adding a call to action CTA.Deliver and pitch your topic in the best possible manner with this Augmented And Virtual Reality Technologies Checklist To Create AR Application Slides PDF. Use them to share invaluable insights on Identify Problem, Leverage Data, Replicate Customer and impress your audience. This template can be altered and modified as per your expectations. So, grab it now.
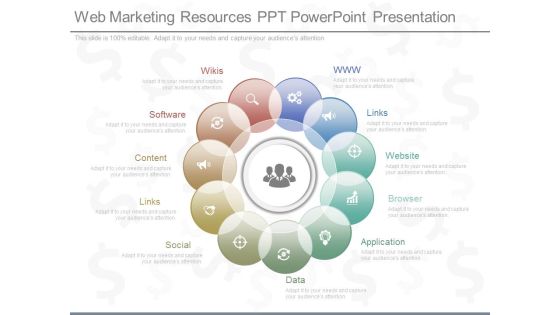
Web Marketing Resources Ppt Powerpoint Presentation
This is a web marketing resources ppt powerpoint presentation. This is a eleven stage process. The stages in this process are www, links, website, browser, application, data, social, links, content, software, wikis.

Kanban Structure For Task Management Ppt Summary Information PDF
This graph or chart is linked to excel, and changes automatically based on data. Just left click on it and select Edit Data. Showcasing this set of slides titled Kanban Structure For Task Management Ppt Summary Information PDF. The topics addressed in these templates are Backlog, In Progress, New Epic Added. All the content presented in this PPT design is completely editable. Download it and make adjustments in color, background, font etc. as per your unique business setting.

IT Security Evaluation Scorecard With Impact Status Ppt Portfolio Guidelines PDF
This graph or chart is linked to excel, and changes automatically based on data. Just left click on it and select Edit Data. Deliver and pitch your topic in the best possible manner with this IT Security Evaluation Scorecard With Impact Status Ppt Portfolio Guidelines PDF. Use them to share invaluable insights on Device Availability Application, Performance Port Health, Devices Reference Firmware and impress your audience. This template can be altered and modified as per your expectations. So, grab it now.

Openfin Capital Raising Understanding The Competitive Landscape Ppt Portfolio Layouts PDF
This graph or chart is linked to excel, and changes automatically based on data. Just left click on it and select Edit Data. Deliver and pitch your topic in the best possible manner with this Openfin Capital Raising Understanding The Competitive Landscape Ppt Portfolio Layouts PDF. Use them to share invaluable insights on Usage Application, Food Ordering, Food Blogging and impress your audience. This template can be altered and modified as per your expectations. So, grab it now.
Docsend Capital Fundraising Market Size Ppt Portfolio Icons PDF
This slide shows the estimated market size of DocSend company which includes data, assumptions and actual results. This is a docsend capital fundraising market size ppt portfolio icons pdf template with various stages. Focus and dispense information on three stages using this creative set, that comes with editable features. It contains large content boxes to add your information on topics like data, assumptions, results. You can also showcase facts, figures, and other relevant content using this PPT layout. Grab it now.

Resource Opportunity Evaluation And Assessment Framework Background PDF
The following slide showcases sourcing opportunity assessment report that identifies gaps and success factors. It includes gathering data, identifying opportunities and implementing plan. Showcasing this set of slides titled Resource Opportunity Evaluation And Assessment Framework Background PDF. The topics addressed in these templates are Gathering Data, Identifying Opportunities, Implementing Plan. All the content presented in this PPT design is completely editable. Download it and make adjustments in color, background, font etc. as per your unique business setting.

Business Reporting And Analysis Template Ppt Design
This is a business reporting and analysis template ppt design. This is a three stage process. The stages in this process are business reporting and analysis template, operations, executive, sales, value, services, analysis, reporting, decision, data, pull.

Finance Metrics Dashboard Indicating Portfolio Performance Microsoft PDF
This graph or chart is linked to excel, and changes automatically based on data. Just left click on it and select edit data. Pitch your topic with ease and precision using this Finance Metrics Dashboard Indicating Portfolio Performance Microsoft PDF. This layout presents information on Portfolio Performance Portfolio, Asset Management Manager, Top 10 Assets. It is also available for immediate download and adjustment. So, changes can be made in the color, design, graphics or any other component to create a unique layout.

Managing Artificial Intelligence Project Framework Ppt Ideas Backgrounds PDF
This slide exhibits information about self driving car project using anonymizing faces to protect individual privacy. It includes elements such as data, skills, value proposition, integration, stakeholders, revenue etc. Presenting Managing Artificial Intelligence Project Framework Ppt Ideas Backgrounds PDF to dispense important information. This template comprises four stages. It also presents valuable insights into the topics including Data, Value Proposition, Integration. This is a completely customizable PowerPoint theme that can be put to use immediately. So, download it and address the topic impactfully.

Client Helpline Dashboard With Support Status Ppt Portfolio Rules PDF
This graph or chart is linked to excel, and changes automatically based on data. Just left click on it and select Edit Data. Showcasing this set of slides titled Client Helpline Dashboard With Support Status Ppt Portfolio Rules PDF. The topics addressed in these templates are Total Number, Support Requests, Total Resolved, Support Status. All the content presented in this PPT design is completely editable. Download it and make adjustments in color, background, font etc. as per your unique business setting.

Businesses Digital Technologies Content Ppt Inspiration Slides PDF
This is a businesses digital technologies content ppt inspiration slides pdf template with various stages. Focus and dispense information on seven stages using this creative set, that comes with editable features. It contains large content boxes to add your information on topics like business models, revenue model, payment methodologies, strategy and applications. You can also showcase facts, figures, and other relevant content using this PPT layout. Grab it now.

Doughnut Graph With Multiple Construction Project Detail Structure PDF
This graph or chart is linked to excel, and changes automatically based on data. Just left click on it and select Edit Data. Showcasing this set of slides titled Doughnut Graph With Multiple Construction Project Detail Structure PDF. The topics addressed in these templates are Corporate Buildings, Residential Houses, Commercial Buildings. All the content presented in this PPT design is completely editable. Download it and make adjustments in color, background, font etc. as per your unique business setting.

Kanban Structure With Process Lead Time Ppt Gallery Template PDF
This graph or chart is linked to excel, and changes automatically based on data. Just left click on it and select Edit Data. Showcasing this set of slides titled Kanban Structure With Process Lead Time Ppt Gallery Template PDF. The topics addressed in these templates are Lead Time, In Realization, Requirements. All the content presented in this PPT design is completely editable. Download it and make adjustments in color, background, font etc. as per your unique business setting.

Business Sales Dashboard Revenue Summary Report Ppt PowerPoint Presentation Pictures Structure
This is a business sales dashboard revenue summary report ppt powerpoint presentation pictures structure. This is a two stage process. The stages in this process are business analytics, ba, organizations data.
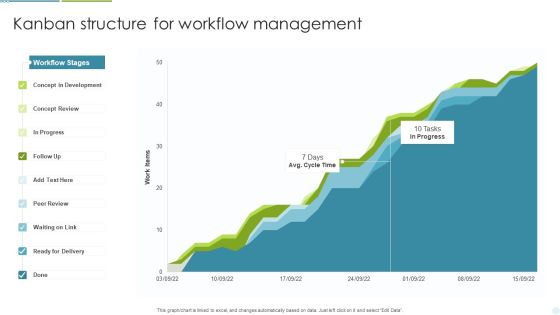
Kanban Structure For Workflow Management Ppt Inspiration Template PDF
This graph or chart is linked to excel, and changes automatically based on data. Just left click on it and select Edit Data. Pitch your topic with ease and precision using this Kanban Structure For Workflow Management Ppt Inspiration Template PDF. This layout presents information on Concept Development, Concept Review, Ready For Delivery. It is also available for immediate download and adjustment. So, changes can be made in the color, design, graphics or any other component to create a unique layout.
Four Arrows Design With Icons Powerpoint Template
The above PowerPoint slide displays four arrows design with icons. This PowerPoint diagram helps to summarize complex business data. Adjust the above diagram in your business presentations to visually support your content.
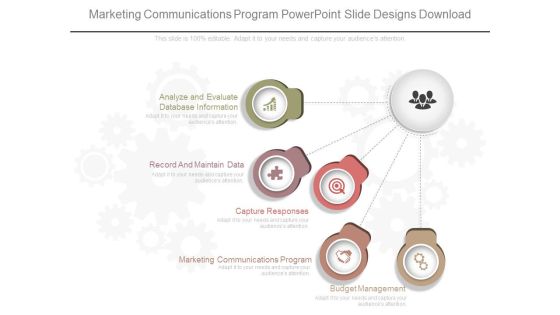
Marketing Communications Program Powerpoint Slide Designs Download
This is a marketing communications program powerpoint slide designs download. This is a five stage process. The stages in this process are budget management, marketing communications program, capture responses, record and maintain data, analyze and evaluate database information.

PowerPoint Design Gear Process Success Ppt Slide
PowerPoint Design Gear Process Success PPT Slide-If you need to create advanced, completely customizable diagrams for your data, Use this diagram with excellent graphics that help you convey your ideas successfully.-PowerPoint Design Gear Process Success PPT Slide

Why Is Agile Cost Effective IT Determining The Software Development Cost Agile Demonstration PDF
This graph or chart is linked to excel, and changes automatically based on data. Just left click on it and select Edit Data. Deliver and pitch your topic in the best possible manner with this Why Is Agile Cost Effective IT Determining The Software Development Cost Agile Demonstration PDF. Use them to share invaluable insights on Analysis And Design, Development, Project Management, Quality Assurance and impress your audience. This template can be altered and modified as per your expectations. So, grab it now.
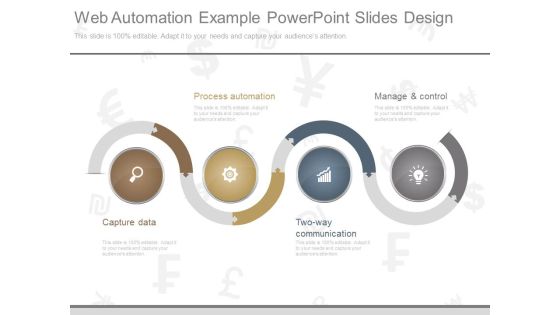
Web Automation Example Powerpoint Slides Design
This is a web automation example powerpoint slides design. This is a four stage process. The stages in this process are process automation, manage and control, capture data, two way communication.
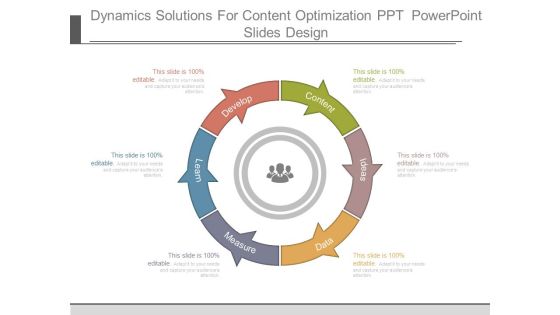
Dynamics Solutions For Content Optimization Ppt Powerpoint Slides Design
This is a dynamics solutions for content optimization ppt powerpoint slides design. This is a six stage process. The stages in this process are develop, learn, measure, data, ideas, content.

Current Year Sales Performance Scorecard With Profits Structure PDF
This graph or chart is linked to excel, and changes automatically based on data. Just left click on it and select Edit Data. Deliver and pitch your topic in the best possible manner with this Current Year Sales Performance Scorecard With Profits Structure PDF. Use them to share invaluable insights on Current Year, YTD Sales, Previous Year and impress your audience. This template can be altered and modified as per your expectations. So, grab it now.

Resource Administration Accounting Scorecard With Average Purchase Cost Structure PDF
This graph or chart is linked to excel, and changes automatically based on data. Just left click on it and select Edit Data. Deliver and pitch your topic in the best possible manner with this Resource Administration Accounting Scorecard With Average Purchase Cost Structure PDF. Use them to share invaluable insights on Stock Balance, Stock Quantity, Average Cost and impress your audience. This template can be altered and modified as per your expectations. So, grab it now.
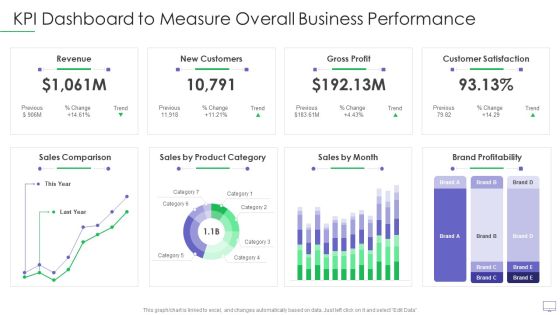
Guide For Software Developers KPI Dashboard To Measure Overall Business Performance Elements PDF
This graph or chart is linked to excel, and changes automatically based on data. Just left click on it and select Edit Data. Deliver an awe inspiring pitch with this creative guide for software developers kpi dashboard to measure overall business performance elements pdf bundle. Topics like revenue new customers, gross profit, customer satisfaction, sales comparison, brand profitability can be discussed with this completely editable template. It is available for immediate download depending on the needs and requirements of the user.
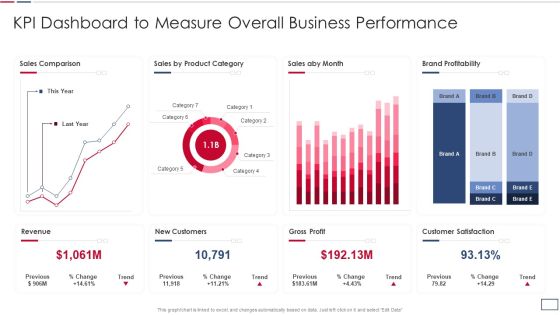
Software Developer Playbook Kpi Dashboard To Measure Overall Business Performance Topics PDF
This graph or chart is linked to excel, and changes automatically based on data. Just left click on it and select Edit Data. Deliver and pitch your topic in the best possible manner with this software developer playbook kpi dashboard to measure overall business performance topics pdf. Use them to share invaluable insights on revenue new customers, gross profit, customer satisfaction, sales comparison and impress your audience. This template can be altered and modified as per your expectations. So, grab it now.

Manufacturing Plan Ppt PowerPoint Presentation Layouts Designs Download
This is a manufacturing plan ppt powerpoint presentation layouts designs download. This is a five stage process. The stages in this process are task month, tables, data, analysis, planning.

B2b Email Append And Validation Ppt Powerpoint Slides Design
This is a b2b email append and validation ppt powerpoint slides design. This is a four stage process. The stages in this process are duplicate data, missing information, inaccurate information, incorrect information.

Activity Management Customer Relationship Management Dashboard With Lead Status Portrait PDF
This slide illustrates graphical representation of activity management CRM statistical data. It includes sales team lead status, revenue meter, campaigns revenue graph. Showcasing this set of slides titled Activity Management Customer Relationship Management Dashboard With Lead Status Portrait PDF. The topics addressed in these templates are Sales Team Lead Status, Leads Sourced From Market. All the content presented in this PPT design is completely editable. Download it and make adjustments in color, background, font etc. as per your unique business setting.

Need For Consumer Insights Ppt PowerPoint Presentation Designs
This is a need for consumer insights ppt powerpoint presentation designs. This is a four stage process. The stages in this process are lack of management buy in, lack of robust processes, inadequate data, associated skills.

Bar Graph Showing Revenues Generated By Sales Department Ppt Portfolio Graphics Example PDF
This graph or chart is linked to excel, and changes automatically based on data. Just left click on it and select edit data. Showcasing this set of slides titled bar graph showing revenues generated by sales department ppt portfolio graphics example pdf. The topics addressed in these templates are yearly sales revenues, sales team, profits. All the content presented in this PPT design is completely editable. Download it and make adjustments in color, background, font etc. as per your unique business setting.

Client Helpline Dashboard Average Time To Solve Issue Ppt Portfolio Visuals PDF
This graph or chart is linked to excel, and changes automatically based on data. Just left click on it and select Edit Data. Showcasing this set of slides titled Client Helpline Dashboard Average Time To Solve Issue Ppt Portfolio Visuals PDF. The topics addressed in these templates are Cost Per Support, Customer Satisfaction, Costs To Revenue. All the content presented in this PPT design is completely editable. Download it and make adjustments in color, background, font etc. as per your unique business setting.
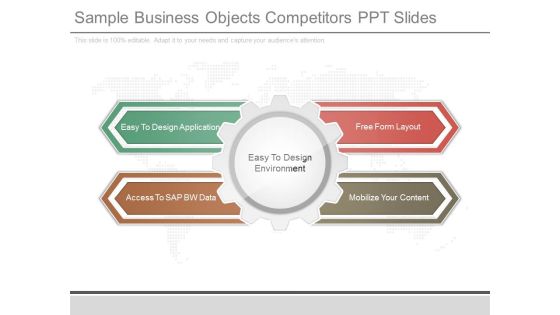
Sample Business Objects Competitors Ppt Slides
This is a sample business objects competitors ppt slides. This is a four stage process. The stages in this process are easy to design application, free form layout, access to sap bw data, mobilize your content.

Agile Unified Process Software Programming Agile Unified Process Implementation Discipline Mockup PDF
This slide provides the glimpse about the AUP implementation discipline which focuses on stakeholder, agile modeler, etc. along with develop, build and develop database phases. This is a agile unified process software programming agile unified process implementation discipline mockup pdf template with various stages. Focus and dispense information on one stages using this creative set, that comes with editable features. It contains large content boxes to add your information on topics like requirements model, design model, enterprise development guidance, traceability matrix. You can also showcase facts, figures, and other relevant content using this PPT layout. Grab it now.

Kanban Structure For Monitor Weekly Issues Resolving Progress Ppt Professional Outline PDF
This graph or chart is linked to excel, and changes automatically based on data. Just left click on it and select Edit Data. Showcasing this set of slides titled Kanban Structure For Monitor Weekly Issues Resolving Progress Ppt Professional Outline PDF. The topics addressed in these templates are Issues Resolved, Progress To Resolved, Issues To Resolved. All the content presented in this PPT design is completely editable. Download it and make adjustments in color, background, font etc. as per your unique business setting.
Kanban Structure For Yearly Project Progress Tracking Ppt File Example Introduction PDF
This graph or chart is linked to excel, and changes automatically based on data. Just left click on it and select Edit Data. Showcasing this set of slides titled Kanban Structure For Yearly Project Progress Tracking Ppt File Example Introduction PDF. The topics addressed in these templates are Number Projects, Backlog Approved, Final Review. All the content presented in this PPT design is completely editable. Download it and make adjustments in color, background, font etc. as per your unique business setting.
Kanban Structure To Track Cycle Time For Project Execution Ppt Icon Images PDF
This graph or chart is linked to excel, and changes automatically based on data. Just left click on it and select Edit Data. Showcasing this set of slides titled Kanban Structure To Track Cycle Time For Project Execution Ppt Icon Images PDF. The topics addressed in these templates are Lead Time, Cycle Time, WIP Limit. All the content presented in this PPT design is completely editable. Download it and make adjustments in color, background, font etc. as per your unique business setting.

Kanban Structure To Manage Weekly Work Activities Ppt Professional Aids PDF
This graph or chart is linked to excel, and changes automatically based on data. Just left click on it and select Edit Data. Pitch your topic with ease and precision using this Kanban Structure To Manage Weekly Work Activities Ppt Professional Aids PDF. This layout presents information on Legend, Ready To Start, In Progress. It is also available for immediate download and adjustment. So, changes can be made in the color, design, graphics or any other component to create a unique layout.
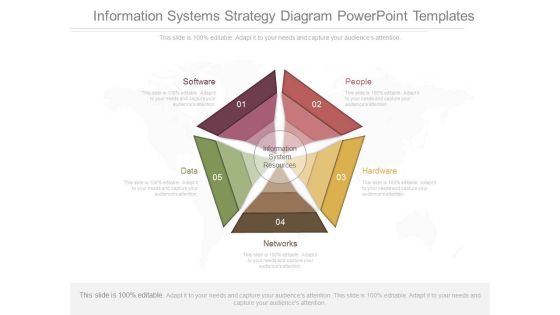
Information Systems Strategy Diagram Powerpoint Templates
This is a information systems strategy diagram powerpoint templates. This is a five stage process. The stages in this process are software, people, hardware, data, networks, information system resources.
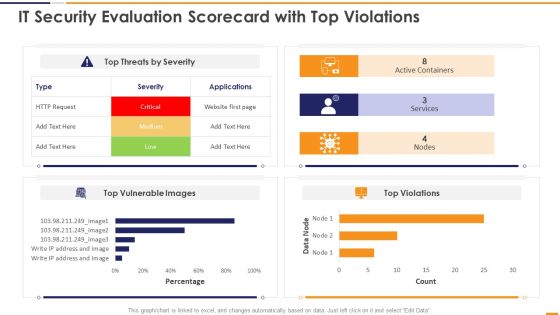
IT Security Evaluation Scorecard With Top Violations Ppt Portfolio Deck PDF
This graph or chart is linked to excel, and changes automatically based on data. Just left click on it and select Edit Data. Deliver an awe inspiring pitch with this creative IT Security Evaluation Scorecard With Top Violations Ppt Portfolio Deck PDF bundle. Topics like Top Threats Severity, Active Containers Services, Top Vulnerable Images can be discussed with this completely editable template. It is available for immediate download depending on the needs and requirements of the user.
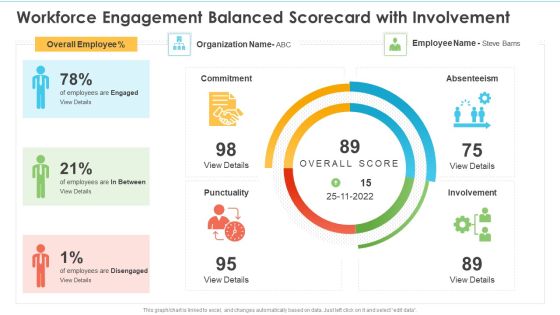
Workforce Engagement Balanced Scorecard With Involvement Ppt Portfolio Background Images PDF
This graph or chart is linked to excel, and changes automatically based on data. Just left click on it and select edit data. Deliver and pitch your topic in the best possible manner with this Workforce Engagement Balanced Scorecard With Involvement Ppt Portfolio Background Images PDF. Use them to share invaluable insights on Employee, Organization, Overall Employee and impress your audience. This template can be altered and modified as per your expectations. So, grab it now.

Workforce Engagement Scorecard With Net Promoter Score Ppt Portfolio Images PDF
This graph or chart is linked to excel, and changes automatically based on data. Just left click on it and select edit data. Deliver and pitch your topic in the best possible manner with this Workforce Engagement Scorecard With Net Promoter Score Ppt Portfolio Images PDF. Use them to share invaluable insights on Employee Involvement, Punctuality Involvement, Absenteeism and impress your audience. This template can be altered and modified as per your expectations. So, grab it now.

Due Diligence Summary Template 1 Ppt PowerPoint Presentation Layouts Graphics Design
This is a due diligence summary template 1 ppt powerpoint presentation layouts graphics design. This is a two stage process. The stages in this process are business, currency, big data, search, marketing, strategy.
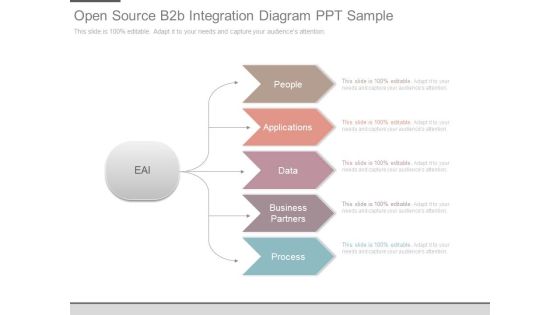
Open Source B2b Integration Diagram Ppt Sample
This is a open source b2b integration diagram ppt sample. This is a five stage process. The stages in this process are eai, people, applications, data, business partners, process.

App Transferring Management Template Powerpoint Slide Ideas
This is a app transferring management template powerpoint slide ideas. This is a five stage process. The stages in this process are super users and operations, application product support, virtual services, capacity data, projects and major enhancements.

Agile Role In Business Applications Agile Unified Process Implementation Discipline Brochure PDF
This slide provides the glimpse about the AUP implementation discipline which focuses on stakeholder, agile modeler, etc. along with develop, build and develop database phases. This is a agile role in business applications agile unified process implementation discipline brochure pdf template with various stages. Focus and dispense information on one stages using this creative set, that comes with editable features. It contains large content boxes to add your information on topics like requirements model, design model, enterprise development guidance, traceability matrix. You can also showcase facts, figures, and other relevant content using this PPT layout. Grab it now.
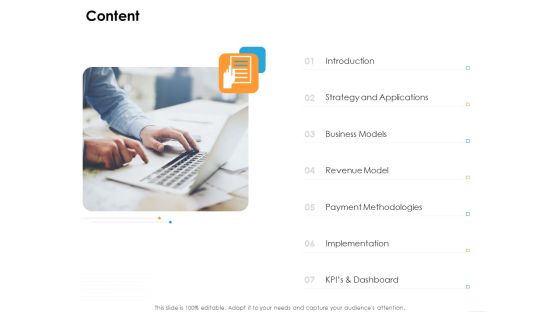
Ecommerce Management Content Ppt File Layouts PDF
This is a ecommerce management content ppt file layouts pdf template with various stages. Focus and dispense information on seven stages using this creative set, that comes with editable features. It contains large content boxes to add your information on topics like business models, revenue model, implementation, payment methodologies, introduction. You can also showcase facts, figures, and other relevant content using this PPT layout. Grab it now.

Netflix Company Outline Technology Stack Summary PDF
This slide showcases the Netflixs technology stack which includes application and data, utilities, devOps and business tools.Deliver and pitch your topic in the best possible manner with this Netflix Company Outline Technology Stack Summary PDF. Use them to share invaluable insights on Application And Data, Business Tools, Utilities and impress your audience. This template can be altered and modified as per your expectations. So, grab it now.
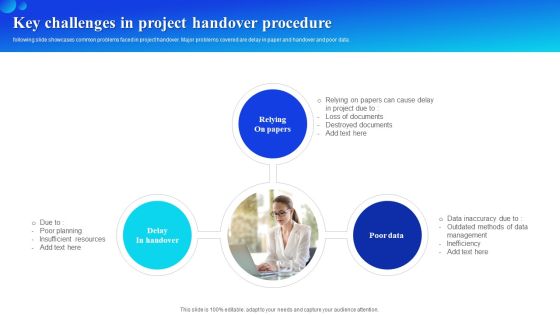
Key Challenges In Project Handover Procedure Designs PDF
following slide showcases common problems faced in project handover. Major problems covered are delay in paper and handover and poor data. Presenting Key Challenges In Project Handover Procedure Designs PDF to dispense important information. This template comprises three stages. It also presents valuable insights into the topics including Relying On Papers, Delay In Handover, Poor Data. This is a completely customizable PowerPoint theme that can be put to use immediately. So, download it and address the topic impactfully.
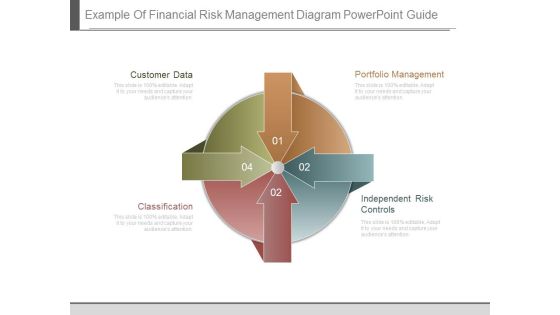
Example Of Financial Risk Management Diagram Powerpoint Guide
This is a example of financial risk management diagram powerpoint guide. This is a four stage process. The stages in this process are customer data, portfolio management, classification, independent risk controls.

Customer Relationship Management Procedure Digital Marketing Integration In CRM Slides PDF
Presenting customer relationship management procedure digital marketing integration in CRM slides pdf to provide visual cues and insights. Share and navigate important information on six stages that need your due attention. This template can be used to pitch topics like social, personalized predictive recommendations, customer product data, web services integrations, customer intelligence engine. In addtion, this PPT design contains high resolution images, graphics, etc, that are easily editable and available for immediate download.

Agile Team Member Customer Relationship Management Dashboard With Deals Funnel Mockup PDF
This slide illustrates graphical representation of CRM sales team member data. It includes pipeline, business components and activity level, categories etc. Pitch your topic with ease and precision using this Agile Team Member Customer Relationship Management Dashboard With Deals Funnel Mockup PDF. This layout presents information on Funnel Of Deals, Sent Campaigns Emails, Sales Chart. It is also available for immediate download and adjustment. So, changes can be made in the color, design, graphics or any other component to create a unique layout.
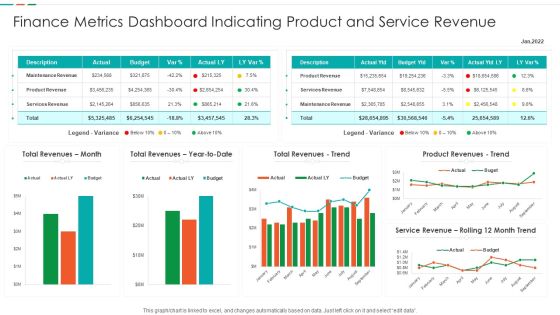
Finance Metrics Dashboard Indicating Product And Service Revenue Designs PDF
This graph or chart is linked to excel, and changes automatically based on data. Just left click on it and select edit data. Showcasing this set of slides titled Finance Metrics Dashboard Indicating Product And Service Revenue Designs PDF. The topics addressed in these templates are Maintenance Revenue Product, Revenue Product Revenues, Service Revenue Rolling. All the content presented in this PPT design is completely editable. Download it and make adjustments in color, background, font etc. as per your unique business setting.

Dashboard Depicting Security Problem Management Metrics Ppt Gallery Designs PDF
This graph or chart is linked to excel, and changes automatically based on data. Just left click on it and select Edit Data. Showcasing this set of slides titled Dashboard Depicting Security Problem Management Metrics Ppt Gallery Designs PDF. The topics addressed in these templates are Percentage, New Critical, Security Incidents. All the content presented in this PPT design is completely editable. Download it and make adjustments in color, background, font etc. as per your unique business setting.

Resource Administration Accounting Scorecard With Inventory Summary Designs PDF
This graph or chart is linked to excel, and changes automatically based on data. Just left click on it and select Edit Data. Deliver and pitch your topic in the best possible manner with this Resource Administration Accounting Scorecard With Inventory Summary Designs PDF. Use them to share invaluable insights on Product Details, Top Selling Item, Purchase Order and impress your audience. This template can be altered and modified as per your expectations. So, grab it now.

Information Technology Infrastructure Layers Ppt PowerPoint Presentation Outline Inspiration
This is a information technology infrastructure layers ppt powerpoint presentation outline inspiration. This is a five stage process. The stages in this process are osi model, technology layers, internetworking layer.

FMEA To Determine Potential Dashboard Design Failure Mode And Effect Analysis DFMEA Ppt Show Styles PDF
This graph or chart is linked to excel, and changes automatically based on data. Just left click on it and select Edit Data. Deliver an awe inspiring pitch with this creative FMEA To Determine Potential Dashboard Design Failure Mode And Effect Analysis DFMEA Ppt Show Styles PDF bundle. Topics like Target Completion, Recommended Action, RPN Breakdown can be discussed with this completely editable template. It is available for immediate download depending on the needs and requirements of the user.

Business Diagram Five Staged Business Points Display Text Box Diagram Presentation Template
This Power Point template slide has been designed with graphic of five staged text box diagrams. This PPT slide can be used for displaying business data. Use this PPT slide for your business presentations and get good remarks.

Customer Relationship Roadmap Developed For Client Engagement Portrait PDF
Presenting customer relationship roadmap developed for client engagement portrait pdf to dispense important information. This template comprises six stages. It also presents valuable insights into the topics including analyze data, timely content, segmentation and targeting. This is a completely customizable PowerPoint theme that can be put to use immediately. So, download it and address the topic impactfully.
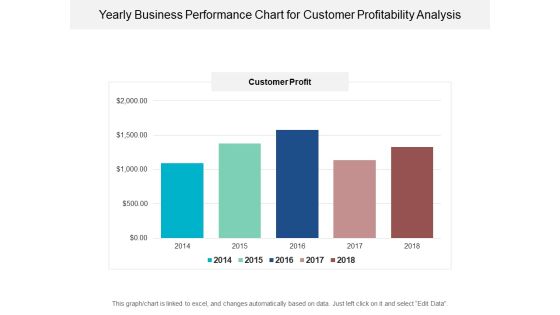
Yearly Business Performance Chart For Customer Profitability Analysis Ppt PowerPoint Presentation Ideas Picture
This is a yearly business performance chart for customer profitability analysis ppt powerpoint presentation ideas picture. This is a five stage process. The stages in this process are financial analysis, quantitative, statistical modelling.

Call Center Client Helpline Dashboard Status Ppt Show Graphics Design PDF
This graph or chart is linked to excel, and changes automatically based on data. Just left click on it and select Edit Data. Showcasing this set of slides titled Call Center Client Helpline Dashboard Status Ppt Show Graphics Design PDF. The topics addressed in these templates are Call Monitor, Active Calls, Abandoned, Agents Ready. All the content presented in this PPT design is completely editable. Download it and make adjustments in color, background, font etc. as per your unique business setting.

Product Performance Highlights With Key Growth Drivers Ppt Pictures Design Templates PDF
This graph or chart is linked to excel, and changes automatically based on data. Just left click on it and select Edit Data. Pitch your topic with ease and precision using this Product Performance Highlights With Key Growth Drivers Ppt Pictures Design Templates PDF. This layout presents information on Product Performance, Key Growth, Projected Growth. It is also available for immediate download and adjustment. So, changes can be made in the color, design, graphics or any other component to create a unique layout.
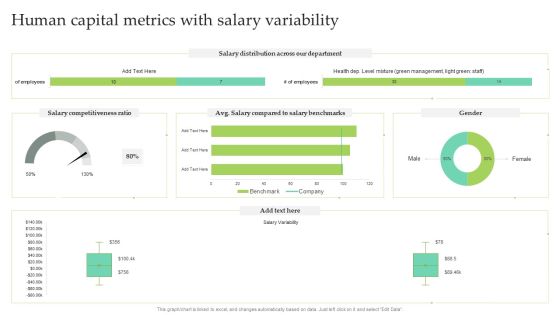
Human Capital Metrics With Salary Variability Ppt Infographic Template Designs PDF
This graph or chart is linked to excel, and changes automatically based on data. Just left click on it and select Edit Data. Pitch your topic with ease and precision using this Human Capital Metrics With Salary Variability Ppt Infographic Template Designs PDF. This layout presents information on Salary Distribution, Salary Competitiveness Ratio, Male. It is also available for immediate download and adjustment. So, changes can be made in the color, design, graphics or any other component to create a unique layout.

IT Security Evaluation Scorecard With Bar Graph Ppt Gallery Design Templates PDF
This graph or chart is linked to excel, and changes automatically based on data. Just left click on it and select Edit Data. Deliver and pitch your topic in the best possible manner with this IT Security Evaluation Scorecard With Bar Graph Ppt Gallery Design Templates PDF. Use them to share invaluable insights on CPU Utilization Memory, Utilization Packet Loss and impress your audience. This template can be altered and modified as per your expectations. So, grab it now.
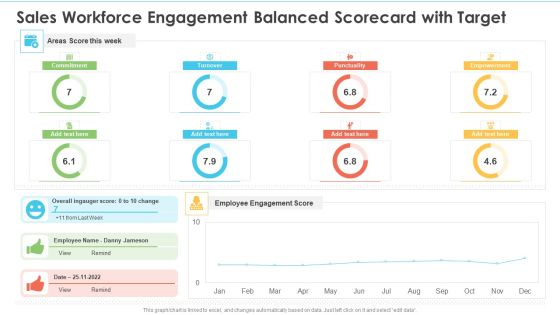
Sales Workforce Engagement Balanced Scorecard With Target Ppt Professional Designs Download PDF
This graph or chart is linked to excel, and changes automatically based on data. Just left click on it and select edit data. Deliver an awe inspiring pitch with this creative Sales Workforce Engagement Balanced Scorecard With Target Ppt Professional Designs Download PDF bundle. Topics like Areas Score Week, Employee Engagement Score, Overall Ingauger Score can be discussed with this completely editable template. It is available for immediate download depending on the needs and requirements of the user.

Playbook For Sales Growth Strategies Digital Marketing Dashboard For Organic Growth Designs PDF
This graph or chart is linked to excel, and changes automatically based on data. Just left click on it and select Edit Data. Deliver and pitch your topic in the best possible manner with this Playbook For Sales Growth Strategies Digital Marketing Dashboard For Organic Growth Designs PDF. Use them to share invaluable insights on Unique Visitors, Sessions, Bounce Rate and impress your audience. This template can be altered and modified as per your expectations. So, grab it now.

Consumer Retention Techniques Strategies For Building Strong Relationships To Improve Infographics PDF
This slide shows the strategies that can be used by the medical facility or institution in order to build strong patient relationship such as consolidating data, identify the right patients, optimize the right channels, leverage patient journey mapping etc. Deliver and pitch your topic in the best possible manner with this consumer retention techniques strategies for building strong relationships to improve infographics pdf. Use them to share invaluable insights on consolidate data, identify right patients, optimize right channels, leverage patient journey mapping, strategy and impress your audience. This template can be altered and modified as per your expectations. So, grab it now.

Business Marketing Websites Example Powerpoint Slide Information
This is a business marketing websites example powerpoint slide information. This is a five stage process. The stages in this process are define goals, analyze data, content, navigation, design.
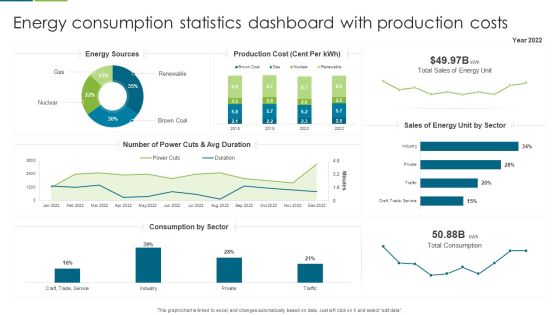
Energy Consumption Statistics Dashboard With Production Costs Slides PDF
This graph or chart is linked to excel, and changes automatically based on data. Just left click on it and select edit data. Showcasing this set of slides titled Energy Consumption Statistics Dashboard With Production Costs Slides PDF. The topics addressed in these templates are Production Cost, Sales Energy, Number Power. All the content presented in this PPT design is completely editable. Download it and make adjustments in color, background, font etc. as per your unique business setting.

Energy Consumption Statistics Dashboard With Yearly Savings Guidelines PDF
This graph or chart is linked to excel, and changes automatically based on data. Just left click on it and select edit data. Showcasing this set of slides titled Energy Consumption Statistics Dashboard With Yearly Savings Guidelines PDF. The topics addressed in these templates are Production Consumption, Energy Savings, Performance Ratio. All the content presented in this PPT design is completely editable. Download it and make adjustments in color, background, font etc. as per your unique business setting.

Chart Illustrating Manufacturing Plant Energy Consumption Statistics Slides PDF
This graph or chart is linked to excel, and changes automatically based on data. Just left click on it and select edit data. Pitch your topic with ease and precision using this Chart Illustrating Manufacturing Plant Energy Consumption Statistics Slides PDF. This layout presents information on Equipment Inefficiency, Process Heating, Energy Export. It is also available for immediate download and adjustment. So, changes can be made in the color, design, graphics or any other component to create a unique layout.
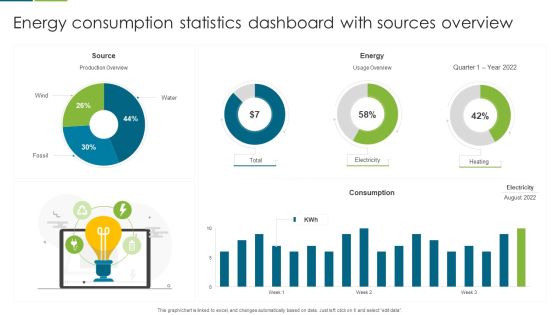
Energy Consumption Statistics Dashboard With Sources Overview Template PDF
This graph or chart is linked to excel, and changes automatically based on data. Just left click on it and select edit data. Pitch your topic with ease and precision using this Energy Consumption Statistics Dashboard With Sources Overview Template PDF. This layout presents information on Source, Energy, Consumption. It is also available for immediate download and adjustment. So, changes can be made in the color, design, graphics or any other component to create a unique layout.
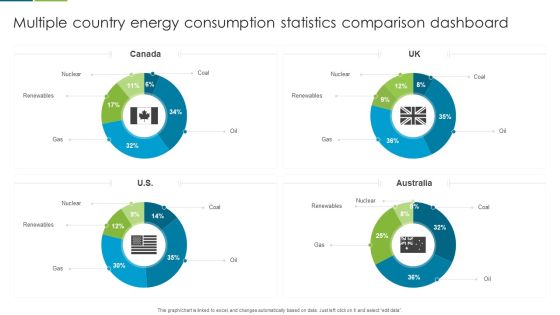
Multiple Country Energy Consumption Statistics Comparison Dashboard Formats PDF
This graph or chart is linked to excel, and changes automatically based on data. Just left click on it and select edit data. Pitch your topic with ease and precision using this Multiple Country Energy Consumption Statistics Comparison Dashboard Formats PDF. This layout presents information on Nuclear, Renewables, Gas. It is also available for immediate download and adjustment. So, changes can be made in the color, design, graphics or any other component to create a unique layout.

Website Traffic Analysis Diagram Presentation Layouts
This is a website traffic analysis diagram presentation layouts. This is a four stage process. The stages in this process are keywords used, design analysis, define goals, collect data, web analysis process.
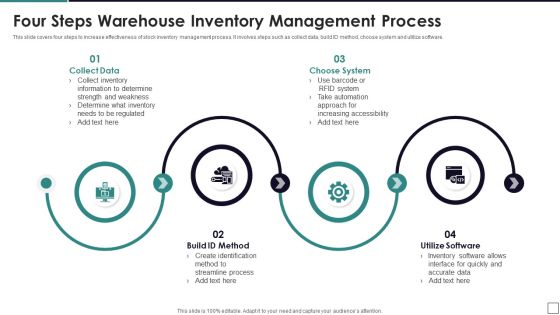
Four Steps Warehouse Inventory Management Process Demonstration PDF
This slide covers four steps to increase effectiveness of stock inventory management process. It involves steps such as collect data, build ID method, choose system and utilize software. Presenting Four Steps Warehouse Inventory Management Process Demonstration PDF to dispense important information. This template comprises four stages. It also presents valuable insights into the topics including Collect Data, Choose System, Utilize Software. This is a completely customizable PowerPoint theme that can be put to use immediately. So, download it and address the topic impactfully.
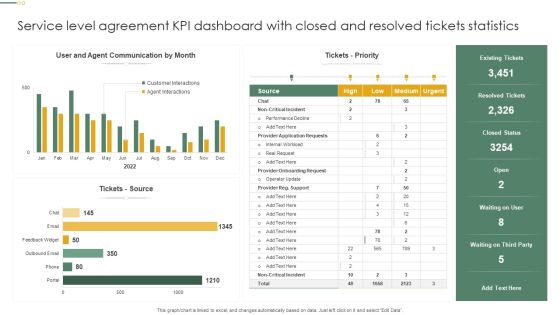
Service Level Agreement KPI Dashboard With Closed And Resolved Tickets Statistics Inspiration PDF
This graph or chart is linked to excel, and changes automatically based on data. Just left click on it and select Edit Data. Showcasing this set of slides titled Service Level Agreement KPI Dashboard With Closed And Resolved Tickets Statistics Inspiration PDF. The topics addressed in these templates are Tickets Priority, Tickets Source, Resolved Tickets. All the content presented in this PPT design is completely editable. Download it and make adjustments in color, background, font etc. as per your unique business setting.
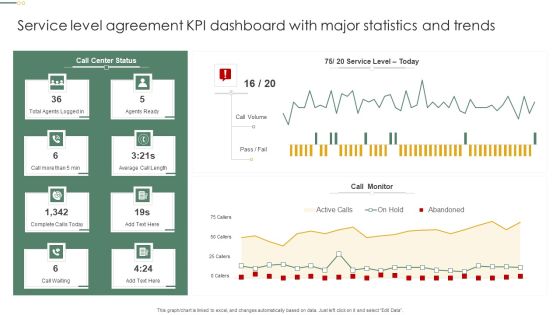
Service Level Agreement KPI Dashboard With Major Statistics And Trends Pictures PDF
This graph or chart is linked to excel, and changes automatically based on data. Just left click on it and select Edit Data. Pitch your topic with ease and precision using this Service Level Agreement KPI Dashboard With Major Statistics And Trends Pictures PDF. This layout presents information on Call Monitor, Call Volume, Agents Ready. It is also available for immediate download and adjustment. So, changes can be made in the color, design, graphics or any other component to create a unique layout.

Doughnut Graph Depicting Time Spent On Multiple Project Activities Microsoft PDF
This graph or chart is linked to excel, and changes automatically based on data. Just left click on it and select Edit Data. Showcasing this set of slides titled Doughnut Graph Depicting Time Spent On Multiple Project Activities Microsoft PDF. The topics addressed in these templates are Website Development, IT Incident Management, Portfolio Management. All the content presented in this PPT design is completely editable. Download it and make adjustments in color, background, font etc. as per your unique business setting.

Business Diagram Circles For Percentage Growth Presentation Template
This business slide has been designed with graphics of circles. You may download this diagram to display percentage growth data. This template is innovatively designed to highlight your worthy views
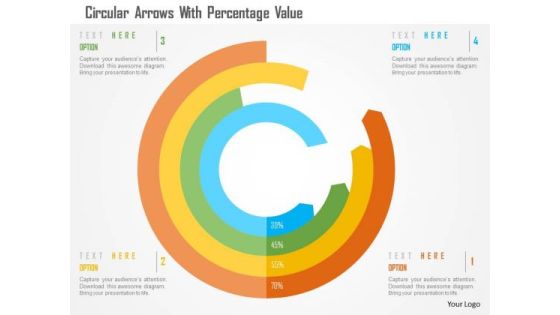
Business Diagram Circular Arrows With Percentage Value Presentation Template
This business slide has been designed with circular arrows. You may download this diagram to display percentage growth data. This template is innovatively designed to highlight your worthy views

Cloud Based Product Development Process Ppt Idea
This is a cloud based product development process ppt idea. This is a five stage process. The stages in this process are make, design, visualize, collaborate, use, design data.

Four Arrows Tags Infographics Powerpoint Template
The above PowerPoint slide displays four arrows design with icons. This PowerPoint diagram helps to summarize complex business data. Adjust the above diagram in your business presentations to visually support your content.
Stock Photo Card Board Download Arrow Icon PowerPoint Slide
This image slide is designed with cardboard and download arrow. This image contains the graphic of download icon with cardboard depicting downloading and storage of data. Use this image to make outstanding presentations.

Business Diagram Four Options Layout Diagram For Business Presentation Template
Four options circular diagram is used to design this power point template. This business diagram can be used to compare and present data. Use this diagram to make your presentations more effective.
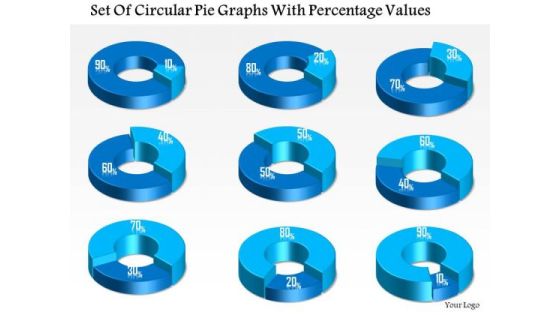
Business Diagram Set Of Circular Pie Graphs With Percentage Values Presentation Template
This business diagram displays set of pie charts. This Power Point template has been designed to compare and present business data. Download this diagram to represent stages of business growth.
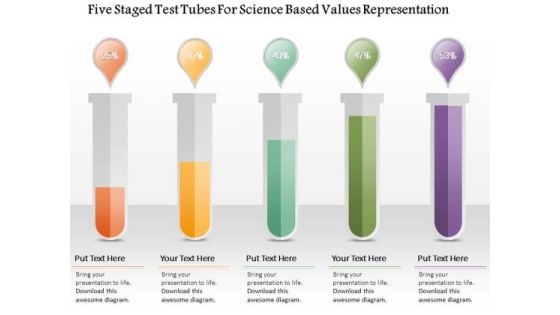
Busines Diagram Five Staged Test Tubes For Science Based Values Representation Ppt Template
Five staged test tubes are used to design this business diagram. This business slide contains the concept of value representation based on scientific data. Ideas are best expressed easily with the help of this diagram slide

Market Research Analyst Layout Ppt Templates
This is a market research analyst layout ppt templates. This is a five stage process. The stages in this process are problem definition, specifying research objectives, creating the research design, collect the data, analyze and evaluate result.
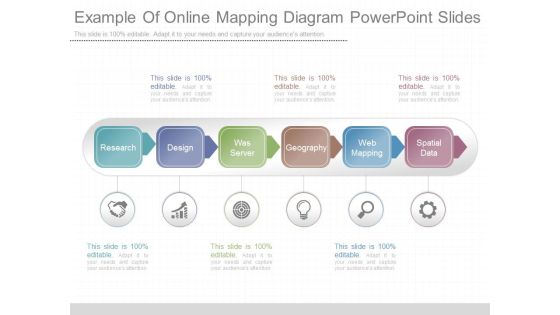
Example Of Online Mapping Diagram Powerpoint Slides
This is a example of online mapping diagram powerpoint slides. This is a six stage process. The stages in this process are research, design, was server, geography, web mapping, spatial data.
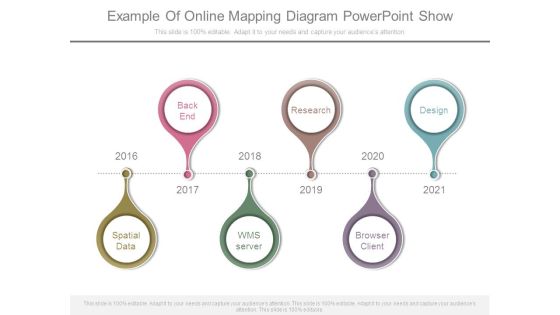
Example Of Online Mapping Diagram Powerpoint Show
This is a example of online mapping diagram powerpoint show. This is a six stage process. The stages in this process are back end, research, design, spatial data, wms server, browser client.

Summary Financial Accounting Statement Profit And Loss Analysis Dashboard Elements PDF
This graph or chart is linked to excel, and changes automatically based on data. Just left click on it and select Edit Data. Deliver an awe inspiring pitch with this creative Summary Financial Accounting Statement Profit And Loss Analysis Dashboard Elements PDF bundle. Topics like P And L Structure Dynamics, Dupont Rations, Debt Coverage Ratios, Creditworthiness Assessment can be discussed with this completely editable template. It is available for immediate download depending on the needs and requirements of the user.

Online Distribution Services Content Ppt Outline Objects PDF
This is a online distribution services content ppt outline objects pdf template with various stages. Focus and dispense information on seven stages using this creative set, that comes with editable features. It contains large content boxes to add your information on topics like business models, revenue model, implementation, payment methodologies, introduction. You can also showcase facts, figures, and other relevant content using this PPT layout. Grab it now.

Digital Products And Services Content Ppt Professional Introduction PDF
This is a digital products and services content ppt professional introduction pdf template with various stages. Focus and dispense information on seven stages using this creative set, that comes with editable features. It contains large content boxes to add your information on topics like business models, revenue model, implementation, payment methodologies, introduction. You can also showcase facts, figures, and other relevant content using this PPT layout. Grab it now.
Ecommerce Solution Providers Content Ppt Gallery Icons PDF
This is a ecommerce solution providers content ppt gallery icons pdf template with various stages. Focus and dispense information on seven stages using this creative set, that comes with editable features. It contains large content boxes to add your information on topics like business models, revenue model, implementation, payment methodologies, introduction. You can also showcase facts, figures, and other relevant content using this PPT layout. Grab it now.

Online Trade Management System Content Ppt Examples PDF
This is a online trade management system content ppt examples pdf template with various stages. Focus and dispense information on seven stages using this creative set, that comes with editable features. It contains large content boxes to add your information on topics like business models, revenue model, implementation, payment methodologies, introduction. You can also showcase facts, figures, and other relevant content using this PPT layout. Grab it now.

Employee Community Engagement Principles With Management Role Inspiration PDF
The slide highlights the employee engagement principles with management role illustrating recognition, real time data, appreciation gesture, management role and engagement structure. Presenting Employee Community Engagement Principles With Management Role Inspiration PDF to dispense important information. This template comprises five stages. It also presents valuable insights into the topics including Recognition, Real Time Data, Appreciation Gesture, Management Role. This is a completely customizable PowerPoint theme that can be put to use immediately. So, download it and address the topic impactfully.
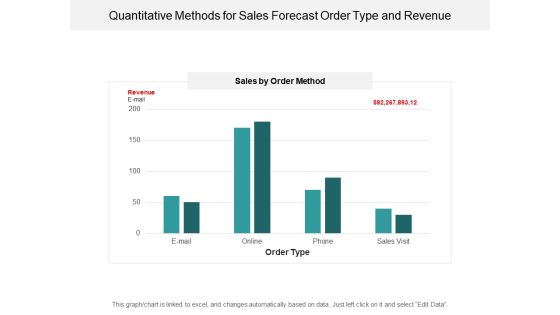
Quantitative Methods For Sales Forecast Order Type And Revenue Ppt PowerPoint Presentation Styles Show
This is a quantitative methods for sales forecast order type and revenue ppt powerpoint presentation styles show. This is a four stage process. The stages in this process are financial analysis, quantitative, statistical modelling.
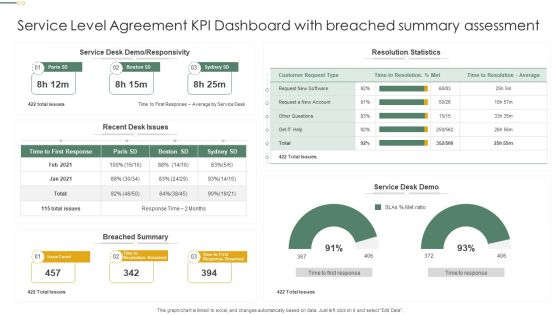
Service Level Agreement KPI Dashboard With Breached Summary Assessment Professional PDF
This graph or chart is linked to excel, and changes automatically based on data. Just left click on it and select Edit Data. Pitch your topic with ease and precision using this Service Level Agreement KPI Dashboard With Breached Summary Assessment Professional PDF. This layout presents information on Resolution Statistics, Service Desk Demo, Breached Summary. It is also available for immediate download and adjustment. So, changes can be made in the color, design, graphics or any other component to create a unique layout.
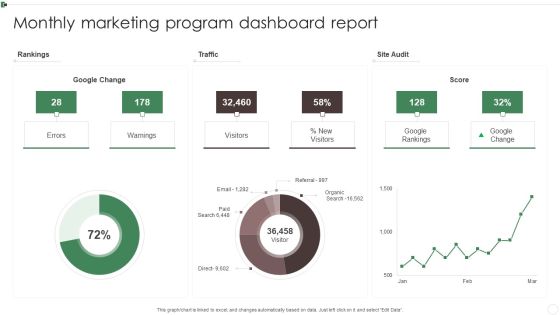
Monthly Marketing Program Dashboard Report Ppt Inspiration Information PDF
This graph or chart is linked to excel, and changes automatically based on data. Just left click on it and select Edit Data. Pitch your topic with ease and precision using this Monthly Marketing Program Dashboard Report Ppt Inspiration Information PDF. This layout presents information on Rankings, Traffic, Site Audit, Warnings. It is also available for immediate download and adjustment. So, changes can be made in the color, design, graphics or any other component to create a unique layout.

Weekly Sales Performance Highlights With Product Share Ppt File Information PDF
This graph or chart is linked to excel, and changes automatically based on data. Just left click on it and select Edit Data. Pitch your topic with ease and precision using this Weekly Sales Performance Highlights With Product Share Ppt File Information PDF. This layout presents information on Dashboard Summary, Weekly Sale, Product Share. It is also available for immediate download and adjustment. So, changes can be made in the color, design, graphics or any other component to create a unique layout.

Annual Training Schedule Bar Chart For Business Ppt PowerPoint Presentation File Infographics PDF
This graph chart is linked to excel, and changes automatically based on data. Just left click on it and select Edit Data. Showcasing this set of slides titled annual training schedule bar chart for business ppt powerpoint presentation file infographics pdf. The topics addressed in these templates are trainings, employees, competent officers. All the content presented in this PPT design is completely editable. Download it and make adjustments in color, background, font etc. as per your unique business setting.
 Home
Home