Data Model
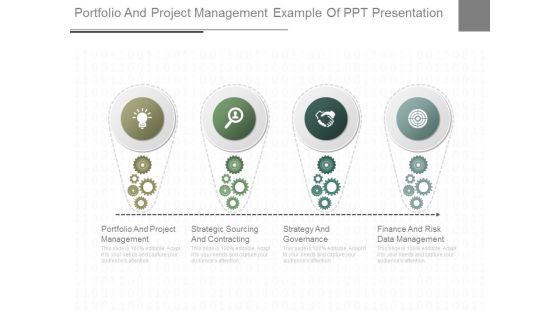
Portfolio And Project Management Example Of Ppt Presentation
This is a portfolio and project management example of ppt presentation. This is a four stage process. The stages in this process are portfolio and project management, strategic sourcing and contracting, strategy and governance, finance and risk data management.
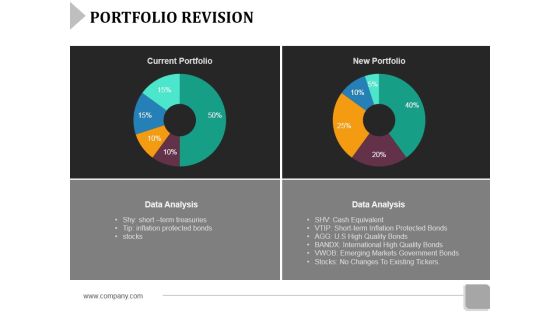
Portfolio Revision Ppt PowerPoint Presentation Gallery File Formats
This is a portfolio revision ppt powerpoint presentation gallery file formats. This is a two stage process. The stages in this process are current portfolio, new portfolio, data analysis.

Key Elements Of Effective Ip Portfolio Management Powerpoint Ideas
This is a key elements of effective ip portfolio management powerpoint ideas. This is a three stage process. The stages in this process are communication, continuous improvement, ip analysis, ip database system, ip data mining.
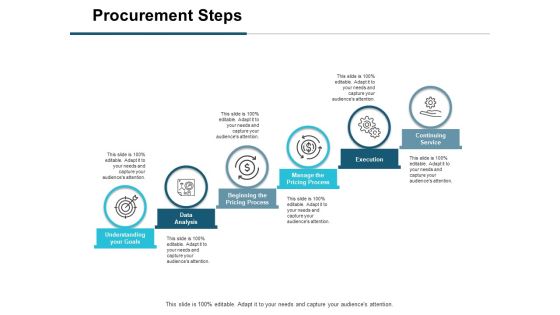
Procurement Steps Ppt PowerPoint Presentation Visual Aids Portfolio
This is a procurement steps ppt powerpoint presentation visual aids portfolio. This is a six stage process. The stages in this process are understanding your goals, data analysis, beginning pricing process, manage pricing process, execution.
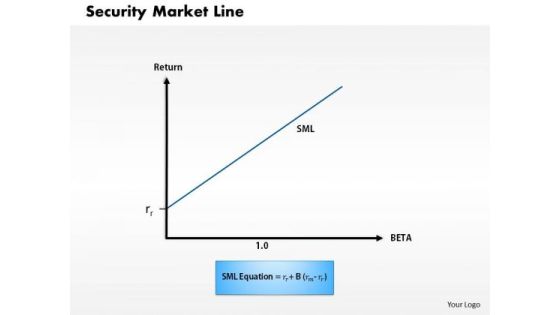
Business Framework Security Market Line 1 PowerPoint Presentation
This diagram displays graph of security market line. You can use line graph to plot changes in data over time, such as monthly revenue and earnings changes or daily changes in stock market prices.

Business Framework Security Market Line 11 PowerPoint Presentation
This diagram displays graph of security market line. You can use line graph to plot changes in data over time, such as monthly revenue and earnings changes or daily changes in stock market prices.
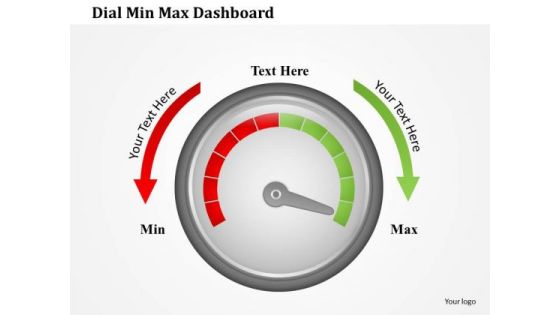
Business Framework Dial Min Max Dashboard PowerPoint Presentation
This professional power point template slide has been crafted with graphic of two funnels. These funnels are used to show any data calculation or process flow. Use this PPT for your business presentation and become a professional presenter.
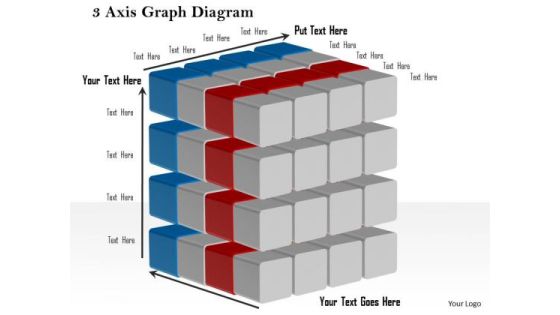
Business Framework 3 Axis Graph Diagram PowerPoint Presentation
This business diagram displays 3 axis graphs with cubes. This editable slide contains the concept of business and success. Use this diagram in your business presentations to display data in graphical manner.

Business Framework Battery Charge Loading Bar PowerPoint Presentation
This business diagram displays bar graph of five battery cells. This business slide contains the concept of business growth shown in multiple levels. Use this diagram to present and compare data in an impressive manner.
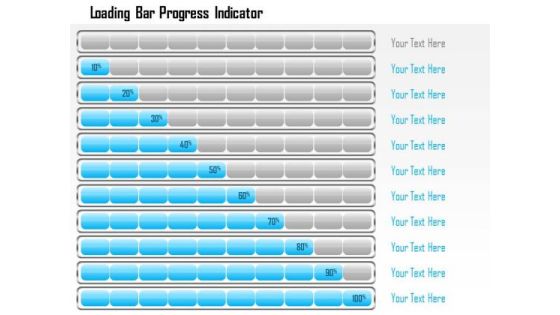
Business Framework Loading Bar Progress Indicator PowerPoint Presentation
This business diagram displays bar progress indicators. This business slide contains the concept of business growth shown in multiple levels. Use this diagram to present and compare data in an impressive manner.

Business Layer Presentation Background Images
This is a business layer presentation background images. This is a four stage process. The stages in this process are information technology infrastructure layer, data and information layer, software application layer, business layer.

why six sigma template 1 ppt powerpoint presentation portfolio format
This is a why six sigma template 1 ppt powerpoint presentation portfolio format. This is a six stage process. The stages in this process are bottom line, trained individuals, data driven approach, customer focused, project by project, engagement.

Cost Optimization Techniques Ppt PowerPoint Presentation Portfolio Professional
This is a cost optimization techniques ppt powerpoint presentation portfolio professional. This is a four stage process. The stages in this process are cost optimization techniques, improving data management, supply chain optimization, process automation, customer self service.

Consumer Insight Characteristics Ppt PowerPoint Presentation Portfolio Slideshow
This is a consumer insight characteristics ppt powerpoint presentation portfolio slideshow. This is a two stage process. The stages in this process are data synthesis, independence, integrated planning, collaboration, business focus.

Development Guide For 5G World Discover Unique Features Latency And Speed With 5G Sample PDF
This slide provides details regarding unique features of 5G in terms of reduced latency and high data throughput data speed with 5G for better customer experience. There are so many reasons you need a Development Guide For 5G World Discover Unique Features Latency And Speed With 5G Sample PDF. The first reason is you can not spend time making everything from scratch, Thus, Slidegeeks has made presentation templates for you too. You can easily download these templates from our website easily.
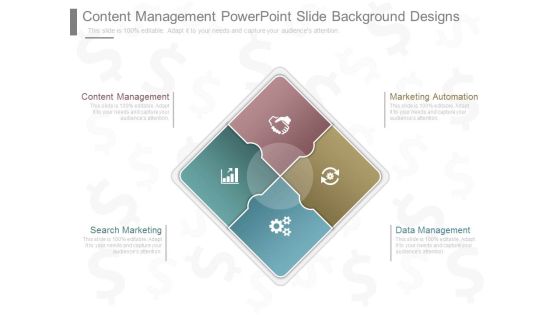
Content Management Powerpoint Slide Background Designs
This is a content management powerpoint slide background designs. This is a four stage process. The stages in this process are marketing automation, data management, content management, search marketing.

Competitive Analysis Scatter Chart Radar Chart Ppt PowerPoint Presentation Portfolio Templates
This is a competitive analysis scatter chart radar chart ppt powerpoint presentation portfolio templates. This is a eight stage process. The stages in this process are users interface, data import, example, pricing, support.
Coalescer Section Powerpoint Slides Design
This is a coalescer section powerpoint slides design. This is a six stage process. The stages in this process are data flow diagram, compressed air, coalescer section, fresh caustic prewash, jet fuel feed, spent caustic drain.

Busines Diagram Four Bulb Design For Text Representation Presentation Template
Four bulb design text diagram has been used to design this business slide. Use this diagram to display data in visual manner. This slide offers an excellent background to build professional presentations.

Challenges In Adoption Of Artificial Intelligence Ppt PowerPoint Presentation Portfolio Infographics
This is a challenges in adoption of artificial intelligence ppt powerpoint presentation portfolio infographics. This is a six stage process. The stages in this process are enabling data ecosystem, Inadequate availability, expertise, technology, research.
Five Business Options Representation With Icons Ppt Powerpoint Presentation Portfolio Aids
This is a five business options representation with icons ppt powerpoint presentation portfolio aids. This is a five stage process. The stages in this process are data presentation, content presentation, information presentation.
Histogram With Dollar For Financial Success Vector Icon Ppt PowerPoint Presentation Portfolio Example File Cpb
This is a histogram with dollar for financial success vector icon ppt powerpoint presentation portfolio example file cpb. This is a three stage process. The stages in this process are bar chart icon, bar graph icon, data chart icon.
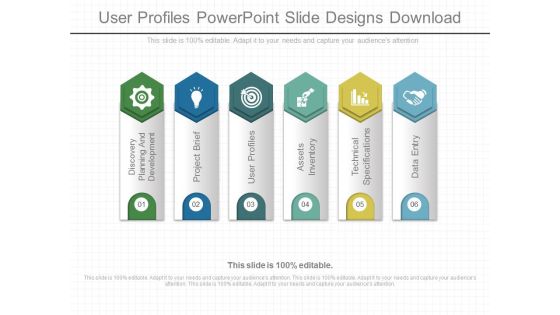
User Profiles Powerpoint Slide Designs Download
This is a user profiles powerpoint slide designs download. This is a six stage process. The stages in this process are discovery planning and development, project brief, user profiles, assets inventory, technical specifications, data entry.

Email Survey Service Diagram Ppt Slide Design
This is a email survey service diagram ppt slide design. This is a four stage process. The stages in this process are design, administration, data collection, report and analysis.
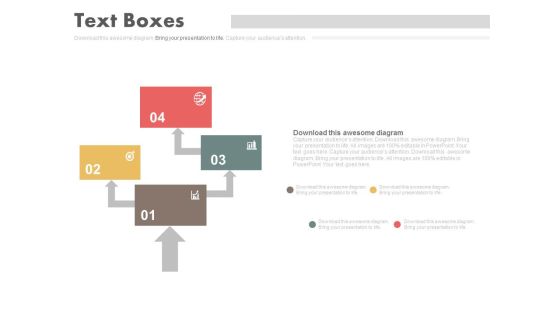
Four Steps Arrow Chart Design Powerpoint Slides
This PowerPoint template has been designed with four steps arrow chart. This PPT slide can be used to prepare presentations for marketing reports and also for financial data analysis. You can download finance PowerPoint template to prepare awesome presentations.

Marketing Automation Powerpoint Slide Design Templates
This is a marketing automation powerpoint slide design templates. This is a four stage process. The stages in this process are content management, marketing automation, data management, search marketing.

Right Portal Strategy Example Powerpoint Slides Design
This is a right portal strategy example powerpoint slides design. This is a eight stage process. The stages in this process are sites, communities, composites, search, data base, insight, content, infrastructure.

PowerPoint Design Gear Process Company Ppt Template
PowerPoint Design Gear Process Company PPT Template-This PowerPoint diagram shows three gears that represent three processes. You can add data depending on the number of processes you want to include in your presentation.-PowerPoint Design Gear Process Company PPT Template

Colorful Circle Arrow Design Powerpoint Template
Our above PPT slide contains circular arrow design. This business diagram helps to exhibit process flow. Use this diagram to impart more clarity to data and to create more sound impact on viewers.
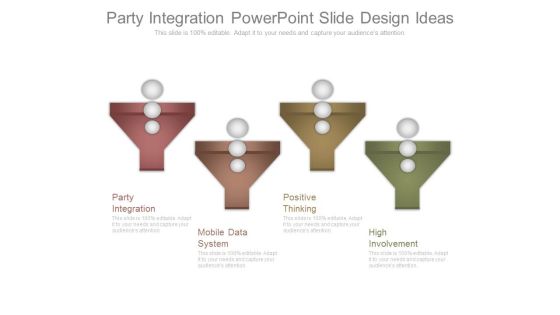
Party Integration Powerpoint Slide Design Ideas
This is a party integration powerpoint slide design ideas. This is a four stage process. The stages in this process are party integration, mobile data system, positive thinking, high involvement.

Positive Thinking Powerpoint Slide Designs Download
This is a positive thinking powerpoint slide designs download. This is a four stage process. The stages in this process are party integration, positive thinking, mobile data system, high involvement.

Architect Design And Solutions Diagram Powerpoint Slides
This is a architect design and solutions diagram powerpoint slides. This is a six stage process. The stages in this process are data safety, efficiently, speed, reliability, convenience, security.
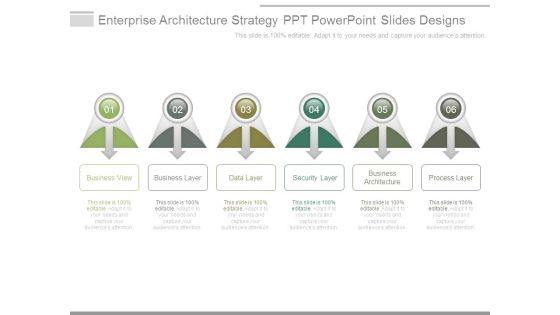
Enterprise Architecture Strategy Ppt Powerpoint Slides Designs
This is a enterprise architecture strategy ppt powerpoint slides designs. This is a six stage process. The stages in this process are business view, business layer, data layer, security layer, business architecture, process layer.

Business Interrelationship Graphic Design Powerpoint Presentation Examples
This is a business interrelationship graphic design powerpoint presentation examples. This is a six stage process. The stages in this process are data integration, performance management, sales, accounting, assemble product, decision support systems.
Recruit Business Analyst Diagram Slide Design Templates
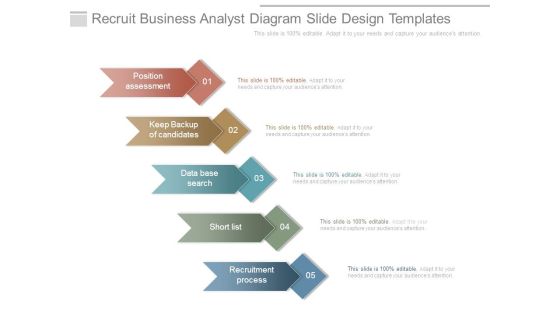
This is a recruit business analyst diagram slide design templates. This is a five stage process. The stages in this process are position assessment, keep backup of candidates, data base search, short list, recruitment process.

Cloud Computing Diagram Powerpoint Slide Designs
This is a cloud computing diagram powerpoint slide designs. This is a six stage process. The stages in this process are platform, online storage, outsource processes, data base, network, laptop.

Process Of Web Security Testing And Analysis Ppt Design
This is a process of web security testing and analysis ppt design. This is a six stage process. The stages in this process are error handing, controlled access, session management, network security, server and code management, data access.

Channel And Market Intelligence Example Powerpoint Slide Designs
This is a channel and market intelligence example powerpoint slide designs. This is a five stage process. The stages in this process are channel identification, market and data analysis, field audits, trade interviews, strategy development.

Financial Services Crm Presentation Visual Aids
This is a financial services crm presentation visual aids. This is a five stage process. The stages in this process are account aggregation, financial planning, crm, data input tools, document management, portfolio accounting, custodian, trading rebalancing, portfolio analytics reporting.
Integrated Technology Solutions Diagram Powerpoint Shapes
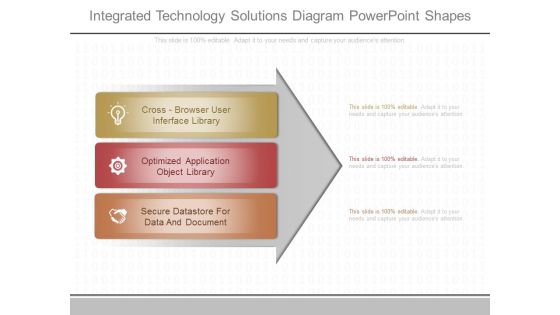
This is a integrated technology solutions diagram powerpoint shapes. This is a three stage process. The stages in this process are cross browser user interface library, optimized application object library, secure datastore for data and document.
Business Diagram About Us Web Page Design Presentation Template
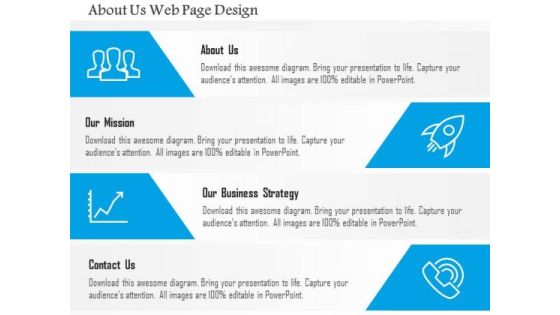
This power point template diagram has been designed with graphic of four icons. This PPT can represent the concept of building about us. This PPT is suitable for business and data related presentations.
Important Elements For Business Success Design Ppt Sample Presentations
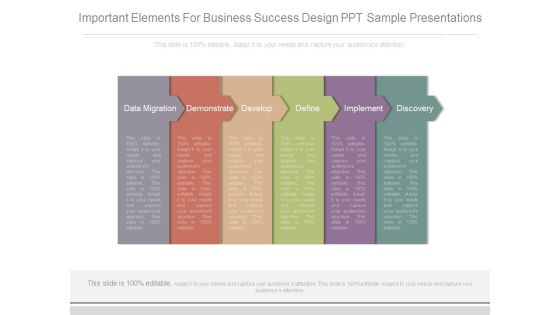
This is a important elements for business success design ppt sample presentations. This is a six stage process. The stages in this process are data migration, demonstrate, develop, define, implement, discovery.
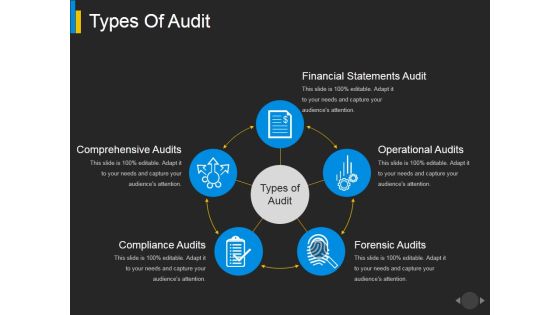
Types Of Audit Ppt PowerPoint Presentation Inspiration Background Designs
This is a types of audit ppt powerpoint presentation inspiration background designs. This is a three stage process. The stages in this process are data selection, reliability validation, relevance confirmation.

Quality Control Check Sheet Ppt PowerPoint Presentation Layouts Designs
This is a quality control check sheet ppt powerpoint presentation layouts designs. This is a nine stage process. The stages in this process are location, data collection date, defect type event occurrence, dates.
Functional Areas Overview Ppt PowerPoint Presentation Icon Design Inspiration
This is a functional areas overview ppt powerpoint presentation icon design inspiration. This is a nine stage process. The stages in this process are master data management, human resources, research and development, controlling, marketing and sales.

Competency Matrix To Identify Goals For Employees Improvement Template Pdf
This slide covers matrix which can be used to identify the goals for employees improvement based on communication, data analysis, project management, leadership, etc. Deliver and pitch your topic in the best possible manner with this competency matrix to identify goals for employees improvement template pdf. Use them to share invaluable insights on project management, customer, service, data analysis, communication and impress your audience. This template can be altered and modified as per your expectations. So, grab it now.
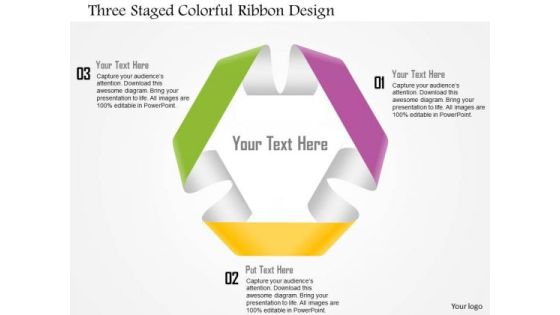
Business Diagram Three Staged Colorful Ribbon Design Presentation Template
This business diagram displays three staged circular ribbon. This Power Point slide can be used for data representation. Use this PPT slide to show flow of activities in circular manner. Get professional with this exclusive business slide.

Business Diagram Responsive Design Over Several Hand Held Devices Ppt Slide
This image slide has been designed with graphic of phone and cloud icons. These icons are used to display the concept of networking and data storage. Use this slide to present network and technology related topics in any presentations.
1 Printed Circuit Board Pcb With Cpu Chip Icon For Chip Design Eda Ppt Slides
Above diagram is perfect to give presentations on data processors, microprocessor, and integrated circuits. This diagram has graphics of Printed Circuit Board PCB CPU chip icon. This diagram is best to give presentations on electronic systems.
E Business Architecture Planning Example Powerpoint Templates
This is a e business architecture planning example powerpoint templates. This is a four stage process. The stages in this process are technology architecture, data architecture, business architecture, application architecture.

Business Diagram Four Thermometer For Entrepreneurship Statistics Presentation Template
Graphic of thermometers have been used to design this business diagram. Thermometers can be used to display entrepreneurship statistics. Use this diagram your data and information related topics in any presentation.
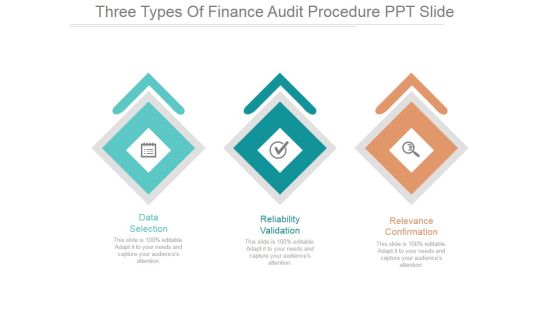
Three Types Of Finance Audit Procedure Ppt PowerPoint Presentation Designs Download
This is a three types of finance audit procedure ppt powerpoint presentation designs download. This is a three stage process. The stages in this process are data selection, reliability validation, relevance confirmation.
Growing Arrow On Bar Graph Vector Icon Ppt PowerPoint Presentation Designs Cpb
This is a growing arrow on bar graph vector icon ppt powerpoint presentation designs cpb . This is a three stage process. The stages in this process are bar chart icon, bar graph icon, data chart icon.

Architecture Change Management Ppt Sample
This is a architecture change management ppt sample. This is a four stage process. The stages in this process are architecture change management, business solution, solution and application architecture, data architecture.
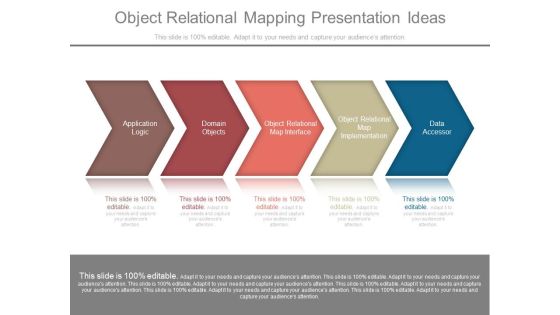
Object Relational Mapping Presentation Ideas
This is a object relational mapping presentation ideas. This is a five stage process. The stages in this process are application logic, domain objects, object relational map interface, object relational map implementation, data accessor.
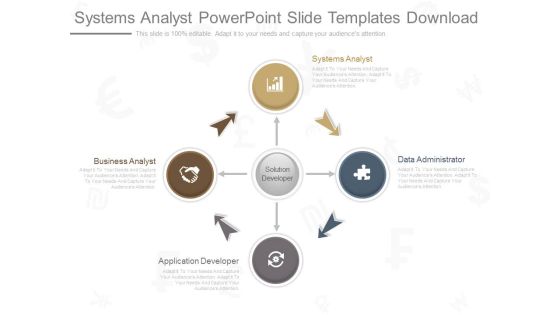
Systems Analyst Powerpoint Slide Templates Download
This is a systems analyst powerpoint slide templates download. This is a four stage process. The stages in this process are solution developer, business analyst, application developer, data administrator, systems analyst.

It Infrastructures Development Example Powerpoint Slides
This is a it infrastructures development example powerpoint slides. This is a five stage process. The stages in this process are application and desktop delivery, network infrastructure, data center management, storage, it security, virtualization.
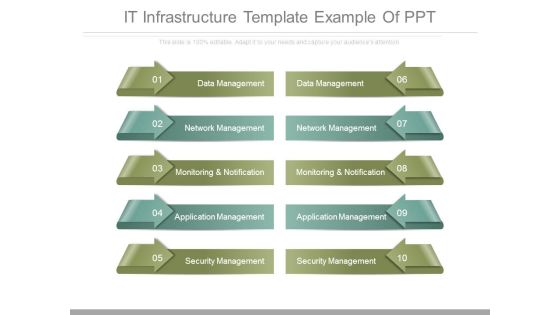
It Infrastructure Template Example Of Ppt
This is a it infrastructure template example of ppt. This is a ten stage process. The stages in this process are data management, network management, monitoring and notification, application management, security management.

Analytics Solutions Diagram Sample Of Ppt Presentation
This is a analytics solutions diagram sample of ppt presentation. This is a four stage process. The stages in this process are analytic applications, analytics, data sources, business intelligence.
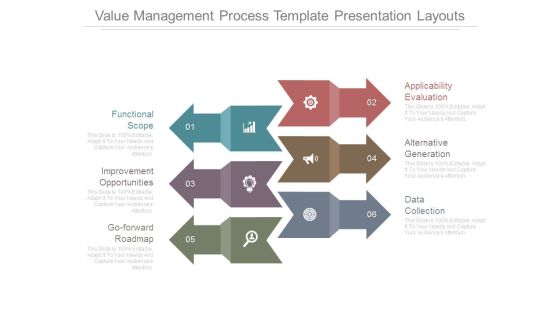
Value Management Process Template Presentation Layouts
This is a value management process template presentation layouts. This is a six stage process. The stages in this process are functional scope, improvement opportunities, go forward roadmap, applicability evaluation, alternative generation, data collection.
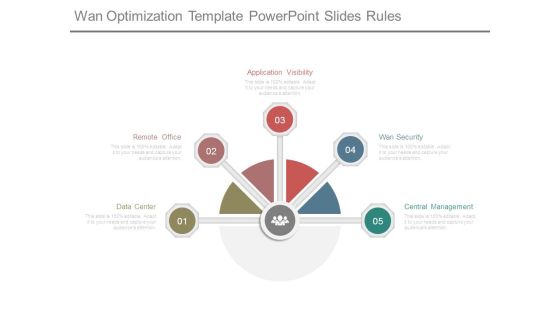
Wan Optimization Template Powerpoint Slides Rules
This is a wan optimization template powerpoint slides rules. This is a five stage process. The stages in this process are data center, remote office, application visibility, wan security, central management.
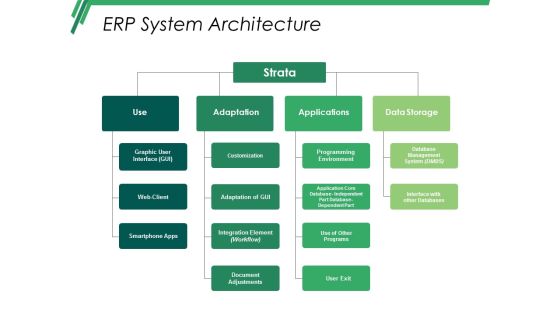
Erp System Architecture Ppt PowerPoint Presentation Pictures Master Slide
This is a erp system architecture ppt powerpoint presentation pictures master slide. This is a four stage process. The stages in this process are use, strata, adaptation, applications, data storage.
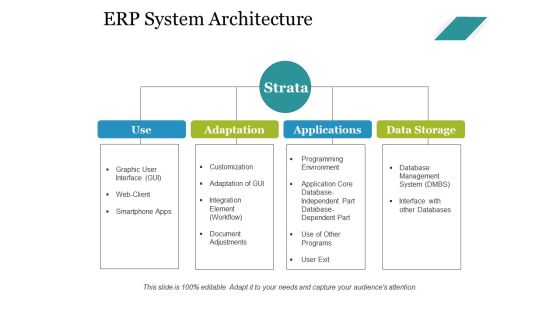
Erp System Architecture Ppt PowerPoint Presentation Infographic Template Tips
This is a erp system architecture ppt powerpoint presentation infographic template tips. This is a four stage process. The stages in this process are use, adaptation, applications, data storage, strata.
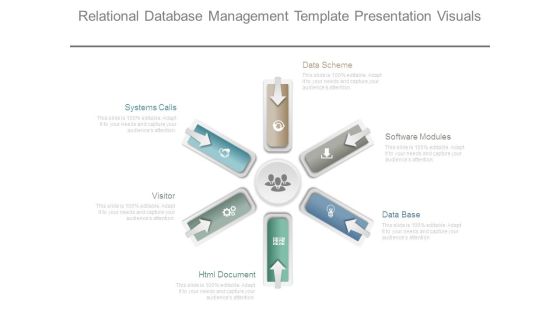
Relational Database Management Template Presentation Visuals
This is a relational database management template presentation visuals. This is a six stage process. The stages in this process are systems calls, visitor, html document, database, software modules, data scheme.

Automation Marketing Service Diagram Presentation Visual Aids
This is a automation marketing service diagram presentation visual aids. This is a four stage process. The stages in this process are data archiving, academic software, customer, new business.

Business Diagram Three Paper Clips For Text Representation Presentation Template
Three paper clips are used to design this power point template slide. This PPT slide has been crafted for data representation techniques. Use this PPT slide for your business and marketing related presentations.

Business Diagram Four Colored Tablets With Text Boxes Presentation Template
Graphic of four colored tablets has been used to design this power point template diagram. This PPT diagram contains the concept of data and text representation. Use this PPT for marketing and business related presentations.

Business Diagram Four Balloons With Text Boxes PowerPoint Template
Graphic of four balloons style text box diagram has been used to design this power point template slide. This PPT slide contains the concept of business data flow. Use this PPT for your business and marketing related presentations.
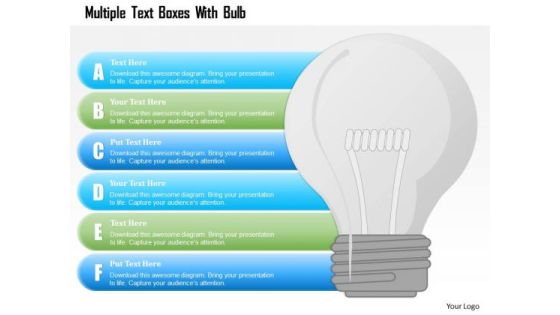
Busines Diagram Multiple Text Boxes With Bulb Presentation Template
This business diagram has been designed with graphic of multiple text boxes and bulb. This slide can be used for data representation and idea generation. Use this slide for your business and technology related presentations.

Four Horizontal Text Banners Powerpoint Template
This PowerPoint template has been designed with four horizontal text banners. This diagram is excellent visual tools for business presentations. Download this PPT slide to explain complex data immediately and clearly.
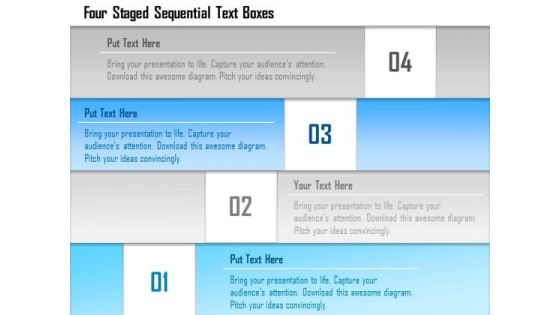
Business Diagram Four Staged Sequential Text Boxes Presentation Template
Four staged sequential stair designed text boxes are used to design this power point template. This PPT contains the concept of data flow. Use this PPT for your business and finance related presentations.
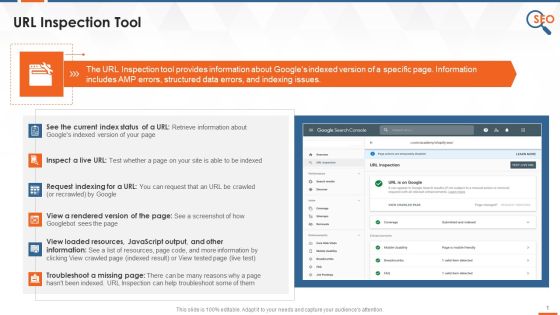
Understanding Url Inspection Tool In Google Search Console Training Ppt
This slide covers details on URL Inspection tool. It also includes information about Googles indexed version of a specific page. The Information includes AMP errors, structured data errors, and indexing issues.
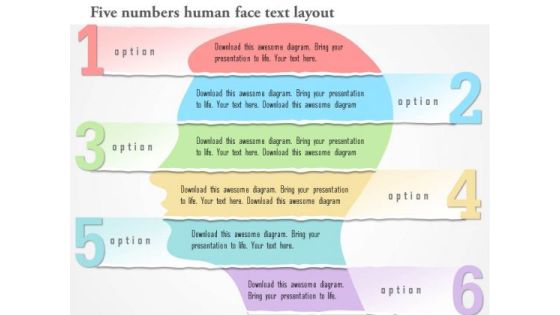
Business Diagram Six Numbers Human Face Text Layout Presentation Template
Graphic of six numeric tags and human face has been used to design this business diagram. Download our above diagram to express information in a visual way. Use this diagram and get good comments for data related presentations.

Business Diagram Four Staged Semicircular Text Box Diagram PowerPoint Template
Four staged semicircular text boxes diagram has been used to design this power point template. This diagram template contains the concept of data and process flow. Use this PPT for your business and marketing related presentations.
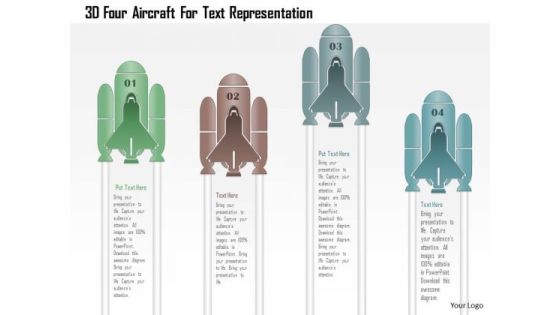
Business Diagram 3d Four Aircraft For Text Representation PowerPoint Template
Graphic of 3d four aircraft text boxes has been used to design this power point template. This PPT slide contains the concept of data flow. Use this PPT slide for business and sales related presentations.

Business Diagram Three Colored Text Boxes Representation PowerPoint Template
Three colored text boxes diagram has been used to design this power point template. This PPT contains the concept of process based data representation. This PPT is suitable for business and sales related presentations.
Four Sequential Text Banners With Icons Powerpoint Template
This PowerPoint template has been designed with four sequential text banners and icons. This diagram is excellent visual tools for business presentations. Download this PPT slide to explain complex data immediately and clearly.
Four Colored Text Boxes With Icons Powerpoint Slides
This PowerPoint template has been designed with graphics of four text boxes. Download this PPT slide to display percentage data display. Use this professional template to build an exclusive presentation.

Business Diagram Six Staged Ribbon Style Text Boxes Presentation Template
Graphic of four staged diagram has been used to design this power point template slide. This PPT slide contains the data flow. This PPT slide can be used for business and marketing related presentations.

Business Diagram Three Darts For Text Representation Presentation Template
Graphic of three darts has been used to design this power point template. This PPT contains the concept of data representation. Use this PPT and build an exclusive presentation for your viewers.
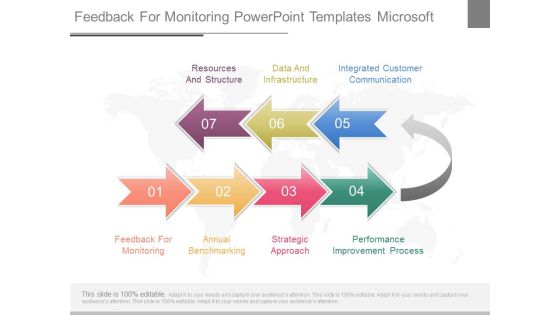
Feedback For Monitoring Powerpoint Templates Microsoft
This is a feedback for monitoring powerpoint templates microsoft. This is a seven stage process. The stages in this process are resources and structure, data and infrastructure, integrated customer communication, feedback for monitoring, annual benchmarking, strategic approach, performance improvement process.\n\n\n

Different Types Of Sales Culture Ppt Powerpoint Templates
This is a different types of sales culture ppt powerpoint templates. This is a two stage process. The stages in this process are incentives, performance management, structure size and alignment, data tools, hiring and training.

Sitemaps As The Navigator For Your Website Training Ppt
This slide covers details on XML sitemaps. It also depicts that a XML sitemap is a method of structuring a website by identifying the URLs and data inside each component.
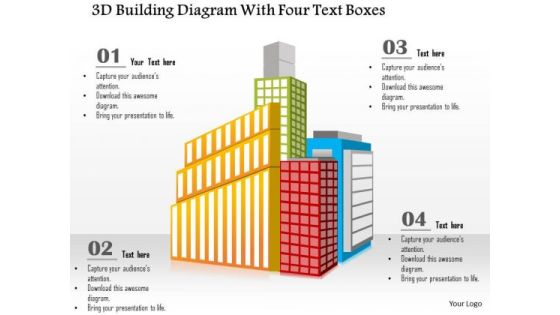
Busines Diagram 3d Building Diagram With Four Text Boxes Presentation Template
This business diagram has been designed with graphic of 3d building diagram and four text boxes. This business slide is useful for data representation. Use this diagram to make professional presentations.

Business Diagram Four Staged Road Sign Diagram For Text Representation Presentation Template
Four staged road sign diagram has been used to design this power point template. This PPT contains the concept of text and data representation. Use this PPT and build quality presentation for your viewers.

Pyramid For Financial Accounting Information Powerpoint Slides
This PowerPoint template has been designed with graphics of pyramid chart. This PPT slide can be used to prepare presentations for profit growth report and also for financial data analysis. You can download finance PowerPoint template to prepare awesome presentations.

Biomarker Categorization Management Of Digital Biomarkers Information Pictures PDF
This slide represents the digital biomarkers data management architecture, and its components include raw information from assays, data parsing, metadata, biomarker data, metadata cataloguing and harmonization, clinical data pipeline, and so on. Explore a selection of the finest Biomarker Categorization Management Of Digital Biomarkers Information Pictures PDF here. With a plethora of professionally designed and pre made slide templates, you can quickly and easily find the right one for your upcoming presentation. You can use our Biomarker Categorization Management Of Digital Biomarkers Information Pictures PDF to effectively convey your message to a wider audience. Slidegeeks has done a lot of research before preparing these presentation templates. The content can be personalized and the slides are highly editable. Grab templates today from Slidegeeks.

Digital Resilience Biomarker Technologies IT Management Of Digital Biomarkers Information Ideas PDF
This slide represents the digital biomarkers data management architecture, and its components include raw information from assays, data parsing, metadata, biomarker data, metadata cataloguing and harmonization, clinical data pipeline, and so on. Get a simple yet stunning designed Digital Resilience Biomarker Technologies IT Management Of Digital Biomarkers Information Ideas PDF. It is the best one to establish the tone in your meetings. It is an excellent way to make your presentations highly effective. So, download this PPT today from Slidegeeks and see the positive impacts. Our easy to edit Digital Resilience Biomarker Technologies IT Management Of Digital Biomarkers Information Ideas PDF can be your go to option for all upcoming conferences and meetings. So, what are you waiting for Grab this template today.
Business Diagram Navigation Icon Around Circle Presentation Template
Five staged business info graphics been used to design this power point template. This diagram contains the concept of data representation. Use this diagram for business and finance related presentations

Cloud With Lock For Cloud Technology Powerpoint Template
This PowerPoint template contains graphics of cloud with lock. This PPT slide helps to portray concepts of cloud computing and data protection. Use this technology template design to illustrate your ability.
Five Banners With Communication And Technology Icons Powerpoint Template
This PowerPoint template has been designed with five banners and communication technology icons. This diagram is excellent visual tools for business presentations. Download this PPT slide to explain complex data immediately and clearly.
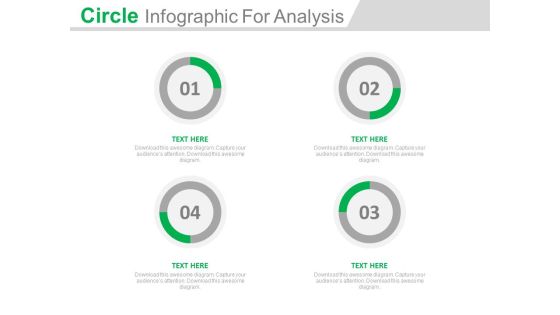
Four Circle Steps For Process Analysis Powerpoint Slides
This innovative, stunningly beautiful dashboard has been designed for data visualization. It contains four circles steps for process analysis. This PowerPoint template helps to display your information in a useful, simple and orderly way.

Datafy Phases Of Datafication As A Use Perspective Ideas PDF
This slide represents the phases of datafication from a use perspective and the stages include domain, data generation, analyzing data and generating output, and data-driven interventions. Each phase includes four steps, such as step counter, webshop, Schiphol-asito, and predictive policing. The Datafy Phases Of Datafication As A Use Perspective Ideas PDF is a compilation of the most recent design trends as a series of slides. It is suitable for any subject or industry presentation, containing attractive visuals and photo spots for businesses to clearly express their messages. This template contains a variety of slides for the user to input data, such as structures to contrast two elements, bullet points, and slides for written information. Slidegeeks is prepared to create an impression.

Concept Of Ontology In The Semantic Web Timeline For Semantic Web Deployment Topics PDF
This slide represents the timeline for semantic web deployment and development, including the steps to be performed at each months interval. The steps include discovering data, integrating data with meaningful labels, validating, and exploring methods for data transformation. The Concept Of Ontology In The Semantic Web Timeline For Semantic Web Deployment Topics PDF is a compilation of the most recent design trends as a series of slides. It is suitable for any subject or industry presentation, containing attractive visuals and photo spots for businesses to clearly express their messages. This template contains a variety of slides for the user to input data, such as structures to contrast two elements, bullet points, and slides for written information. Slidegeeks is prepared to create an impression.
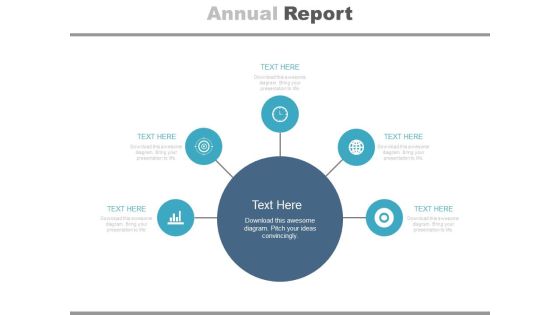
Diagram For Market Research Analysis Powerpoint Slides
This PowerPoint template has been designed with circular infographic diagram. It can be used to display steps for market research and also for financial data analysis. You can download finance PowerPoint template to prepare awesome presentations.

Pie Charts For Financial Ratio Analysis Powerpoint Slides
This PowerPoint template has been designed with diagram of pie charts. This PPT slide can be used to prepare presentations for profit growth report and also for financial data analysis. You can download finance PowerPoint template to prepare awesome presentations.

Battery Icons For Business Growth Levels Powerpoint Template
Levels of business growth can be displayed with this diagram. This PowerPoint template contains graphics of seven battery icons. You can use this design for data analysis in business presentations
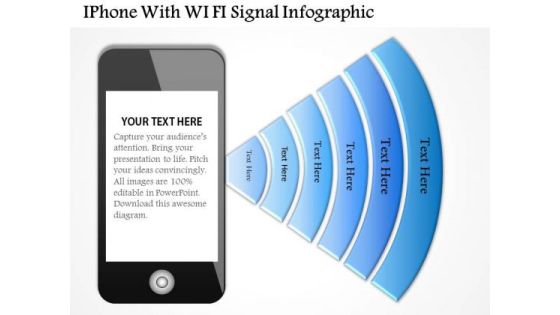
Business Diagram Iphone With Wi Fi Signal Infographic Presentation Template
This business diagram has been designed with graphic of iphone and wi-fi symbol. This diagram template contains the concept of data communication and technology. Use this diagram template for your business and technology related presentations.

Stock Photo Blue Cloud With Code Lock PowerPoint Slide
Graphic of blue cloud and code lock has been used to design this PPT. This PPT contains the concept data safety on cloud technology. Use this image template for your cloud technology related presentation.

Cloud Computing Wifi Safety Upload Social Network Ppt Slides Graphics
This power point icon template has been designed with graphic of cloud computing, wifi and social network. These icons can be used for data upload safety features and social networking. Use these icons for social network and technology related presentations.

Business Diagram Three Different Pie Charts For Result Analysis Presentation Template
Three different pie charts are used to designed this power point template slide. This PPT slide contains the concept of result analysis. Use this PPT slide for your data and process related presentations.
Business Diagram Loudspeaker With Icons Dialogue Box Presentation Template
Graphic of loudspeaker and icons of dialogue box has been used to design this business diagram. This diagram contains the concept of business information communication. Use this diagram for data communication related presentation.
Business Diagram Loudspeaker With Web Icons Dialogue Box Presentation Template
Graphics of loudspeaker and icons of web with dialogue box have been used to design this business diagram. This diagram contains the concept of business information communication. Use this diagram for data communication related presentation.

Stock Photo 3d Laptops Graphic Connected With Server PowerPoint Slide
Graphic of 3d laptop and servers has been used to design this power point template. This image template contains the concept of data transfer with networking. This image template can be used to show the networking related presentations.

Flower Diagram For Educational Training Powerpoint Template
Colorful flowers have been used to design this PowerPoint diagram. This colorful PPT slide may be used for educational training. You can use this design for data analysis in business presentations

Traditional Assessment Template Ppt Examples
This is a traditional assessment template ppt examples. This is a six stage process. The stages in this process are analysis, requirement specification, design, testing and integration, operation and maintenance, data design.
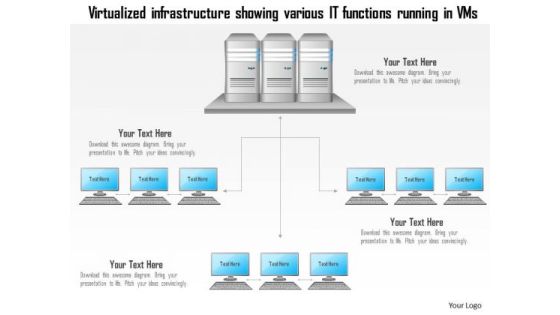
Business Diagram Virtualized Infrastructure Showing Various It Functions Running In Vms Ppt Slide
Graphic of data base server and VMS has been used to design this technology diagram. This slide contains the virtualized infrastructure for various functions. Use this diagram for technology related presentations.

Business Diagram Geographically Distributed Public Cloud Connected To Cities Around World Map Ppt Sl
This technology diagram has been designed with graphic of world map and cloud. In this diagram, cloud is connected to the multiple cities around the world. Use this diagram slide for your data distribution related topics in any presentation.
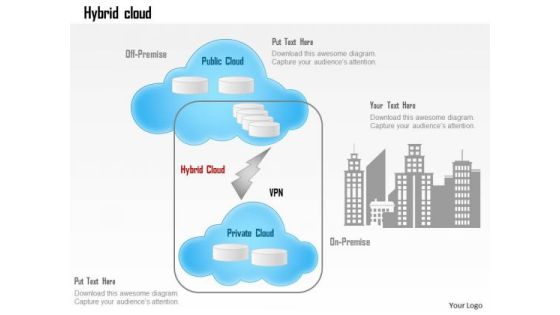
Business Diagram Hybrid Cloud Off Premise Public Cloud Office Connectivity Ppt Slide
This technology diagram slide has been designed with graphic of hybrids cloud. This diagram displays the connectivity of cloud in private and public premise. Use this graphics for your data transfer related presentations.
Stock Photo Graphics Of Laptop With Cloud Icon Pwerpoint Slide
This image has been designed with graphic of laptop and cloud icon. This image shows the concept of cloud computing and data communication. Build a presentation for cloud computing and networking related presentations.
Stock Photo Laptop With Blue Cloud Icon Pwerpoint Slide
This image has been designed with graphic of laptop and blue colored cloud icon. This image shows the concept of cloud computing and data communication. Build a presentation for cloud computing and networking related presentations.
Stock Photo Red Upload Arrow On Blue Cloud Icon PowerPoint Slide
This technical image slide has been designed with graphic of red upload arrow on cloud. This image slide explains the concept of data upload techniques with in the cloud service. Use this image slide for cloud computing related presentations.
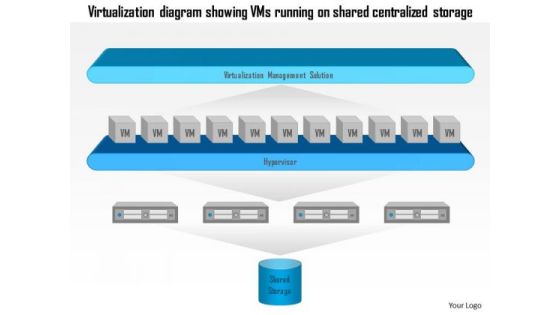
Business Diagram Virtualization Diagram Showing Vms Running On Shared Centralized Storage Ppt Slide
This diagram has been designed with graphic of virtualization diagram. This diagram is representing the VMS running on shared and centralized storage. This diagram may be used for data storage related presentations.

1 Weekly Schedule Of Tape Backup Showing Timeline Of Retention Dates And Times Ppt Slides
This Powerpoint image slide has been designed with graphic of magnetic tapes. These tapes are used to take data backups and to create records. This PPT slide may be used to display weekly schedule of tape backup with timeline representation.
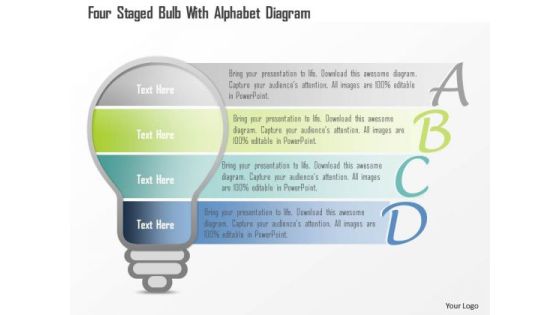
Business Diagram Four Staged Bulb With Alphabet Diagram PowerPoint Template
Four staged bulb with alphabet diagram has been used to design this power point template. This PPT diagram contains the concept of educational data representation. Use this PPT and build an exclusive presentation for education related topics.
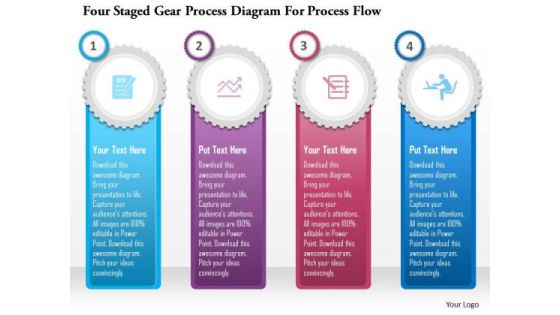
Business Diagram Four Staged Gear Process Diagram For Process Flow Presentation Template
Graphic of four staged gear process diagram has been used to design this power point template diagram. This PPT diagram contains the concept of data and process flow. Use this PPT for marketing and sales related presentations.

Circular Diagram Of Cfl Bulbs Powerpoint Templates
This PowerPoint template has been designed with circular diagram of CFL bulbs. It helps to exhibit business strategies and ideas. Use this diagram to impart more clarity to data and to create more sound impact on viewers.

Four Steps Circular Infographic Powerpoint Slides
This innovative, stunningly beautiful dashboard has been designed for data visualization. It contains circular infographic design. This PowerPoint template helps to display your information in a useful, simple and orderly way.
Business Diagram Three Arrows With Human Icons Presentation Template
This power point template diagram has been designed with graphic of three arrows. This PPT contains the concept of text representation. Use this PPT for business and marketing data related presentations.

Business Diagram Colorful Boxes For Business Options Presentation Template
Graphics of colorful text boxes have been used to design this power point template. This diagram contains the concept of data representation. Illustrate your ideas and imprint them in the minds of your team with this template.
 Home
Home