Data Mapping

Colorful Circle Arrow Design Powerpoint Template
Our above PPT slide contains circular arrow design. This business diagram helps to exhibit process flow. Use this diagram to impart more clarity to data and to create more sound impact on viewers.

Colorful Circle Arrow Diagram Powerpoint Template
Our above PPT slide contains circular arrow design. This business diagram helps to exhibit process flow. Use this diagram to impart more clarity to data and to create more sound impact on viewers.

Colorful Circular Arrows Diagram Powerpoint Template
Our above PPT slide contains circular arrow design. This business diagram helps to exhibit process flow. Use this diagram to impart more clarity to data and to create more sound impact on viewers.

Diagram Of Colorful Circular Arrows Powerpoint Template
Our above PPT slide contains circular arrow design. This business diagram helps to exhibit process flow. Use this diagram to impart more clarity to data and to create more sound impact on viewers.

Manufacturing Operations Management Process Scada Intelligence Systems To Reduce Guidelines PDF
This slide represents SCADA Supervisory Control and Data Acquisition intelligence system. It includes details such as configuration, graphical user interface, management, and data filing. There are so many reasons you need a Manufacturing Operations Management Process Scada Intelligence Systems To Reduce Guidelines PDF. The first reason is you can not spend time making everything from scratch, Thus, Slidegeeks has made presentation templates for you too. You can easily download these templates from our website easily.

Deployment Of Smart Factory Solutions Cloud Computing Enabled Manufacturing Process Diagrams PDF
This slide represents cloud computing enabled manufacturing process. It highlights data analysis, data sharing, manufacturing resources etc. Deliver an awe inspiring pitch with this creative Deployment Of Smart Factory Solutions Cloud Computing Enabled Manufacturing Process Diagrams PDF bundle. Topics like Information Exchange, Cloud Computing, Cloud Manufacturing Services can be discussed with this completely editable template. It is available for immediate download depending on the needs and requirements of the user.

Challenges In Adoption Of Artificial Intelligence Ppt PowerPoint Presentation Portfolio Infographics
This is a challenges in adoption of artificial intelligence ppt powerpoint presentation portfolio infographics. This is a six stage process. The stages in this process are enabling data ecosystem, Inadequate availability, expertise, technology, research.
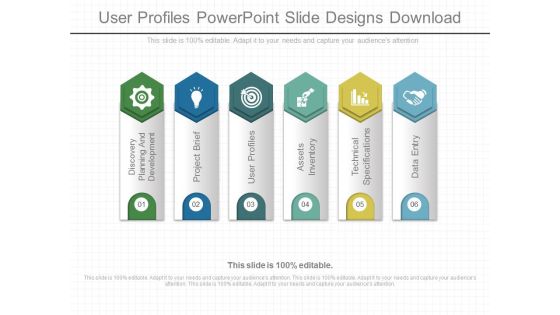
User Profiles Powerpoint Slide Designs Download
This is a user profiles powerpoint slide designs download. This is a six stage process. The stages in this process are discovery planning and development, project brief, user profiles, assets inventory, technical specifications, data entry.

Enterprise Systems Architecture Ppt Presentation Design
This is a enterprise systems architecture ppt presentation design. This is a four stage process. The stages in this process are business architecture, technical architecture, application architecture, data architecture.

API Management For Building Software Applications Monthly API Roadmap With The Development Process Ideas PDF
Presenting this set of slides with name api management for building software applications monthly api roadmap with the development process ideas pdf. This is a twelve stage process. The stages in this process are data structure, prototype building, data integration, license management, customer service support, desktop version launched, 2020. This is a completely editable PowerPoint presentation and is available for immediate download. Download now and impress your audience.

Facts Assessment Content Ppt PowerPoint Presentation Gallery Graphics Pictures PDF
Presenting this set of slides with name facts assessment content ppt powerpoint presentation gallery graphics pictures pdf. This is a seven stage process. The stages in this process are business intelligence market overview, architectural framework, data design, data integration design, bi design, advanced final output results, kpi metrics and dashboard. This is a completely editable PowerPoint presentation and is available for immediate download. Download now and impress your audience.

Solution Development Process SDLC Rapid Application Development RAD Model Portrait PDF
This slide depicts the rapid application development model, including its phases such as business modeling, data modeling, process modeling, application generation, and testing and turnover.Deliver an awe inspiring pitch with this creative Solution Development Process SDLC Rapid Application Development RAD Model Portrait PDF bundle. Topics like Business Modeling, Data Modeling, Process Modeling can be discussed with this completely editable template. It is available for immediate download depending on the needs and requirements of the user.
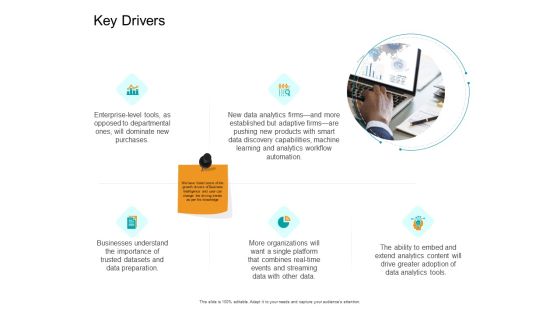
Facts Assessment Key Drivers Ppt PowerPoint Presentation Summary Pictures PDF
Presenting this set of slides with name facts assessment key drivers ppt powerpoint presentation summary pictures pdf. This is a five stage process. The stages in this process are enterprise level tools, data analytics firms, analytics workflow automation, machine learning, businesses understand, more organizations, real time events, data analytics tools. This is a completely editable PowerPoint presentation and is available for immediate download. Download now and impress your audience.
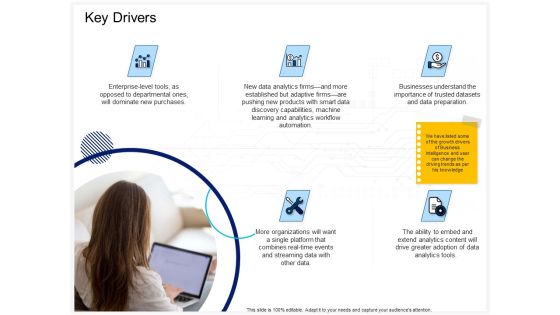
Enterprise Problem Solving And Intellect Key Drivers Ppt PowerPoint Presentation Ideas Influencers PDF
Presenting this set of slides with name enterprise problem solving and intellect key drivers ppt powerpoint presentation ideas influencers pdf. This is a five stage process. The stages in this process are enterprise level tools, data analytics firms, analytics workflow automation, machine learning, businesses understand, more organizations, real time events, data analytics tools. This is a completely editable PowerPoint presentation and is available for immediate download. Download now and impress your audience.

Firm Productivity Administration Key Drivers Ppt PowerPoint Presentation Show Elements PDF
Presenting this set of slides with name firm productivity administration key drivers ppt powerpoint presentation show elements pdf. This is a five stage process. The stages in this process are enterprise level tools, data analytics firms, analytics workflow automation, machine learning, businesses understand, more organizations, real time events, data analytics tools. This is a completely editable PowerPoint presentation and is available for immediate download. Download now and impress your audience.

Automating Supply Chain List Of Back Office Functions That Can Be Optimized Ideas PDF
This slide covers back-end processes that require automation. It includes areas such as accounts receivable, payable, employee onboarding, service desk, and employee data management. Deliver and pitch your topic in the best possible manner with this Automating Supply Chain List Of Back Office Functions That Can Be Optimized Ideas PDF. Use them to share invaluable insights on Finance Accounting, IT Service, Employee Data and impress your audience. This template can be altered and modified as per your expectations. So, grab it now.
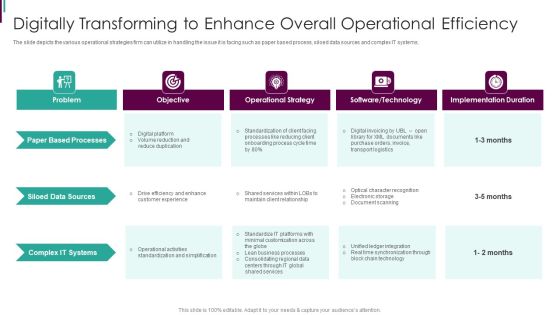
Developing Business Analytics Framework Digitally Transforming To Enhance Overall Guidelines PDF
The slide depicts the various operational strategies firm can utilize in handling the issue it is facing such as paper based process, siloed data sources and complex IT systems. Deliver an awe inspiring pitch with this creative Developing Business Analytics Framework Digitally Transforming To Enhance Overall Guidelines PDF bundle. Topics like Data Sources, Based Processes, Operational Strategy can be discussed with this completely editable template. It is available for immediate download depending on the needs and requirements of the user.

Enterprise Problem Solving And Intellect Content Ppt PowerPoint Presentation Styles Format Ideas PDF
Presenting this set of slides with name enterprise problem solving and intellect content ppt powerpoint presentation styles format ideas pdf. This is a seven stage process. The stages in this process are business intelligence market overview, architectural framework, data design, data integration design, bi design, advanced final output results, kpi metrics and dashboard. This is a completely editable PowerPoint presentation and is available for immediate download. Download now and impress your audience.

Firm Productivity Administration Content Ppt PowerPoint Presentation Visual Aids Summary PDF
Presenting this set of slides with name firm productivity administration content ppt powerpoint presentation visual aids summary pdf. This is a seven stage process. The stages in this process are business intelligence market overview, architectural framework, data design, data integration design, bi design, advanced final output results, kpi metrics and dashboard. This is a completely editable PowerPoint presentation and is available for immediate download. Download now and impress your audience.

5 Months Digital Migration Roadmap Icons PDF
This slide shows six months strategic timeline which can be used in migration of data. It includes stages such as plan, data preparation, migration design, execution, testing and maintenance. Presenting 5 Months Digital Migration Roadmap Icons PDF to dispense important information. This template comprises six stages. It also presents valuable insights into the topics including Plan, Migration Design, Testing. This is a completely customizable PowerPoint theme that can be put to use immediately. So, download it and address the topic impactfully.
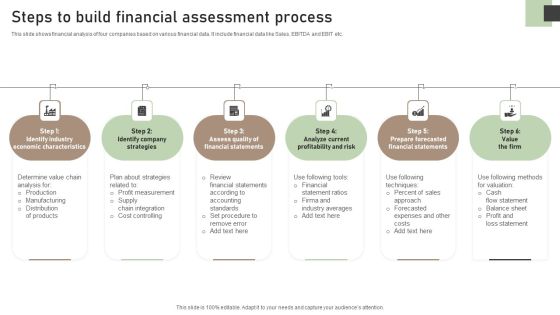
Steps To Build Financial Assessment Process Ideas PDF
This slide shows financial analysis of four companies based on various financial data. It include financial data like Sales, EBITDA and EBIT etc. Presenting Steps To Build Financial Assessment Process Ideas PDF to dispense important information. This template comprises six stages. It also presents valuable insights into the topics including Identify Industry Economic, Identify Company Strategies, Analyze Current Profitability. This is a completely customizable PowerPoint theme that can be put to use immediately. So, download it and address the topic impactfully.

Mainframe Accumulation Architecture Template Powerpoint Slide Backgrounds
This is a mainframe accumulation architecture template powerpoint slide backgrounds. This is a six stage process. The stages in this process are input, data sources, external systems, process, load and dispatch, user interface.

Cloud Information Security Architecture Of Cloud Security Ppt Outline Graphics Design PDF
This slide represents the architecture of the cloud security system and how data is organized and secured under a cloud system. Deliver an awe inspiring pitch with this creative Cloud Information Security Architecture Of Cloud Security Ppt Outline Graphics Design PDF bundle. Topics like Providers Responsibility, Application Security, Data Security can be discussed with this completely editable template. It is available for immediate download depending on the needs and requirements of the user.

Quality Control Process Flow In Capa Information PDF
This slide covers process flow of quality management according to continuous and preventive actions CAPA standards. It contains information about issues, data gathering, escalation, inspection, effectiveness, etc. Showcasing this set of slides titled quality control process flow in capa information pdf. The topics addressed in these templates are gather data, quality events, implemented. All the content presented in this PPT design is completely editable. Download it and make adjustments in color, background, font etc. as per your unique business setting.

Three Puzzle Steps For Business Solutions Powerpoint Slides
Our above slide contains graphics of three puzzle steps. This slide is suitable to present business management and strategy. Use this diagram to impart more clarity to data and to create more sound impact on viewers.

Five Stages Of Estimating Market Size Process Ppt PowerPoint Presentation Infographic Template Graphics Tutorials PDF
Presenting five stages of estimating market size process ppt powerpoint presentation infographic template graphics tutorials pdf to dispense important information. This template comprises five stages. It also presents valuable insights into the topics including defining the market, determining your approach, selecting sources, data structuring typology , data analysis. This is a completely customizable PowerPoint theme that can be put to use immediately. So, download it and address the topic impactfully.

Business Men On Gears Towards Success Trophy Powerpoint Templates
Our above slide contains diagram of business men on gears towards success trophy. It helps to exhibit strategy process and competition. Use this diagram to impart more clarity to data and to create more sound impact on viewers.
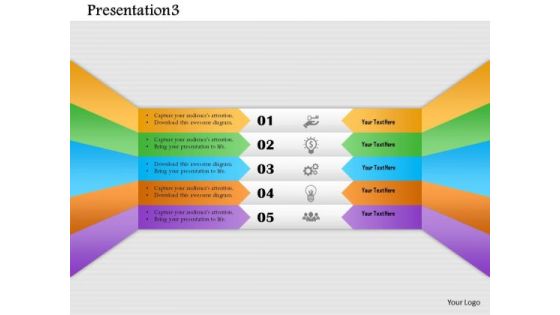
Business Diagram Presentation3 Presentation Template
This business diagram displays five text boxes with icons. This slide is useful for data display. Use this colorful diagram to depict five steps of any business process. It helps in clearly conveying your message to clients and audience.

Four Steps Circular Infographic Powerpoint Templates
Our above slide contains diagram of three stage circular infographic. It helps to display global business analysis. Use this diagram to impart more clarity to data and to create more sound impact on viewers.

Business Event Powerpoint Presentation Templates
This is a business event powerpoint presentation templates. This is a five stage process. The stages in this process are business event, data capture, intelligence deliver, action taken, customer respond.
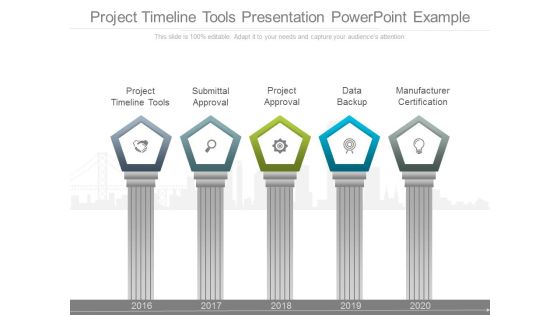
Project Timeline Tools Presentation Powerpoint Example
This is a project timeline tools presentation powerpoint example. This is a five stage process. The stages in this process are project timeline tools, submittal approval, project approval, data backup, manufacturer certification.

Choosing An Area Of Research Powerpoint Show
This is a choosing an area of research powerpoint show. This is a five stage process. The stages in this process are choosing an area of research, review of studies, sources of feedback, complete proposal, choosing method of data collection.

Choosing An Area Of Research Powerpoint Slides
This is a choosing an area of research powerpoint slides. This is a five stage process. The stages in this process are choosing an area of research, choosing method of data collection, review of studies, sources of feedback, complete proposal.
Coalescer Section Powerpoint Slides Design
This is a coalescer section powerpoint slides design. This is a six stage process. The stages in this process are data flow diagram, compressed air, coalescer section, fresh caustic prewash, jet fuel feed, spent caustic drain.

Sample Organizational Change Template Presentation Slides
This is a sample organizational change template presentation slides. This is a five stage process. The stages in this process are scope the change, create the vision, data commitment, establish change infra, sustain the change.
Voice Of The Customer Six Sigma Diagram Ppt Images
This is a voice of the customer six sigma diagram ppt images. This is a five stage process. The stages in this process are groups, warranty, metrics, data returns, survey, voice of customer.

Board Strategic Planning Example Presentation Background Image
This is a board strategic planning example presentation background image. This is a eight stage process. The stages in this process are data retreat, propose goals, defind strategy, examine, share the plan, propose mission, visioning retreat, from the planning team.

Customized Analytical Support Diagram Powerpoint Presentation Examples
This is a customized analytical support diagram powerpoint presentation examples. This is a four stage process. The stages in this process are scope and define the problem, data gathering and investigation, develop options, recommendation report.
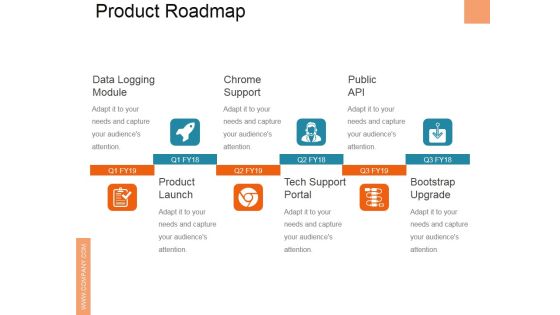
Product Roadmap Template Ppt PowerPoint Presentation Summary Files
This is a product roadmap template ppt powerpoint presentation summary files. This is a six stage process. The stages in this process are product launch, tech support portal, bootstrap upgrade, data logging module, chrome support.
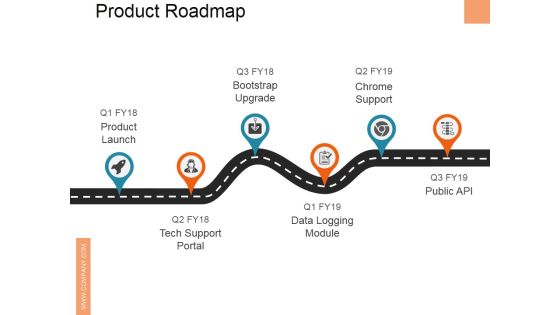
Product Roadmap Ppt PowerPoint Presentation Ideas Grid
This is a product roadmap ppt powerpoint presentation ideas grid. This is a six stage process. The stages in this process are data logging module, product launch, chrome support, tech support portal, public api.

Product Roadmap Template Ppt PowerPoint Presentation Infographics Template
This is a product roadmap template ppt powerpoint presentation infographics template. This is a six stage process. The stages in this process are product launch, tech support portal, bootstrap upgrade, data logging module, chrome support.

Product Roadmap Ppt PowerPoint Presentation Ideas Graphics
This is a product roadmap ppt powerpoint presentation ideas graphics. This is a six stage process. The stages in this process are product launch, bootstrap upgrade, chrome support, tech support portal, data logging module.

Quality Control Check Sheet Ppt PowerPoint Presentation Layouts Designs
This is a quality control check sheet ppt powerpoint presentation layouts designs. This is a nine stage process. The stages in this process are location, data collection date, defect type event occurrence, dates.
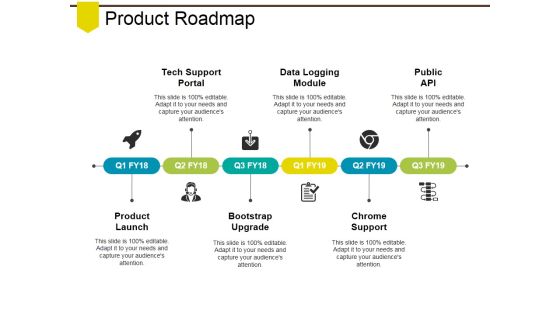
Product Roadmap Template Ppt PowerPoint Presentation Model Designs
This is a product roadmap template ppt powerpoint presentation model designs. This is a six stage process. The stages in this process are public api, chrome support, data logging module, bootstrap upgrade, tech support portal.
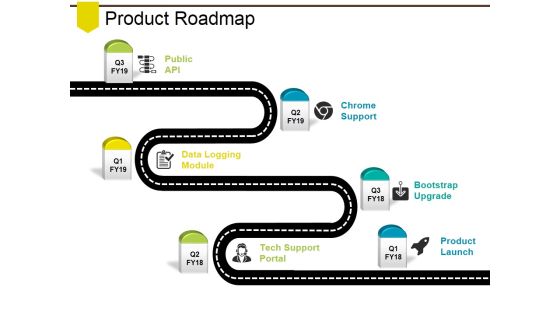
Product Roadmap Ppt PowerPoint Presentation Portfolio Design Ideas
This is a product roadmap ppt powerpoint presentation portfolio design ideas. This is a six stage process. The stages in this process are product launch, tech support portal, bootstrap upgrade, data logging module, chrome support.
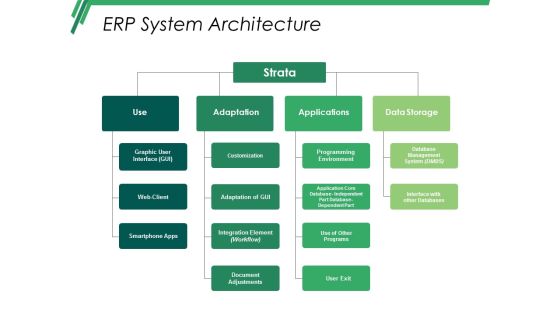
Erp System Architecture Ppt PowerPoint Presentation Pictures Master Slide
This is a erp system architecture ppt powerpoint presentation pictures master slide. This is a four stage process. The stages in this process are use, strata, adaptation, applications, data storage.
Financial Graph Economic Growth Vector Icon Ppt PowerPoint Presentation Infographics Graphic Images Cpb
This is a financial graph economic growth vector icon ppt powerpoint presentation infographics graphic images cpb. This is a three stage process. The stages in this process are bar chart icon, bar graph icon, data chart icon.
Green Arrows On Bars Vector Icon Ppt PowerPoint Presentation Infographic Template Templates Cpb
This is a green arrows on bars vector icon ppt powerpoint presentation infographic template templates cpb. This is a three stage process. The stages in this process are bar chart icon, bar graph icon, data chart icon.
Growing Arrow On Bar Graph Vector Icon Ppt PowerPoint Presentation Designs Cpb
This is a growing arrow on bar graph vector icon ppt powerpoint presentation designs cpb . This is a three stage process. The stages in this process are bar chart icon, bar graph icon, data chart icon.
Histogram Column Chart With Red Arrow Vector Icon Ppt PowerPoint Presentation Outline Ideas Cpb
This is a histogram column chart with red arrow vector icon ppt powerpoint presentation outline ideas cpb. This is a three stage process. The stages in this process are bar chart icon, bar graph icon, data chart icon.
Histogram Icon Showing Economic Fluctuations Ppt PowerPoint Presentation Slides Samples Cpb
This is a histogram icon showing economic fluctuations ppt powerpoint presentation slides samples cpb. This is a three stage process. The stages in this process are bar chart icon, bar graph icon, data chart icon.
Histogram Showing Business Trends Vector Icon Ppt PowerPoint Presentation Styles Portrait Cpb
This is a histogram showing business trends vector icon ppt powerpoint presentation styles portrait cpb. This is a three stage process. The stages in this process are bar chart icon, bar graph icon, data chart icon.
Histogram With Dollar For Financial Success Vector Icon Ppt PowerPoint Presentation Portfolio Example File Cpb
This is a histogram with dollar for financial success vector icon ppt powerpoint presentation portfolio example file cpb. This is a three stage process. The stages in this process are bar chart icon, bar graph icon, data chart icon.
Histogram With Gear Vector Icon Ppt PowerPoint Presentation Professional Slides Cpb
This is a histogram with gear vector icon ppt powerpoint presentation professional slides cpb. This is a three stage process. The stages in this process are bar chart icon, bar graph icon, data chart icon.
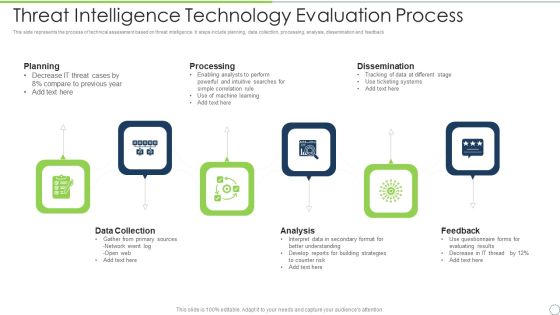
Threat Intelligence Technology Evaluation Process Ppt PowerPoint Presentation File Shapes PDF
This slide represents the process of technical assessment based on threat intelligence. It steps include planning, data collection, processing, analysis, dissemination and feedback. Presenting threat intelligence technology evaluation process ppt powerpoint presentation file shapes pdf to dispense important information. This template comprises six stages. It also presents valuable insights into the topics including planning, processing, dissemination, feedback, analysis, data collection. This is a completely customizable PowerPoint theme that can be put to use immediately. So, download it and address the topic impactfully.

3 Staged Process Of Social Media Analytics Professional PDF
This slide covers three step process of social media analysis. It includes steps such as capturing, understanding and presenting data gathered, summarizing and evaluating data. Presenting 3 Staged Process Of Social Media Analytics Professional PDF to dispense important information. This template comprises three stages. It also presents valuable insights into the topics including Understand, Present, Capture. This is a completely customizable PowerPoint theme that can be put to use immediately. So, download it and address the topic impactfully.

Problem Solving Journey With Evaluate And Monitor Results Ppt PowerPoint Presentation Gallery Demonstration PDF
Persuade your audience using this problem solving journey with evaluate and monitor results ppt powerpoint presentation gallery demonstration pdf. This PPT design covers eight stages, thus making it a great tool to use. It also caters to a variety of topics including data exploration, data preparation, validate model. Download this PPT design now to present a convincing pitch that not only emphasizes the topic but also showcases your presentation skills.
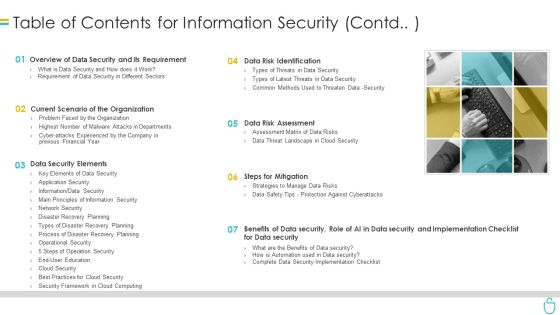
Table Of Contents For Information Security Contd Ppt Show Topics PDF
This is a table of contents for information security contd ppt show topics pdf template with various stages. Focus and dispense information on seven stages using this creative set, that comes with editable features. It contains large content boxes to add your information on topics like organization, requirement, data security, data risk assessment, steps for mitigation. You can also showcase facts, figures, and other relevant content using this PPT layout. Grab it now.

Developing Business Analytics Framework Enhancing Value Of Information Stored Infographics PDF
This slide provides details regarding the value enhancement of information stored in data center in context to benefits associated to it with the help of data optimize software Deliver and pitch your topic in the best possible manner with this Developing Business Analytics Framework Enhancing Value Of Information Stored Infographics PDF Use them to share invaluable insights on Optimize Software, Customer Transactional, Process Automation and impress your audience. This template can be altered and modified as per your expectations. So, grab it now.
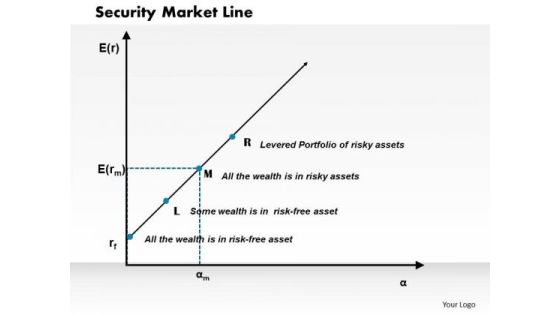
Business Framework Security Market Line PowerPoint Presentation
This diagram displays graph of security market line. You can use line graph to plot changes in data over time, such as monthly revenue and earnings changes or daily changes in stock market prices.
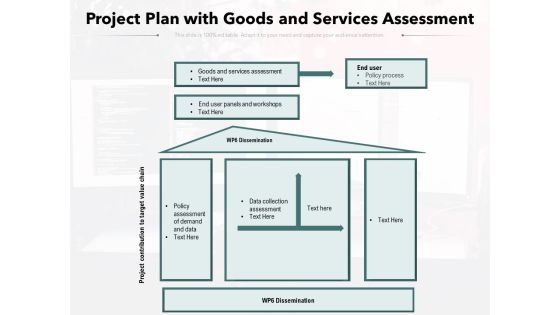
Project Plan With Goods And Services Assessment Ppt PowerPoint Presentation Outline Visuals PDF
Presenting this set of slides with name project plan with goods and services assessment ppt powerpoint presentation outline visuals pdf. The topics discussed in these slides are goods and services assessment, end user panels and workshops, policy process, policy assessment of demand and data, data collection assessment. This is a completely editable PowerPoint presentation and is available for immediate download. Download now and impress your audience.
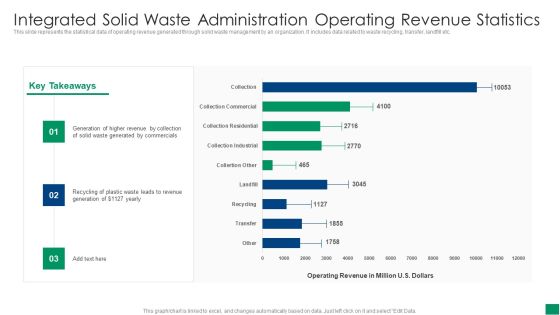
Integrated Solid Waste Administration Operating Revenue Statistics Formats PDF
This slide represents the statistical data of operating revenue generated through solid waste management by an organization. It includes data related to waste recycling, transfer, landfill etc. Pitch your topic with ease and precision using this Integrated Solid Waste Administration Operating Revenue Statistics Formats PDF. This layout presents information on Revenue, Recycling, Commercials. It is also available for immediate download and adjustment. So, changes can be made in the color, design, graphics or any other component to create a unique layout.

Information Privacy IT Lawfulness Fairness And Transparency Principle Structure PDF
This slide shows the lawfulness, fairness, and transparency concept, which establishes explanations for data processing and includes six legitimate basis for personal data. Deliver an awe inspiring pitch with this creative information privacy it lawfulness fairness and transparency principle structure pdf bundle. Topics like lawfulness, fairness, and transparency principle can be discussed with this completely editable template. It is available for immediate download depending on the needs and requirements of the user.
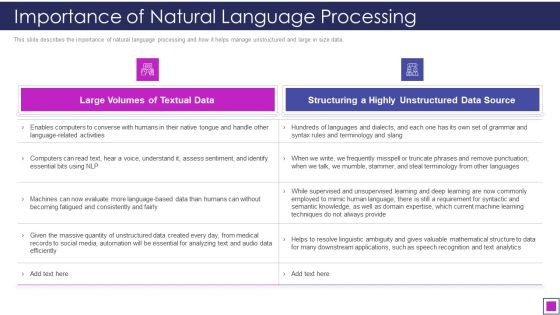
Importance Of Natural Language Processing Ppt Show Background Designs PDF
This slide describes the importance of natural language processing and how it helps manage unstructured and large in size data. Deliver an awe inspiring pitch with this creative importance of natural language processing ppt show background designs pdf bundle. Topics like analyzing, social media, requirement, data source can be discussed with this completely editable template. It is available for immediate download depending on the needs and requirements of the user.
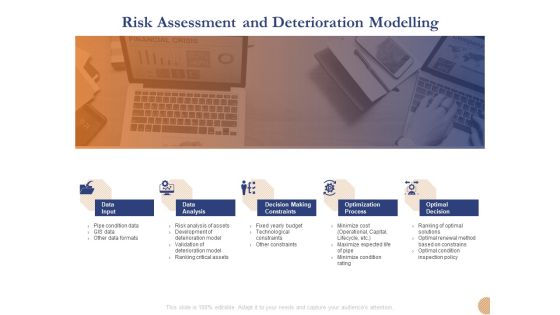
Substructure Segment Analysis Risk Assessment And Deterioration Modelling Ppt Professional Layouts PDF
Presenting substructure segment analysis risk assessment and deterioration modelling ppt professional layouts pdf to provide visual cues and insights. Share and navigate important information on five stages that need your due attention. This template can be used to pitch topics like data input, data analysis, optimal decision, optimization process, decision making constraints. In addition, this PPT design contains high-resolution images, graphics, etc, that are easily editable and available for immediate download.

Four Circles For Marketing Plan Sample Powerpoint Template
Our above slide contains infographic diagram of four circles. This PPT slide helps to exhibit sample of marketing plan. Use this PowerPoint template to impart more clarity to data and to create more sound impact on viewers.

Business Diagram Four Thermometer For Entrepreneurship Statistics Presentation Template
Graphic of thermometers have been used to design this business diagram. Thermometers can be used to display entrepreneurship statistics. Use this diagram your data and information related topics in any presentation.
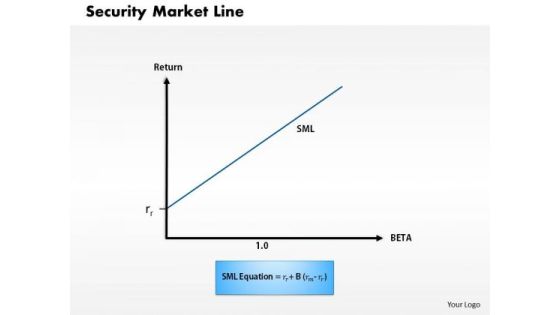
Business Framework Security Market Line 1 PowerPoint Presentation
This diagram displays graph of security market line. You can use line graph to plot changes in data over time, such as monthly revenue and earnings changes or daily changes in stock market prices.

Business Framework Security Market Line 11 PowerPoint Presentation
This diagram displays graph of security market line. You can use line graph to plot changes in data over time, such as monthly revenue and earnings changes or daily changes in stock market prices.

Five Steps Of Human Assessment Planning Process Ppt PowerPoint Presentation Outline Model PDF
This slide shows the various stages of workforce analysis planning process. These stages are strategy formulation, data collection and analysis, implementation and assessment . Presenting Five Steps Of Human Assessment Planning Process Ppt PowerPoint Presentation Outline Model PDF to dispense important information. This template comprises five stages. It also presents valuable insights into the topics including Goals Missions, Data Collection, Implementation. This is a completely customizable PowerPoint theme that can be put to use immediately. So, download it and address the topic impactfully.

Six Staged Concentric Circles For Business Marketing Strategy Powerpoint Template
Our above PPT slide contains graphics of concentric circles. This PowerPoint template may be used to depict business marketing strategy. Use this diagram to impart more clarity to data and to create more sound impact on viewers.
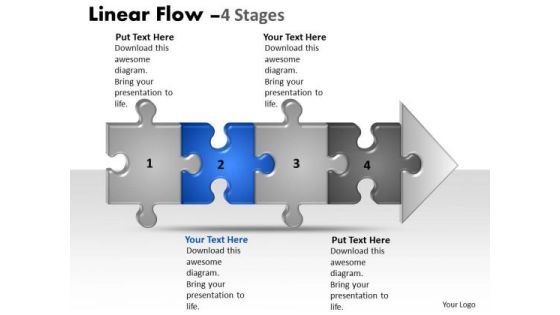
Usa Ppt Background Linear Flow 4 State Diagram Style1 Time Management PowerPoint 3 Design
USA PPT Background linear flow 4 state diagram style1 time management powerpoint 3 design-Linear flow diagram is a visual representation of the flow of data in an information system. Data flows are an important visualization tool to model processes.-USA PPT Background linear flow 4 state diagram style1 time management powerpoint 3 design-Arrow, Attached, Background, Business, Chain, Chart, Competition, Concepts, Connection, Diagram, Finance, Future, Graph, Growth, Ideas, Improvement, Investment, Isolated, Jigsaw, Making, Market, Money, Order, Partnership, Piece, Planning, Puzzle, Shape
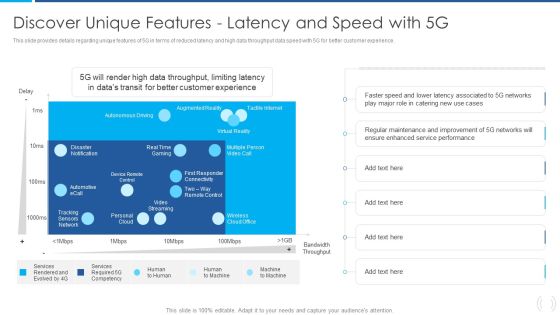
Proactive Method For 5G Deployment By Telecom Companies Discover Unique Features Latency And Speed With 5G Guidelines PDF
This slide provides details regarding unique features of 5G in terms of reduced latency and high data throughput data speed with 5G for better customer experience.Deliver an awe inspiring pitch with this creative Proactive Method For 5G Deployment By Telecom Companies Discover Unique Features Latency And Speed With 5G Guidelines PDF bundle. Topics like Autonomous Driving, Augmented Reality, Tactile Internet can be discussed with this completely editable template. It is available for immediate download depending on the needs and requirements of the user.

Discover Unique Features Latency And Speed With 5G Network Architecture Instructions Background PDF
This slide provides details regarding unique features of 5G in terms of reduced latency and high data throughput data speed with 5G for better customer experience. Deliver an awe inspiring pitch with this creative Discover Unique Features Latency And Speed With 5G Network Architecture Instructions Background PDF bundle. Topics like Autonomous Driving, Augmented Reality, Tactile Internet can be discussed with this completely editable template. It is available for immediate download depending on the needs and requirements of the user.
Banking Overview Diagram Sample Ppt Slides
This is a banking overview diagram sample ppt slides. This is a one stage process. The stages in this process are banking and finance, wealth management, network security and solution, systems integration, commercial banking, database development and administration, data warehouse solutions, consumer banking, ui, ux, application design and development, project management, business analysis and quality assurance, investment banking, architecture services, big data and cloud computing.

Barriers In Implementation Of Integrating Iiot Infographics PDF
This slide covers top 5 challenges companies face in implementing phase of IIOT. It includes key barriers such as connectivity, data analysis, skill gaps, financing problems and security issues. Presenting Barriers In Implementation Of Integrating Iiot Infographics PDF to dispense important information. This template comprises five stages. It also presents valuable insights into the topics including Data Analysis, Connectivity, Financing. This is a completely customizable PowerPoint theme that can be put to use immediately. So, download it and address the topic impactfully.

Corporate Intelligence Model With Channel Assessment Ppt Icon Outline PDF
This is a corporate intelligence model with channel assessment ppt icon outline pdf template with various stages. Focus and dispense information on five stages using this creative set, that comes with editable features. It contains large content boxes to add your information on topics like strategic planning and direction, analysis and reporting, data collection, data gathering. You can also showcase facts, figures, and other relevant content using this PPT layout. Grab it now.

Business Diagram Four Colored Tablets With Text Boxes Presentation Template
Graphic of four colored tablets has been used to design this power point template diagram. This PPT diagram contains the concept of data and text representation. Use this PPT for marketing and business related presentations.
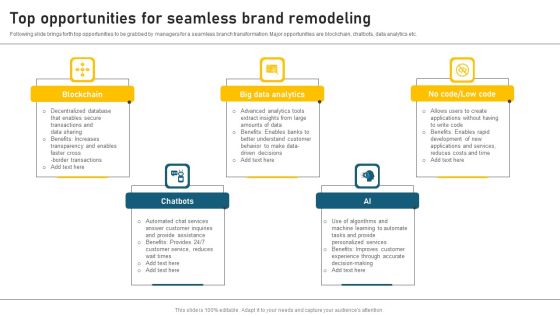
Top Opportunities For Seamless Brand Remodeling Summary PDF
Following slide brings forth top opportunities to be grabbed by managers for a seamless branch transformation. Major opportunities are blockchain, chatbots, data analytics etc. Presenting Top Opportunities For Seamless Brand Remodeling Summary PDF to dispense important information. This template comprises Five stages. It also presents valuable insights into the topics including Blockchain, Big Data Analytics, Chatbots. This is a completely customizable PowerPoint theme that can be put to use immediately. So, download it and address the topic impactfully.
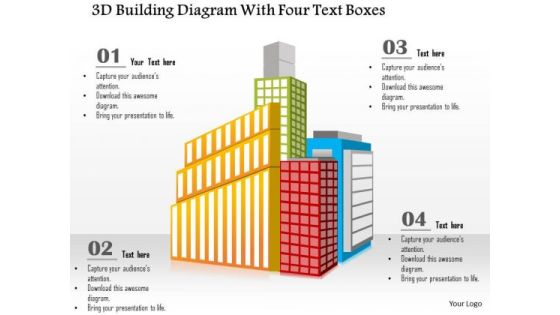
Busines Diagram 3d Building Diagram With Four Text Boxes Presentation Template
This business diagram has been designed with graphic of 3d building diagram and four text boxes. This business slide is useful for data representation. Use this diagram to make professional presentations.
Business Diagram Three Icons Arrow Text Boxes PowerPoint Template
Graphic of three icons and arrow text boxes are used to craft this power point template slide. This PPT contains the concept of business growth. This PPT slide is suitable for business and marketing data flow related presentations.

Challenges And Solutions For Changing Legacy Application Download PDF
This slide defines the challenges faced by the organization while changing the legacy system. It includes information related to costs, technical specifications, data protection and user experience. Presenting Challenges And Solutions For Changing Legacy Application Download PDF to dispense important information. This template comprises Four stages. It also presents valuable insights into the topics including Technical Specifications, Data Protection, User Experience. This is a completely customizable PowerPoint theme that can be put to use immediately. So, download it and address the topic impactfully.

Financial Functional Assessment Risk Assessment And Deterioration Modelling Information PDF
This is a financial functional assessment risk assessment and deterioration modelling information pdf template with various stages. Focus and dispense information on five stages using this creative set, that comes with editable features. It contains large content boxes to add your information on topics like data input, data analysis, decision making constraints, optimization process, optimal decision. You can also showcase facts, figures, and other relevant content using this PPT layout. Grab it now.
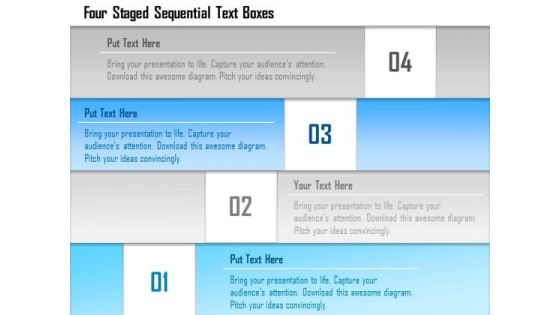
Business Diagram Four Staged Sequential Text Boxes Presentation Template
Four staged sequential stair designed text boxes are used to design this power point template. This PPT contains the concept of data flow. Use this PPT for your business and finance related presentations.
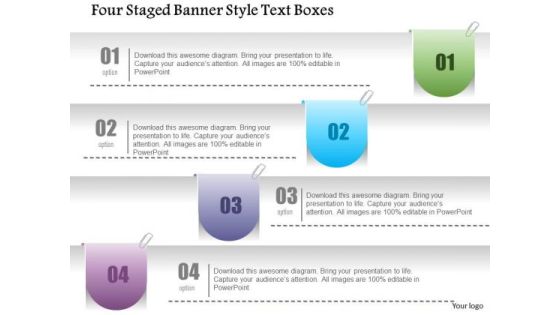
Business Diagram Four Staged Banner Style Text Boxes PowerPoint Template
Four staged banner style text boxes are used to craft this power point template slide. This PPT slide contains the concept of data updating and representation. Use this PPT and crate an impact on your viewers.

Business Diagram Three Hut Shaped Graphics For Text Representation Presentation Template
Three staged hut shaped graphics has been used to craft this power point template. This PPT contains the concept of text representation. Use this PPT for business and marketing data related presentations.
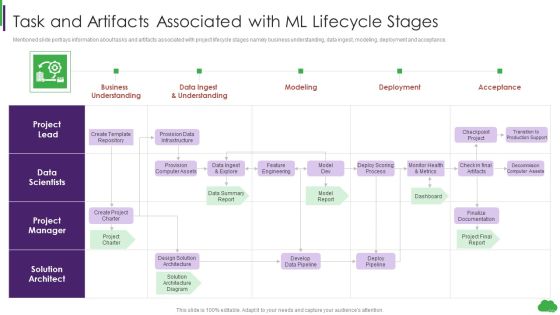
Using Ml And Devops In Product Development Process Task And Artifacts Associated With Ml Lifecycle Ideas PDF
Mentioned slide portrays information about tasks and artifacts associated with project lifecycle stages namely business understanding, data ingest, modeling, deployment and acceptance. Deliver an awe inspiring pitch with this creative Using Ml And Devops In Product Development Process Task And Artifacts Associated With Ml Lifecycle Ideas PDF bundle. Topics like Project Lead, Data Scientists, Project Manager can be discussed with this completely editable template. It is available for immediate download depending on the needs and requirements of the user.

Four Horizontal Text Banners Powerpoint Template
This PowerPoint template has been designed with four horizontal text banners. This diagram is excellent visual tools for business presentations. Download this PPT slide to explain complex data immediately and clearly.

Business Diagram Four Staged Infographics Arrow Diagram Presentation Template
Graphic of four staged info graphics arrow diagram has been used to craft this power point template diagram. This PPT diagram contains the concept of data and text representation. Use this PPT for marketing and business related presentations.

AI And ML Driving Monetary Value For Organization Required Manpower Skills Set Visualization Rules PDF
Following slide shows details about required manpower skills set. Skills set covered are domain knowledge, machine learning, data visualization and hacking. Deliver an awe inspiring pitch with this creative ai and ml driving monetary value for organization required manpower skills set visualization rules pdf bundle. Topics like domain knowledge, machine learning, machine learning, data visualization can be discussed with this completely editable template. It is available for immediate download depending on the needs and requirements of the user.

Business Diagram Seven Staged Flower Petal Diagram For Text Representation Presentation Template
This business diagram displays seven staged flower petal diagram. This Power Point slide can be used for data representation. Use this PPT slide to show flow of activities in circular manner. Get professional with this exclusive business slide.
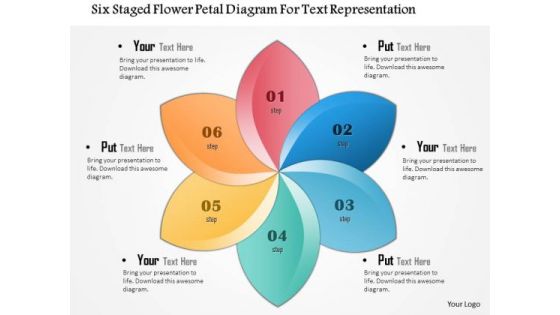
Business Diagram Six Staged Flower Petal Diagram For Text Representation Presentation Template
This business diagram displays six staged flower petal diagram. This Power Point slide can be used for data representation. Use this PPT slide to show flow of activities in circular manner. Get professional with this exclusive business slide.
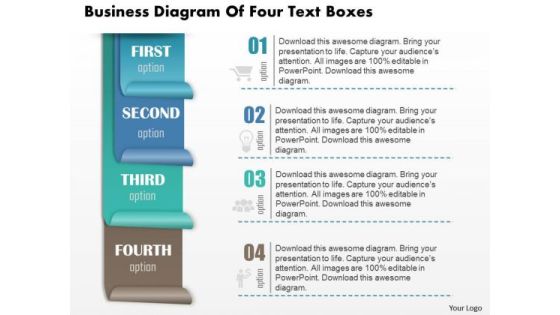
Business Diagram Of Four Text Boxes Presentation Slide Template
This business diagram power point slide has been crafted with four text boxes. Explain business data and calculation with this innovative diagram slide. Use this diagram slide for business and marketing presentations.

Artificial Intelligence And Internet Of Things Operation In Business Ppt PowerPoint Presentation Portfolio Format Ideas PDF
Persuade your audience using this artificial intelligence and internet of things operation in business ppt powerpoint presentation portfolio format ideas pdf. This PPT design covers five stages, thus making it a great tool to use. It also caters to a variety of topics including inventory tracking, data sharing, operational automation, data mining, customer experience. Download this PPT design now to present a convincing pitch that not only emphasizes the topic but also showcases your presentation skills.

Bars Displaying Percentage Growth PowerPoint Templates
Our above PPT slide contains bar graph displaying percentage growth. This diagram of bar graph helps to depict statistical information. Use this diagram to impart more clarity to data and to create more sound impact on viewers.
Four Sequential Text Banners With Icons Powerpoint Template
This PowerPoint template has been designed with four sequential text banners and icons. This diagram is excellent visual tools for business presentations. Download this PPT slide to explain complex data immediately and clearly.
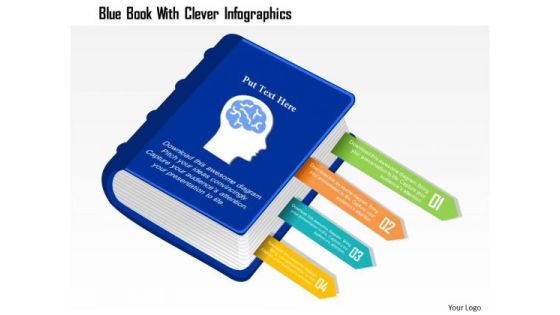
Business Diagram Blue Book With Clever Infographics Presentation Template
Graphic of blue book with clever info graphics has been used to craft this power point template. This PPT diagram contains the concept of educational data representation. Use this PPT for business and marketing related presentations.
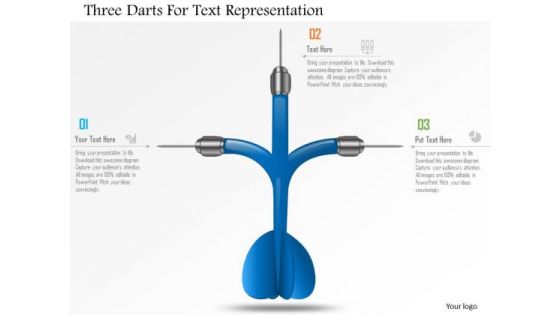
Business Diagram Three Darts For Text Representation Presentation Template
Graphic of three darts has been used to design this power point template. This PPT contains the concept of data representation. Use this PPT and build an exclusive presentation for your viewers.

Business Diagram Three Paper Clips For Text Representation Presentation Template
Three paper clips are used to design this power point template slide. This PPT slide has been crafted for data representation techniques. Use this PPT slide for your business and marketing related presentations.

Business Diagram Four Balloons With Text Boxes PowerPoint Template
Graphic of four balloons style text box diagram has been used to design this power point template slide. This PPT slide contains the concept of business data flow. Use this PPT for your business and marketing related presentations.
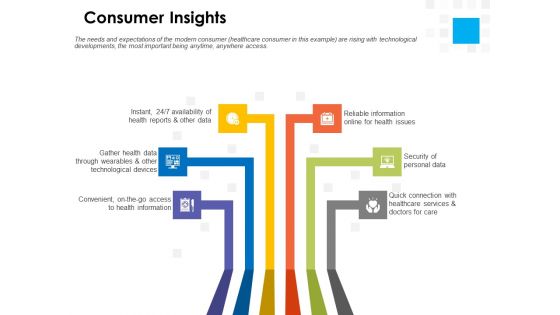
Digital Transformation Strategy Roadmap Consumer Insights Ppt PowerPoint Presentation Layouts Design Inspiration PDF
Presenting this set of slides with name digital transformation strategy roadmap consumer insights ppt powerpoint presentation layouts design inspiration pdf. This is a six stage process. The stages in this process are convenient access, health information, quick connection, healthcare services, security personal data, reliable information online health issues, health reports, gather health data through wearables, technological devices. This is a completely editable PowerPoint presentation and is available for immediate download. Download now and impress your audience.
Business Diagram Loudspeaker With Icons Dialogue Box Presentation Template
Graphic of loudspeaker and icons of dialogue box has been used to design this business diagram. This diagram contains the concept of business information communication. Use this diagram for data communication related presentation.
Business Diagram Loudspeaker With Web Icons Dialogue Box Presentation Template
Graphics of loudspeaker and icons of web with dialogue box have been used to design this business diagram. This diagram contains the concept of business information communication. Use this diagram for data communication related presentation.
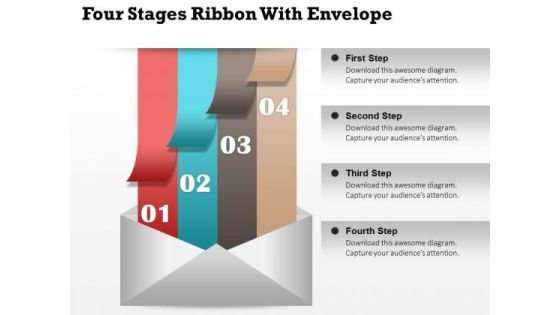
Business Diagram Four Stages Ribbon With Envelope Presentation Template
Concept of data storage and communication has been displayed in this business diagram with graphic of four colored ribbons and envelop. Use this diagram template for business communication related presentations.
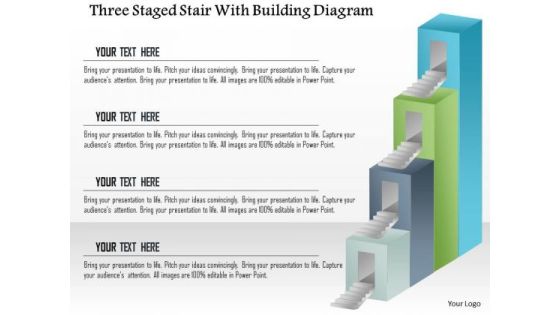
Business Diagram Three Staged Stair With Building Diagram Presentation Template
This Power Point template slide has been designed with graphic of three staged stair diagram. This PPT slide contains the concept of data representation. Use this PPt slide and build innovative presentation for your viewers.

Business Framework Put Option Long PowerPoint Presentation
Our above diagram helps to represent data graphically. Use this put option long diagram for stock market related topics. This diagram has area for your own text to assist you get your point across.

Business Diagram Four Semicircular Arrow Diagram Presentation Template
Graphic of four semicircular arrow diagram has been used to craft this power point template diagram. This PPT diagram contains the concept of data and text representation. Use this PPT for marketing and business related presentations.

Bulb Infographic For Business Analysis Powerpoint Templates
This PowerPoint slide contains graphics of bulb diagram with icons. It helps to exhibit concepts of marketing strategy. Use this diagram to impart more clarity to data and to create more sound impact on viewers.
Stock Photo Red Upload Arrow On Blue Cloud Icon PowerPoint Slide
This technical image slide has been designed with graphic of red upload arrow on cloud. This image slide explains the concept of data upload techniques with in the cloud service. Use this image slide for cloud computing related presentations.
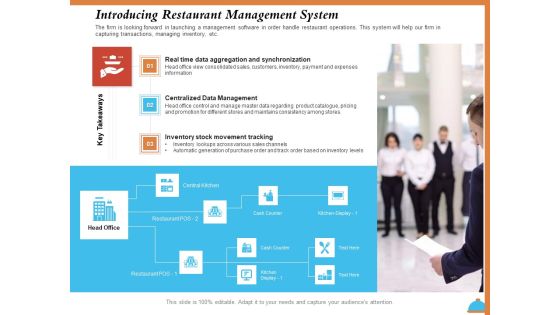
Improving Restaurant Operations Introducing Restaurant Management System Ppt Layouts Slide Download PDF
Presenting this set of slides with name improving restaurant operations introducing restaurant management system ppt layouts slide download pdf. This is a one stage process. The stages in this process are real time data aggregation and synchronization, centralized data management, inventory stock movement tracking, central kitchen, cash counter. This is a completely editable PowerPoint presentation and is available for immediate download. Download now and impress your audience.

Business Diagram Business People Over Bar Chart PowerPoint Template
This Power Point template has been designed with graphic of business people and bar chart. This PPT contains the concept of result analysis and business data display. Use this PPT slide for your business and marketing related presentations.

Business Diagram 3d Circular Infographics With Target Achievement PowerPoint Template
This power point template has been crafted with graphic of 3d circular info graphics. This PPT slide contains the concept of data representation and target achievement. This PPT can be used for target and success related presentations.
Business Diagram Navigation Icon Around Circle Presentation Template
Five staged business info graphics been used to design this power point template. This diagram contains the concept of data representation. Use this diagram for business and finance related presentations
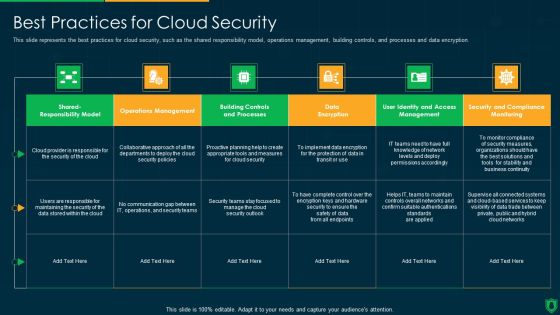
Info Security Best Practices For Cloud Security Ppt PowerPoint Presentation Gallery Visual Aids PDF
This slide represents the best practices for cloud security, such as the shared responsibility model, operations management, building controls, and processes and data encryption. Deliver and pitch your topic in the best possible manner with this info security best practices for cloud security ppt powerpoint presentation gallery visual aids pdf. Use them to share invaluable insights on communication gap, data encryption, operations management and impress your audience. This template can be altered and modified as per your expectations. So, grab it now.
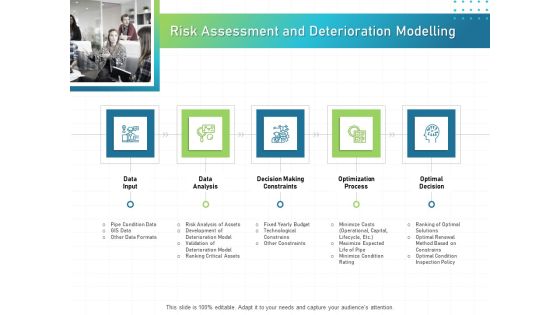
IT Infrastructure Administration Risk Assessment And Deterioration Modelling Ppt Gallery Graphics Pictures PDF
This is a it infrastructure administration risk assessment and deterioration modelling ppt gallery graphics pictures pdf template with various stages. Focus and dispense information on five stages using this creative set, that comes with editable features. It contains large content boxes to add your information on topics like data input, data analysis, decision making constraints, optimization process, optimal decision. You can also showcase facts, figures, and other relevant content using this PPT layout. Grab it now.

Infrastructure Designing And Administration Risk Assessment And Deterioration Modelling Summary PDF
This is a infrastructure designing and administration risk assessment and deterioration modelling summary pdf template with various stages. Focus and dispense information on five stages using this creative set, that comes with editable features. It contains large content boxes to add your information on topics like data input, data analysis, decision making constraints, optimization process, optimal decision. You can also showcase facts, figures, and other relevant content using this PPT layout. Grab it now.

Business Diagram Four Staged Arrows With Different Graphics Of Communication Concept Presentation Te
Four staged arrow with different graphics has been used to craft this power point template. This PPT diagram contains the concept of data communication. Use this PPT for business and technology related presentations.

Gear Infographic For Business Analysis PowerPoint Templates
Our above slide contains diagram of gear infographic. This gear infographic slide helps to exhibit business analysis. Use this diagram to impart more clarity to data and to create more sound impact on viewers.

Stock Photo Black Brown Pie Chart For Business Result PowerPoint Slide
This high quality image is designed with pie chart. Use this image to make business reports. Use this outstanding image in presentations relating to data analysis and reports. Go ahead and add charm to your presentations.
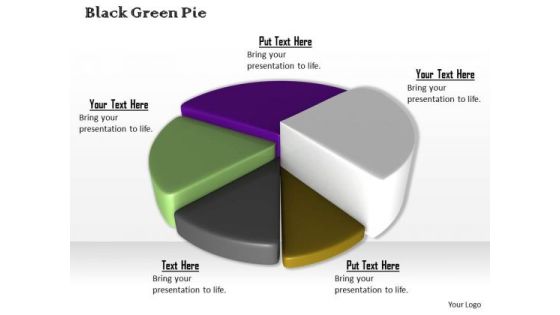
Stock Photo Colorful 3d Pie Chart For Business Result PowerPoint Slide
This high quality image is designed with pie chart. Use this image to make business reports. Use this outstanding image in presentations relating to data analysis and reports. Go ahead and add charm to your presentations.
 Home
Home