Data Mapping

Technological Process Business Template Presentation Powerpoint Example
This is a technological process business template presentation powerpoint example. This is a eight stage process. The stages in this process are client website, training, webinars, coaching, modelling, data preparation, data understanding, business understanding.

Dashboard For Risk Communication Strategies Planning And Key Metrics Tracking Brochure PDF Ideas PDF
This slide shows dashboard for planning risk communication and tracking key metrics which includes heat map of risk, classification, objectives, effectiveness, critical risks, etc. Showcasing this set of slides titled Dashboard For Risk Communication Strategies Planning And Key Metrics Tracking Brochure PDF Ideas PDF. The topics addressed in these templates are Risk Heat Map, Tactical Objectives, Controls Effectiveness. All the content presented in this PPT design is completely editable. Download it and make adjustments in color, background, font etc. as per your unique business setting.

Comparative Health And Risk Key Performance Indicator Dashboard Ppt Portfolio Slide PDF
The slide highlights the comparative health and safety key performance indicator dashboard. It shows current year and previous events, safety incident classification, safety cases by place, map and safety consequence. Showcasing this set of slides titled Comparative Health And Risk Key Performance Indicator Dashboard Ppt Portfolio Slide PDF. The topics addressed in these templates are Safety Consequence, Safety Incidents Classification, Map. All the content presented in this PPT design is completely editable. Download it and make adjustments in color, background, font etc. as per your unique business setting.
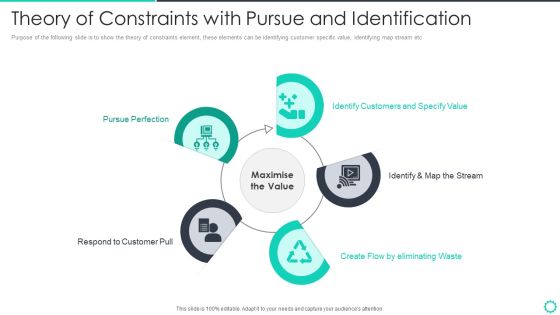
Manufacturing Operation Quality Improvement Practices Tools Templates Theory Of Constraints With Pursue Designs PDF
Purpose of the following slide is to show the theory of constraints element, these elements can be identifying customer specific value, identifying map stream etc. Presenting manufacturing operation quality improvement practices tools templates theory of constraints with pursue designs pdf to provide visual cues and insights. Share and navigate important information on five stages that need your due attention. This template can be used to pitch topics like pursue perfection, identify customers and specify value, identify and map the stream, create flow by eliminating waste, respond to customer pull. In addtion, this PPT design contains high resolution images, graphics, etc, that are easily editable and available for immediate download.

Collection Of Quality Assurance PPT Five Principles Of Lean Manufacturing Structure PDF
Mentioned slide displays five principles of lean manufacturing namely identify value, map value stream, create flow, establish pull and seek performance. Presenting collection of quality assurance ppt five principles of lean manufacturing structure pdf to provide visual cues and insights. Share and navigate important information on five stages that need your due attention. This template can be used to pitch topics like identify value, map value stream, create flow, establish pull, seek performance. In addtion, this PPT design contains high resolution images, graphics, etc, that are easily editable and available for immediate download.

Brand Value Chain Model Brand Value Estimation Guide Microsoft PDF
Mentioned slide shows information about brand perception map along with its importance. The slide also displays sample brand perception map.Do you have an important presentation coming up Are you looking for something that will make your presentation stand out from the rest Look no further than Brand Value Chain Model Brand Value Estimation Guide Microsoft PDF. With our professional designs, you can trust that your presentation will pop and make delivering it a smooth process. And with Slidegeeks, you can trust that your presentation will be unique and memorable. So why wait Grab Brand Value Chain Model Brand Value Estimation Guide Microsoft PDF today and make your presentation stand out from the rest.
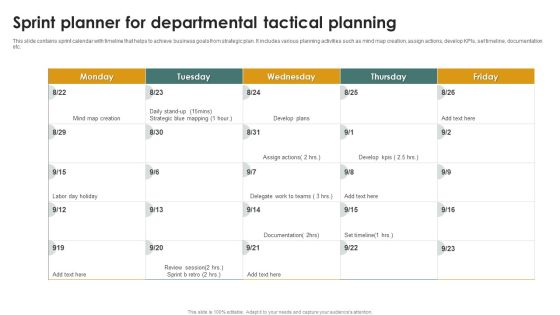
Sprint Planner For Departmental Tactical Planning Ppt Show Slides PDF
This slide contains sprint calendar with timeline that helps to achieve business goals from strategic plan. It includes various planning activities such as mind map creation, assign actions, develop KPIs, set timeline, documentation etc. Presenting Sprint Planner For Departmental Tactical Planning Ppt Show Slides PDF to dispense important information. This template comprises two stages. It also presents valuable insights into the topics including Mind Map Creation, Daily Scrum, Resource Allocation. This is a completely customizable PowerPoint theme that can be put to use immediately. So, download it and address the topic impactfully.
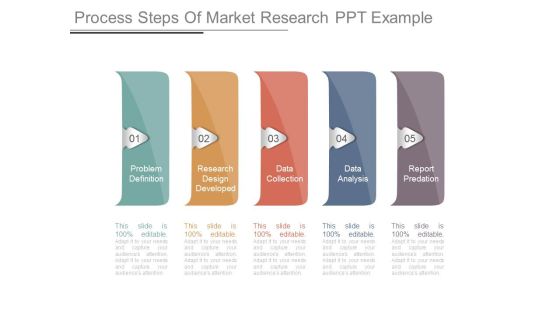
Process Steps Of Market Research Ppt Example
This is a process steps of market research ppt example. This is a five stage process. The stages in this process are problem definition, research design developed, data collection, data analysis, report predation.
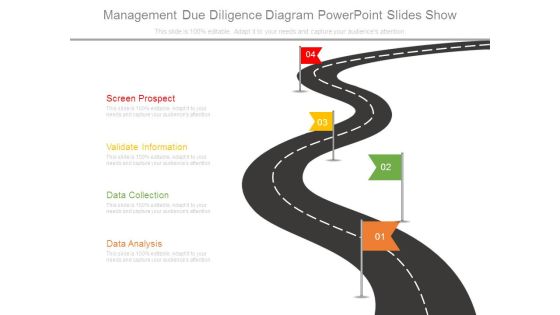
Management Due Diligence Diagram Powerpoint Slides Show
This is a management due diligence diagram powerpoint slides show. This is a four stage process. The stages in this process are screen prospect, validate information, data collection, data analysis.
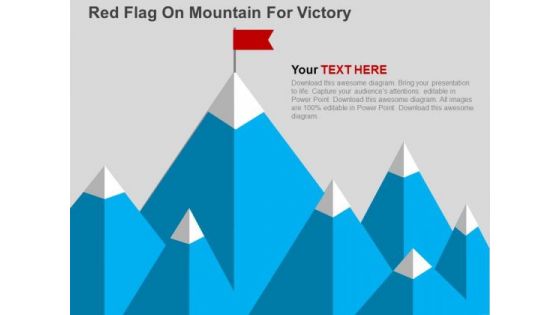
Red Flag On Mountain For Victory PowerPoint Template
Our above funnel diagram displays processing stage that copies multiple input data sets to a single output data set. This slide is truly eye catching. Its visual appeal is magnetic in nature.

Strategic Planning Business Architecture Template Ppt Slides
This is a strategic planning business architecture template ppt slides. This is a five stage process. The stages in this process are strategy, business architecture, enterprise architecture, information data architecture, information data architecture, application architecture.

Steps In Marketing Mix Process Powerpoint Slide Deck
This is a steps in marketing mix process powerpoint slide deck. This is a nine stage process. The stages in this process are market research, communication, implementation, data collection, data analysis, modelling, interpretation, budget allocation, forecasting.

Audit System Process Ppt PowerPoint Presentation Good
This is a audit system process ppt powerpoint presentation good. This is a five stage process. The stages in this process are re evaluate review, objectives standards, implement change, method data collection, data analysis.
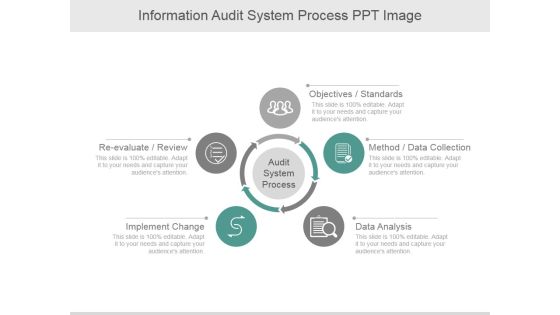
Information Audit System Process Ppt PowerPoint Presentation Ideas
This is a information audit system process ppt powerpoint presentation ideas. This is a five stage process. The stages in this process are objectives standards, method data collection, data analysis, implement change, re evaluate review.
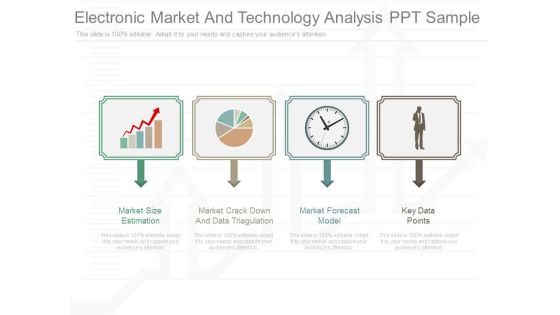
Electronic Market And Technology Analysis Ppt Sample
This is a electrnic market and technology analysis ppt sample. This is a four stage process. The stages in this process are market size estimation, market crack down and data triagulation, market forecast model, key data points.
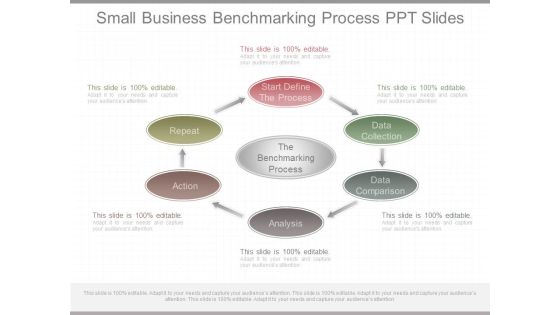
Small Business Benchmarking Process Ppt Slides
This is a small business benchmarking process ppt slides. This is a six stage process. The stages in this process are the benchmarking process, start define the process, data collection, data comparison, analysis, action, repeat.
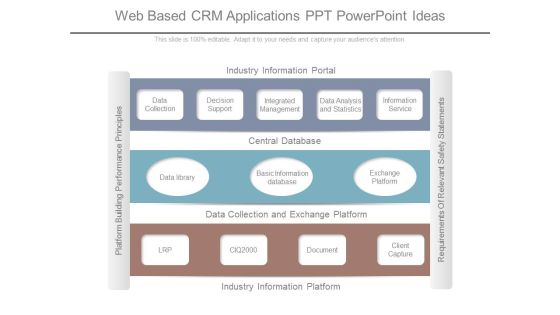
Web Based Crm Applications Ppt Powerpoint Ideas
This is a web based crm applications ppt powerpoint ideas. This is a three stage process. The stages in this process are industry information portal, data collection, decision support, integrated management, data analysis and statistics, information service, central database.

Market Research Analysis Template Presentation Powerpoint
This is a market research analysis template presentation powerpoint. This is a five stage process. The stages in this process are market research data analysis, web survey analysis, product research, data processing, brand valuation, market research analysis.

Marketing Intelligence Cycle Diagram Powerpoint Ideas
This is a marketing intelligence cycle diagram powerpoint ideas. This is a five stage process. The stages in this process are marketing strategy, marketing research, interactive marketing, data analytics, data management.
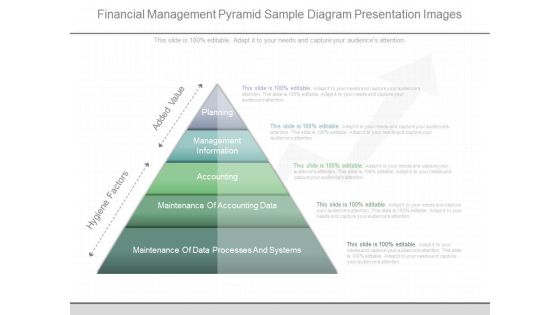
Financial Management Pyramid Sample Diagram Presentation Images
This is a financial management pyramid sample diagram presentation images. This is a five stage process. The stages in this process are planning, management information, accounting, maintenance of accounting data, maintenance of data processes and systems, hygiene factors, added value.
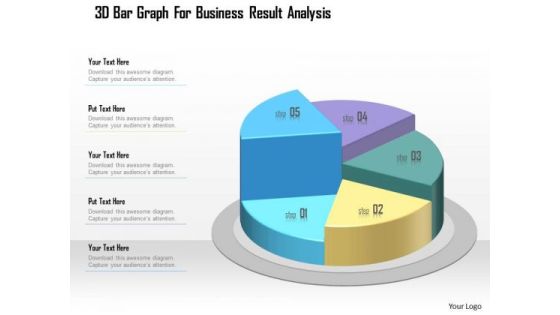
Business Diagram 3d Bar Graph For Business Result Analysis Presentation Template
This business slide displays five staged pie chart. This diagram is a data visualization tool that gives you a simple way to present statistical information. This slide helps your audience examine and interpret the data you present.

Business Diagram Four Steps Flag Design Presentation Template
Graphic of four vertical colorful flags are used to design this power point template. This PPT contains the concept of data representation. Use this PPT for your data related topics in any presentation.
Monitor Screen With Browser Vector Icon Ppt Powerpoint Presentation Infographic Template Example Introduction
This is a monitor screen with browser vector icon ppt powerpoint presentation infographic template example introduction. This is a three stage process. The stages in this process are data management icon, big data icon.
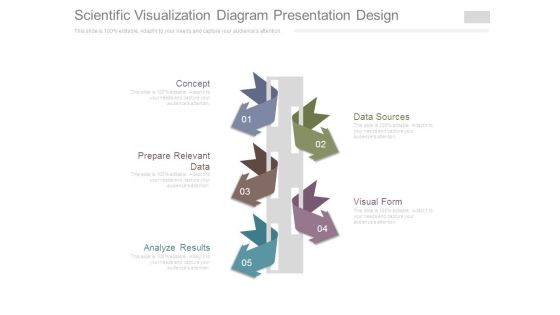
Scientific Visualization Diagram Presentation Design
This is a scientific visualization diagram presentation design. This is a five stage process. The stages in this process are concept, prepare relevant data, analyze results, data sources, visual form.

Hr Business Intelligence Ppt Powerpoint Diagram
This is a hr business intelligence ppt powerpoint diagram. This is a one stage process. The stages in this process are back end data collection and integration tools, hr data mart, hr planning, recruitment, training skills, hr costing, knowledge management.
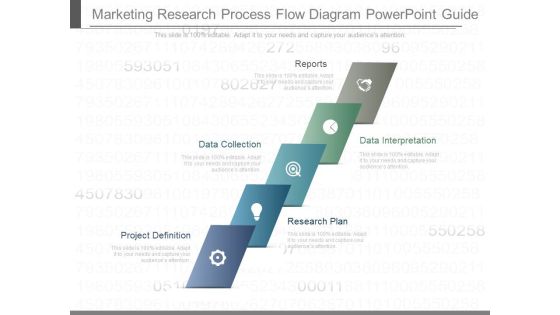
Marketing Research Process Flow Diagram Powerpoint Guide
This is a marketing research process flow diagram powerpoint guide. This is a five stage process. The stages in this process are reports, data interpretation, data collection, research plan, project definition.

Consumer Insight Capabilities Ppt PowerPoint Presentation Styles Example Introduction
This is a consumer insight capabilities ppt powerpoint presentation styles example introduction. This is a six stage process. The stages in this process are insight services, data science services, data management services, research services.

Database Administration And Automation Ppt Powerpoint Presentation Portfolio Images
This is a database administration and automation ppt powerpoint presentation portfolio images. This is a six stage process. The stages in this process are data management, data centre, storage system.

Cloud Computing Files Storage Vector Icon Ppt Powerpoint Presentation Ideas Pictures
This is a cloud computing files storage vector icon ppt powerpoint presentation ideas pictures. This is a one stage process. The stages in this process are data management icon, big data icon.

Computer Screen Monitor Analytics Vector Icon Ppt Powerpoint Presentation Inspiration Grid
This is a computer screen monitor analytics vector icon ppt powerpoint presentation inspiration grid. This is a one stage process. The stages in this process are data management icon, big data icon.

Audit System Purpose Ppt PowerPoint Presentation Images
This is a audit system purpose ppt powerpoint presentation images. This is a four stage process. The stages in this process are collect data, data sample for audit process, track activity, final report creation.

Purpose Of Audit System Ppt PowerPoint Presentation File Layouts
This is a purpose of audit system ppt powerpoint presentation file layouts. This is a four stage process. The stages in this process are final report creation, track activity, collect data, data sample for audit process.

Information Technology For Crm Ppt Ideas
This is a information technology for crm ppt ideas. This is a seven stage process. The stages in this process are cost reduction, strict confidentiality, environment friendly, instant data capture, instant data analysis, reduce input error, increase satisfaction, information technology.

Advanced Email Metrics And Analysis Services Diagram Slide
This is a advanced email metrics and analysis services diagram slide. This is a four stage process. The stages in this process are analytics data warehouse, data mining, financial modeling.
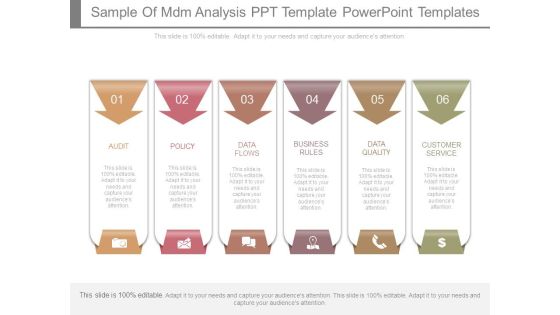
Sample Of Mdm Analysis Ppt Template Powerpoint Templates
This is a sample of mdm analysis ppt template powerpoint templates. This is a six stage process. The stages in this process are audit, policy, data flows, business rules, data quality, customer service.
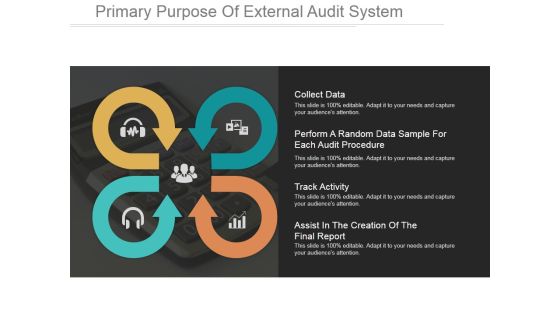
Primary Purpose Of External Audit System Ppt PowerPoint Presentation Rules
This is a primary purpose of external audit system ppt powerpoint presentation rules. This is a four stage process. The stages in this process are collect data, perform a random data sample for each audit procedure, track activity.

Challenges Faced By Our Clients Template 1 Ppt PowerPoint Presentation Gallery Grid
This is a challenges faced by our clients template 1 ppt powerpoint presentation gallery grid. This is a two stage process. The stages in this process are big data challenges, big data opportunity, goal.

Check Sheet Ppt PowerPoint Presentation Infographics File Formats
This is a check sheet ppt powerpoint presentation infographics file formats. This is a four stage process. The stages in this process are check sheet, project name, name of data recorder, location, data collection dates.

Computer Screen With Cloud Icon Ppt Powerpoint Presentation Infographics Display
This is a computer screen with cloud icon ppt powerpoint presentation infographics display. This is a three stage process. The stages in this process are data visualization icon, data management icon.
Visual Analytics Vector Icon Ppt Powerpoint Presentation Infographics Show
This is a visual analytics vector icon ppt powerpoint presentation infographics show. This is a three stage process. The stages in this process are data visualization icon, data management icon.

Challenges Faced By Our Clients Template 1 Ppt PowerPoint Presentation Professional Elements
This is a challenges faced by our clients template 1 ppt powerpoint presentation professional elements. This is a two stage process. The stages in this process are big data challenges, big data opportunity.

Business Diagram Eight Arrows Steps With Globe Presentation Template
Graphic of five staged film roll diagram has been used to craft this power point template diagram. This PPT contains the concept of data representation. Use this PPT for business and marketing data related presentations.

Marketing Research Process Flow Diagram Ppt Presentation Layouts
This is a marketing research process flow diagram ppt presentation layouts. This is a five stage process. The stages in this process are project definition, report, data collection, data interpretation, research plan.
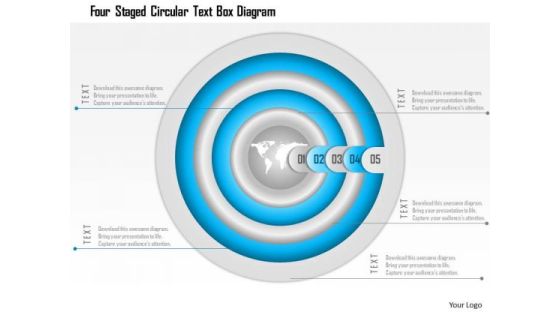
Business Diagram Four Staged Circular Text Box Diagram Presentation Template
This Power point template has been crafted with graphic of four staged circular text boxes. These text boxes can be used for data representation. Use this PPT slide for business data related presentation.

Challenges Faced By Our Clients Template 2 Ppt PowerPoint Presentation Outline Picture
This is a challenges faced by our clients template 2 ppt powerpoint presentation outline picture. This is a two stage process. The stages in this process are big data challenges, big data opportunity, silhouettes, communication, management.
Human Eye Observation And Monitoring Icon Ppt Powerpoint Presentation Slides Background Designs
This is a human eye observation and monitoring icon ppt powerpoint presentation slides background designs. This is a three stage process. The stages in this process are data visualization icon, data management icon.
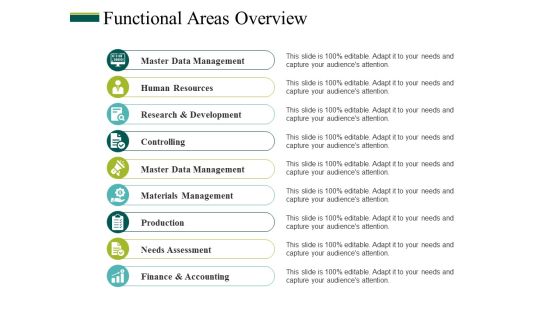
Functional Areas Overview Ppt PowerPoint Presentation Ideas Influencers
This is a functional areas overview ppt powerpoint presentation ideas influencers. This is a nine stage process. The stages in this process are master data management, human resources, research and development, controlling, master data management.
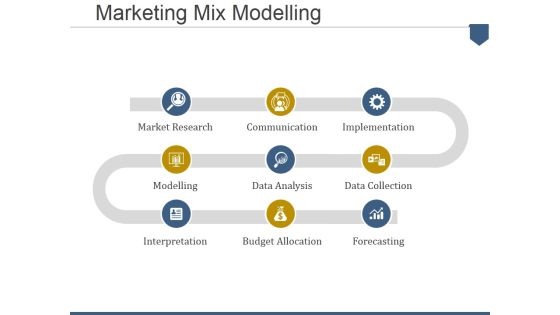
Marketing Mix Modelling Ppt PowerPoint Presentation Portfolio Graphics Template
This is a marketing mix modelling ppt powerpoint presentation portfolio graphics template. This is a three stage process. The stages in this process are market research, communication, implementation, data collection, forecasting, budget allocation, data analysis, modelling, interpretation.

Critical Surveys For Market Research Example Ppt Image
This is a critical surveys for market research example ppt image. This is a seven stage process. The stages in this process are determine research design, data collection, visualization and analysis, define research objective, instrument development, data quality check, reporting.

Cost Reduction Analysis Bar Chart Ppt Powerpoint Presentation File Graphics Design
This is a cost reduction analysis bar chart ppt powerpoint presentation file graphics design. This is a five stage process. The stages in this process are data analysis, data science, information science.
Business Diagram Zigzag Process Diagram With Six Icons Presentation Template
This business diagram has been designed with graphic of six staged zigzag process diagram and icons. This slide depicts concept of data and process flow. Use this diagram for data display in business presentations.

Business Diagram Four Steps For Process Improvement Presentation Template
Graphic of four sequential text boxes are used to design this power point template. This PPT contains the concept of data flow in any process. Use this PPT for your data and process flow related topics in any presentation.

Predictive Analytics Steps Ppt PowerPoint Presentation Styles Guidelines
This is a predictive analytics steps ppt powerpoint presentation styles guidelines. This is a six stage process. The stages in this process are define project, data collection, data analysis, statistics, stages, benefits.
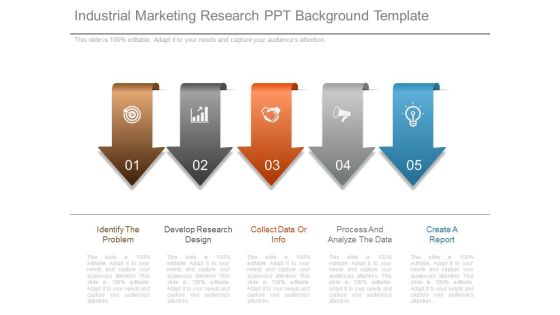
Industrial Marketing Research Ppt Background Template
This is a industrial marketing research ppt background template. This is a five stage process. The stages in this process are identify the problem, develop research design, collect data or info, process and analyze the data, create a report.

Portfolio Revision Ppt PowerPoint Presentation Visual Aids Infographic Template
This is a portfolio revision ppt powerpoint presentation visual aids infographic template. This is a two stage process. The stages in this process are current portfolio, data analysis, new portfolio, data analysis.

Business Diagram Three Interconnected Circles With Text Boxes Presentation Template
Three interconnected circles and text boxes are used to design this business diagram. This slide contains the concept of data and process flow. Use this amazing slide for your business and data related presentations.
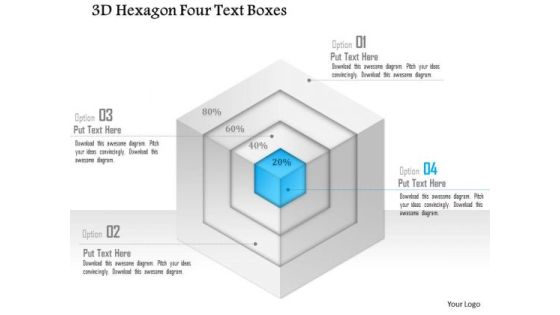
Business Diagram 3d Hexagon Four Text Boxes PowerPoint Template
Graphic of 3d hexagon diagram and text boxes are used to craft this power point template slide. This PPT slide contains the concept of data representation. Use this PPT for your business and marketing data flow related presentations.
Business Diagram Five Staged Multiple Icons Text Boxes Presentation Template
Five staged multiple icons style text boxes has been used to design this power point template. This PPT contains the concept of data representation. Display all data flow related topics in your business presentation with this PPT.

Business Diagram Three Steps Process Diagram Presentation Template
Graphic of three colored pillars has been used to design this power point template diagram. This PPT contains the concept of text and data representation. Use this PPT diagram for your business data related topics.

Assets Resource Planning Template Powerpoint Slides Templates
This is a assets resource planning template powerpoint slides templates. This is a eight stage process. The stages in this process are finance, storage and access, demand, data mining and analysis, external audit, data sales and marketing, operations.

Business Diagram Three Staged Step Diagram For Process Flow Presentation Template
Three staged step diagram has been used to craft this power point template diagram. This PPT contains the concept of data and process flow representation. Use this PPT for business and marketing data related presentations.

Sample Of Visual Analytics Diagram Powerpoint Guide
This is a sample of visual analytics diagram powerpoint guide. This is a four stage process. The stages in this process are data analysis, business problem, find structure, data view.

Corporate Marketing Example Ppt Sample
This is a corporate marketing example ppt sample. This is a four stage process. The stages in this process are corporate marketing, big data processing, external data append, messaging interaction.
Business Diagram Four Steps Process Diagram Presentation Template
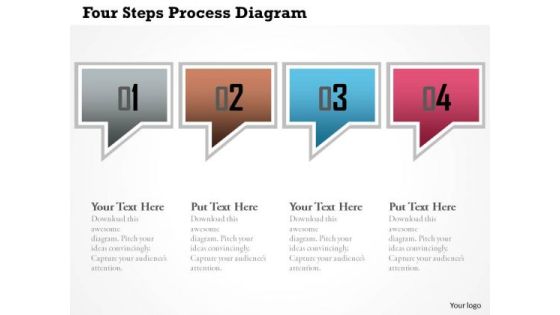
This power point template has been crafted with graphic of dialogue box. This PPT contains the concept of process and data flow. Use this PPT for your business and data related presentations.

Business Diagram Linear Order Of Five Steps For Business Process Presentation Template
Five linear text boxes are used to design this power point template. This PPT contains the concept of data representation. Use this PPT for your data related topics in any presentation.

Statistical Assessment Example Ppt Background Images
This is a statistical assessment example ppt background images. This is a five stage process. The stages in this process are data element, data field, indexed collection, keved collection, bean collection, statistical assessment.

Business Diagram Five Steps In Concentric Circle Presentation Template
Five staged colorful circular text boxes in linear flow has been used to design this power point template. This PPT contains the concept of data representation. Use this PPT for your data related topics in any business or sales presentation.

Reducing Cost Dollar Sign With Cloud On Mobile Ppt Powerpoint Presentation Styles File Formats
This is a reducing cost dollar sign with cloud on mobile ppt powerpoint presentation styles file formats. This is a four stage process. The stages in this process are data analysis, data science, information science.

Business Diagram Three Triangles To Present Business Information Presentation Template
Three interconnected triangles are used to design this business diagram. This slide contains the concept of data and process flow. Use this slide for your business and data related presentations.

Stock Photo Blue Colored Pen Drive With Combination Lock PowerPoint Slide
Graphic of blue colored pen drive and combination lock has been used to design this power point template. This PPT contains the concept of data security and data technology. Use this PPT for your business and marketing related presentations.

Marketing Report For Research Ppt Powerpoint Ideas
This is a marketing report for research ppt powerpoint ideas. This is a five stage process. The stages in this process are project definition, research plan, data collection, data interpretation, summary.
Market Research Report Template Powerpoint Slides
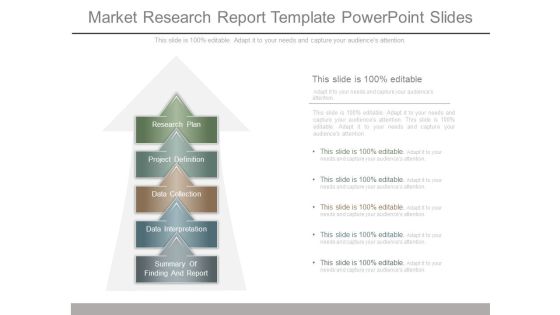
This is a market research report template powerpoint slides. This is a five stage process. The stages in this process are research plan, project definition, data collection, data interpretation, summary of finding and report.
Business Diagram Five Staged Colored Ribbon Graphic For Business PowerPoint Template
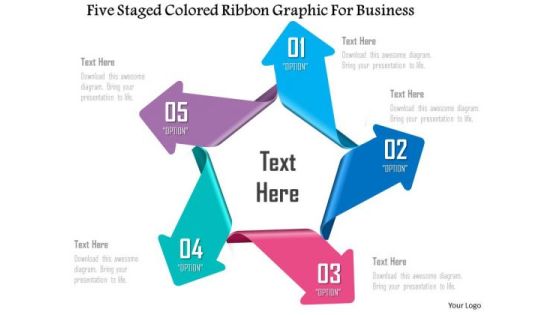
Five staged colored ribbon text boxes are used to design this power point template. This PPT contains the concept of data representation. Use this PPT slide for your marketing and business data related presentations.
Online Niche Marketing Ppt Sample File
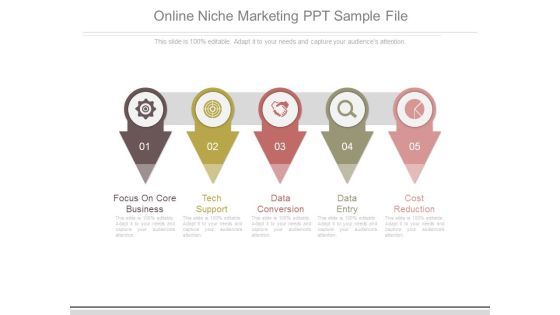
This is a online niche marketing ppt sample file. This is a five stage process. The stages in this process are focus on core business, tech support, data conversion, data entry, cost reduction.

Cost Reduction With Downward Arrow And Dollar Sign Ppt Powerpoint Presentation Infographics Templates
This is a cost reduction with downward arrow and dollar sign ppt powerpoint presentation infographics templates. This is a three stage process. The stages in this process are data analysis, data science, information science.
Minimize Expenses To Reduce Business Cost Ppt Powerpoint Presentation Inspiration Pictures
This is a minimize expenses to reduce business cost ppt powerpoint presentation inspiration pictures. This is a four stage process. The stages in this process are data analysis, data science, information science.
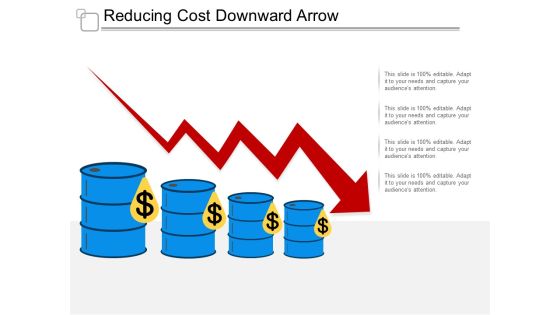
Reducing Cost Downward Arrow Ppt Powerpoint Presentation Outline Inspiration
This is a reducing cost downward arrow ppt powerpoint presentation outline inspiration. This is a four stage process. The stages in this process are data analysis, data science, information science.

Reducing Cost Vector Dollar Sign With Down Arrow Ppt Powerpoint Presentation Model Outline
This is a reducing cost vector dollar sign with down arrow ppt powerpoint presentation model outline. This is a four stage process. The stages in this process are data analysis, data science, information science.

Ways To Reduce Business Costs Ppt Powerpoint Presentation Portfolio Images
This is a ways to reduce business costs ppt powerpoint presentation portfolio images. This is a four stage process. The stages in this process are data analysis, data science, information science.

Research Meeting Powerpoint Slide Designs Download
This is a research meeting powerpoint slide designs download. This is a six stage process. The stages in this process are research meeting, sampling and questionnaire, strategy meeting, data collection, incentivising the respondents by client, data analysis and interpretation.
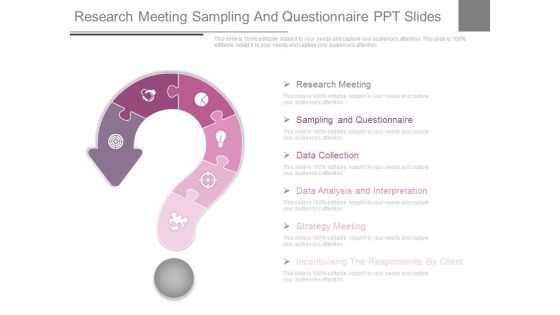
Research Meeting Sampling And Questionnaire Ppt Slides
This is a research meeting sampling and questionnaire ppt slides. This is a six stage process. The stages in this process are sampling and questionnaire, research meeting, data collection, data analysis and interpretation, strategy meeting, incentivising the respondents by client.
Business Diagram Four Staged Torn Paper Text Boxes PowerPoint Template
Four staged torn paper style text boxes are used to craft this power point template. This PPT contains the concept of data representation for business process. Use this PPT and build an innovative presentation for data based topics.
Technology Insights Diagram Ppt Example
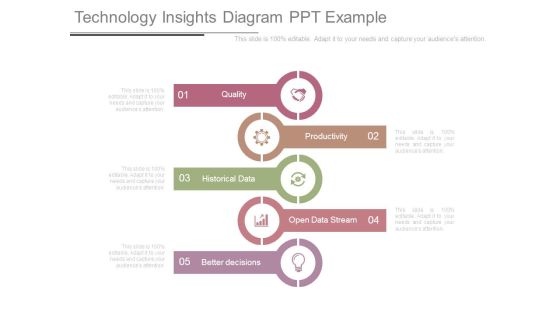
This is a technology insights diagram ppt example. This is a five stage process. The stages in this process are quality, productivity, historical data, open data stream, better decisions.

Business Diagram Building Diagram With Three Steps Presentation Template
Three staged house graphic has been used to craft this power point template. This PPT diagram contains the concept of data representation. Use this PPT for your data and business related presentations.

Business Diagram Timeline Diagram With Six Options Presentation Template
Graphic of designer circles has been used to design this power point template. This PPT contains the concept of data representation. Use this PPT for your business and data related presentation.
Stock Photo 3d Folders With Key And Lock PowerPoint Slide
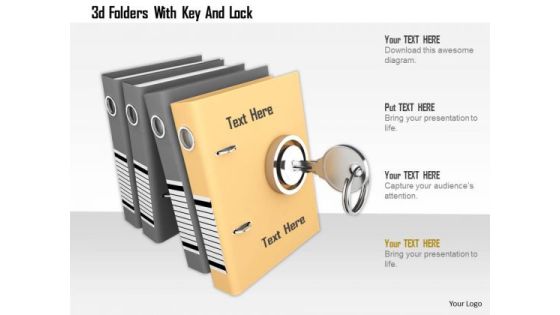
Concept of data security has been displayed in this power point image template with suitable graphics. This image contains the graphics of 3d folders and key with lock. Use this PPT image for your data related presentations.
Workforce Management Strategies For Effective Hiring Process Workforce Analytics Tools Ideas PDF
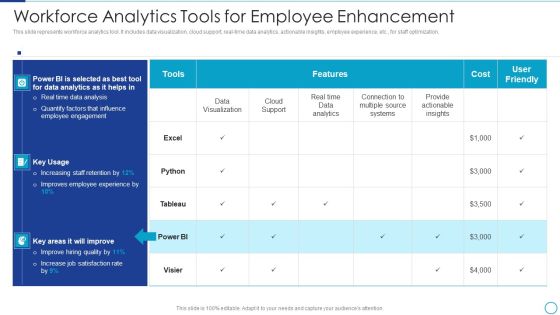
This slide represents workforce analytics tool. It includes data visualization, cloud support, real time data analytics, actionable insights, employee experience, etc. for staff optimization. Deliver an awe inspiring pitch with this creative Workforce Management Strategies For Effective Hiring Process Workforce Analytics Tools Ideas PDF bundle. Topics like Data Analytics, Systems, Data Visualization can be discussed with this completely editable template. It is available for immediate download depending on the needs and requirements of the user.
Business Diagram Five Icons With Circle Diagram Presentation Template
Five staged process flow diagram has been used to craft this power point template. This PPT diagram contains the concept of data and process flow .Use this PPT for business and data related presentations.
Sales Report Template Powerpoint Slides Clipart
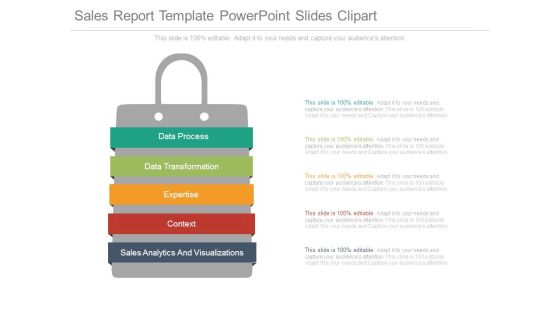
This is a sales report template powerpoint slides clipart. This is a five stage process. The stages in this process are data process, data transformation, expertise, context, sales analytics and visualizations.
Business Diagram Four Icons With Circle Diagram Presentation Template
Four staged process flows has been used to design this power point template. This PPT diagram contains the concept of data flow. Use this PPT for business and marketing data related topics in any presentation.
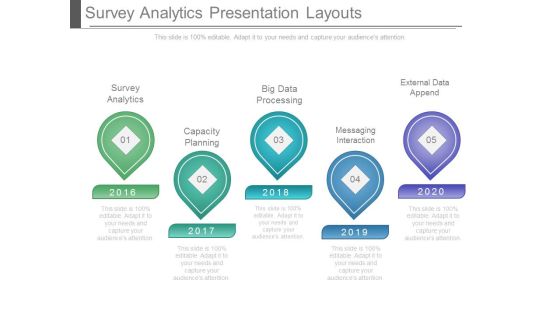
Survey Analytics Presentation Layouts
This is a survey analytics presentation layouts. This is a five stage process. The stages in this process are survey analytics, capacity planning, big data processing, messaging interaction, external data append.

Web Server Slide Background Picture
This is a web server slide background picture. This is a four stage process. The stages in this process are web server, application data sources, usage data sources, history archive system.
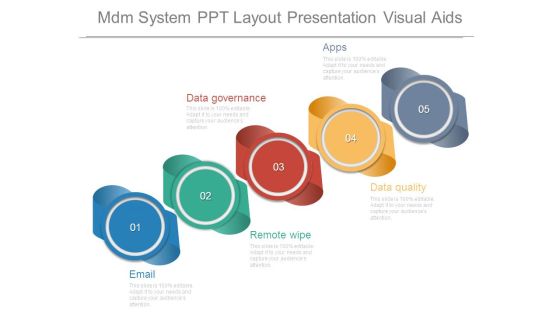
Mdm System Ppt Layout Presentation Visual Aids
This is a mdm system ppt layout presentation visual aids. This is a five stage process. The stages in this process are email, data governance, apps, remote wipe, data quality.

Technical Plan Ppt Layout Presentation Visual Aids
This is a technical plan ppt layout presentation visual aids. This is a five stage process. The stages in this process are data capture, data storage, analyzed, re used, shared.
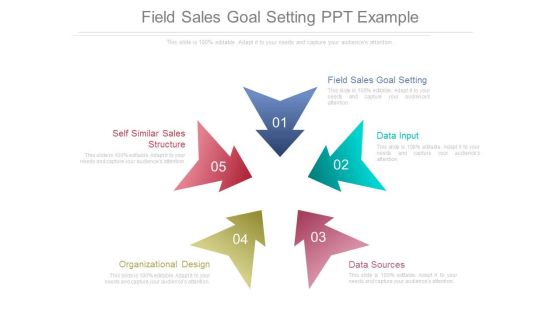
Field Sales Goal Setting Ppt Example
This is a field sales goal setting ppt example. This is a five stage process. The stages in this process are field sales goal setting, data input, data sources, organizational design, self similar sales structure.

Examination Planning Cycle Diagram Powerpoint Topics
This is a examination planning cycle diagram powerpoint topics. This is a five stage process. The stages in this process are network web and messaging, web security, endpoint and mobile devices, cloud and data center, data protection, end point security.

Challenges Faced By Our Clients Template 1 Ppt PowerPoint Presentation Diagrams
This is a challenges faced by our clients template 1 ppt powerpoint presentation diagrams. This is a two stage process. The stages in this process are big data challenges, big data opportunity, threat, communication.

Quality Cost Report Comparison Template 2 Ppt PowerPoint Presentation Outline Maker
This is a quality cost report comparison template 2 ppt powerpoint presentation outline maker. This is a nine stage process. The stages in this process are defect type event occurrence, data collection date, location, name of data recorder, dates.

AI Technology Transfer Process In Healthcare Sector Ppt PowerPoint Presentation Infographics Layout PDF
Presenting ai technology transfer process in healthcare sector ppt powerpoint presentation infographics layout pdf to dispense important information. This template comprises five stages. It also presents valuable insights into the topics including improve data quality, data labeling, software usage, increase data quantity, data collection, algorithm training, deal with clinical reality, understand how al work, enable automated labelling. This is a completely customizable PowerPoint theme that can be put to use immediately. So, download it and address the topic impactfully.
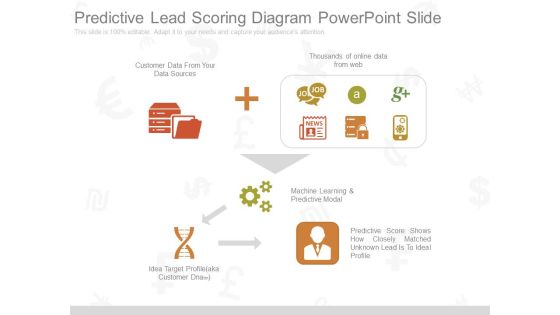
Predictive Lead Scoring Diagram Powerpoint Slide
This is a predictive lead scoring diagram powerpoint slide. This is a one stage process. The stages in this process are thousands of online data from web, customer data from your data sources, machine learning and predictive modal, predictive score shows how closely matched unknown lead is to ideal profile, idea target profile aka customer dnatm.

Crowdfunding Statistics Template 1 Ppt PowerPoint Presentation Good
This is a crowdfunding statistics template 1 ppt powerpoint presentation good. This is a two stage process. The stages in this process are business, location, geographical, finance, bar graph, marketing.

Boosting Machine Learning Machine Learning Process Ppt PowerPoint Presentation Infographic Template Demonstration PDF
Presenting this set of slides with name boosting machine learning machine learning process ppt powerpoint presentation infographic template demonstration pdf. This is a eight stage process. The stages in this process are data gathering, data cleaning, selecting right algorithms, building model and finalising, data transformation predictions, visualisation, modelling, data. This is a completely editable PowerPoint presentation and is available for immediate download. Download now and impress your audience.

Demographic And Geographic Segmentation Of Target Customers Ppt PowerPoint Presentation Outline
This is a demographic and geographic segmentation of target customers ppt powerpoint presentation outline. This is a five stage process. The stages in this process are business, marketing, growth, chart, management.
Six Steps Machine Learning Circular Layout With Icons Ppt PowerPoint Presentation Pictures Icons PDF
Persuade your audience using this six steps machine learning circular layout with icons ppt powerpoint presentation pictures icons pdf. This PPT design covers six stages, thus making it a great tool to use. It also caters to a variety of topics including deployment, train and test the model, analyze data, data wrangling, data preparation, gathering data. Download this PPT design now to present a convincing pitch that not only emphasizes the topic but also showcases your presentation skills.

Business Diagram Five Staged Vertical Ribbon Text Boxes Presentation Template
Five staged vertical ribbon text boxes has been used to craft this power point template. This PPT contains the concept of data representation. Use this PPT for your data related topics in any business and marketing presentation.

Business Diagram Text Boxes Displaying Four Options Presentation Template
Four staged envelop style text boxes has been used to craft this power point template. This PPT contains the concept of data representation. This PPT can be used for your data related topics in any business and marketing presentation.

Business Diagram Five Staged Torn Paper Text Boxes PowerPoint Template
Five staged torn paper design text box diagram has been used to craft this power point template slide. This PPT slide contains the concept of data representation. Use this PPT for your business and marketing data related presentations.
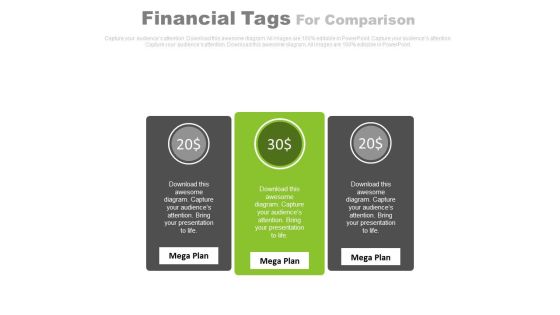
Three Text Tags Compare Chart Powerpoint Slides
This PowerPoint template has been designed with text tags and percentage data. You may download this PPT slide to display data comparison and analysis. Add this slide to your presentation and impress your superiors.
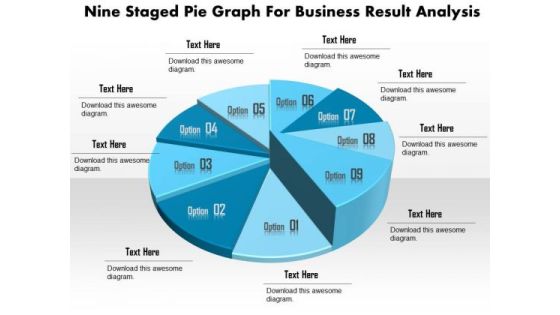
Business Diagram Nine Staged Pie Graph For Business Result Analysis Presentation Template
This business slide displays nine staged pie chart. This diagram is a data visualization tool that gives you a simple way to present statistical information. This slide helps your audience examine and interpret the data you present.

Business Diagram Seven Staged Pie Graph For Business Analysis Presentation Template
This business slide displays seven staged pie chart. This diagram is a data visualization tool that gives you a simple way to present statistical information. This slide helps your audience examine and interpret the data you present.

Business Diagram Six Staged 3d Pie Graph For Result Analysis Presentation Template
This business slide displays six staged pie chart. This diagram is a data visualization tool that gives you a simple way to present statistical information. This slide helps your audience examine and interpret the data you present.
Three Text Boxes With Percentage Values And Icons Powerpoint Slides
This PowerPoint template has been designed with text boxes and percentage data. You may download this PPT slide to display data comparison and analysis. Add this slide to your presentation and impress your superiors.
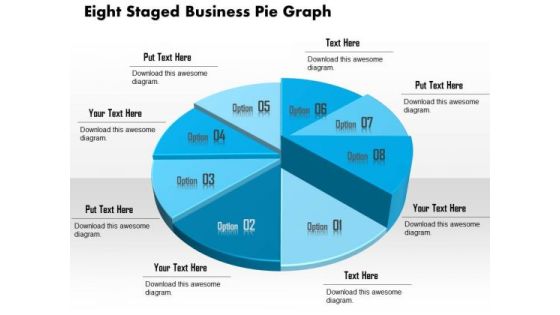
Business Diagram Eight Staged Business Pie Graph Presentation Template
This business slide displays eight staged pie chart. This diagram is a data visualization tool that gives you a simple way to present statistical information. This slide helps your audience examine and interpret the data you present.
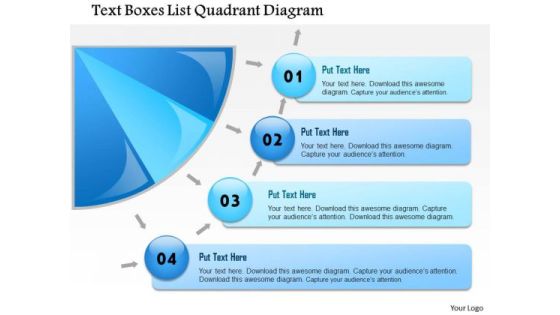
Business Framework Text Boxes List Quadrant Diagram PowerPoint Presentation
A semi circle diagram with text boxes are used to design this power point template slide. This PPT slide contains the concept of displaying business data. This PPT slide may be used for business data representations.

Business Diagram Five Staged Infographics With Stand Design PowerPoint Template
Five staged info graphics with stand has been used to craft this power point template. This PPT contains the concept of data flow. Use this PPT slide for your sales and business data related presentations.
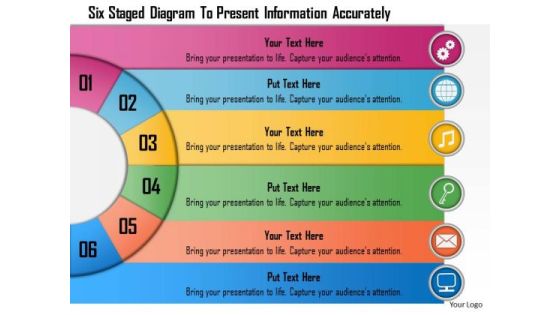
Business Diagram Six Staged Diagram To Present Information Accurately Presentation Template
Six staged semicircular text boxes are used to craft this power point template. This PPT contains the concept of data representation. Use this PPT for your business and sales related data representation in any presentation.

Business Diagram Five Business Steps In Numeric Order Presentation Template
Five colored linear text boxes are used to design this power point template. This PPT contains the concept of data flow updation. Display any data in your business presentation with this unique PPT.
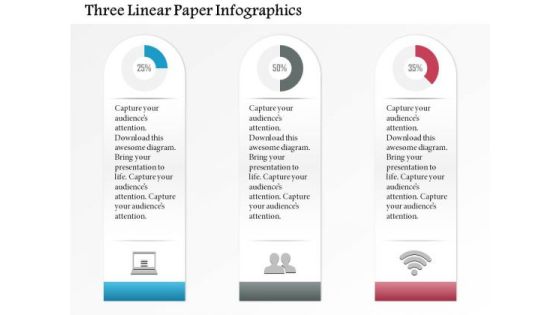
Business Diagram Three Linear Paper Infographics Presentation Template
Three linear paper info graphics has been used to design this power point template slide. This PPT slide contains the concept of data analysis and business data flow. Use this PPT slide for your business and marketing related presentations.
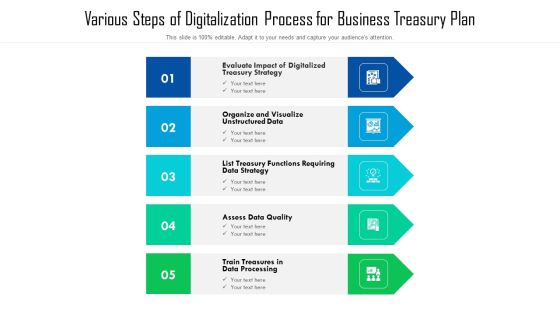
Various Steps Of Digitalization Process For Business Treasury Plan Ppt Professional Aids PDF
Presenting various steps of digitalization process for business treasury plan ppt professional aids pdf to dispense important information. This template comprises five stages. It also presents valuable insights into the topics including treasury strategy, assess data quality, data processing, data strategy, unstructured data. This is a completely customizable PowerPoint theme that can be put to use immediately. So, download it and address the topic impactfully.
Business Diagram Six Steps Infographics With Icons Presntation Template
This power point template has been crafted with graphic of six staged text boxes. This PPT diagram contains the concept of data and text representation. Use this PPT for your business and marketing data related presentations.
 Home
Home