AI PPT Maker
Templates
PPT Bundles
Design Services
Business PPTs
Business Plan
Management
Strategy
Introduction PPT
Roadmap
Self Introduction
Timelines
Process
Marketing
Agenda
Technology
Medical
Startup Business Plan
Cyber Security
Dashboards
SWOT
Proposals
Education
Pitch Deck
Digital Marketing
KPIs
Project Management
Product Management
Artificial Intelligence
Target Market
Communication
Supply Chain
Google Slides
Research Services
 One Pagers
All Categories
-
Home
- Customer Favorites
- Data Icon
Data Icon

A LA Carte Business Strategy Company Forecasted Revenue Growth Professional PDF
This graph depicts the companys forecasted revenue growth for the year 2019 to 2023 covering revenue, EBITDA, Recurring revenue etc. Are you in need of a template that can accommodate all of your creative concepts This one is crafted professionally and can be altered to fit any style. Use it with Google Slides or PowerPoint. Include striking photographs, symbols, depictions, and other visuals. Fill, move around, or remove text boxes as desired. Test out color palettes and font mixtures. Edit and save your work, or work with colleagues. Download A LA Carte Business Strategy Company Forecasted Revenue Growth Professional PDF and observe how to make your presentation outstanding. Give an impeccable presentation to your group and make your presentation unforgettable.
Effective Lead Generation For Higher Conversion Rates Dashboard For Tracking Sessions And Leads By Source Introduction PDF
This slide covers the KPI dashboard for analyzing metrics such as offline sources, direct traffic, organic search, email marketing, paid search, referral, social media, email open, etc. Are you in need of a template that can accommodate all of your creative concepts This one is crafted professionally and can be altered to fit any style. Use it with Google Slides or PowerPoint. Include striking photographs, symbols, depictions, and other visuals. Fill, move around, or remove text boxes as desired. Test out color palettes and font mixtures. Edit and save your work, or work with colleagues. Download Effective Lead Generation For Higher Conversion Rates Dashboard For Tracking Sessions And Leads By Source Introduction PDF and observe how to make your presentation outstanding. Give an impeccable presentation to your group and make your presentation unforgettable.

Online Marketing Strategy For Lead Generation Evaluating Current Marketing Performance Of Organization Slides PDF
This slide showcases overview of current marketing performance that can help organization to determine issues in current promotional campaigns. Its key elements are website traffic, marketing budget and product sales. Are you in need of a template that can accommodate all of your creative concepts This one is crafted professionally and can be altered to fit any style. Use it with Google Slides or PowerPoint. Include striking photographs, symbols, depictions, and other visuals. Fill, move around, or remove text boxes as desired. Test out color palettes and font mixtures. Edit and save your work, or work with colleagues. Download Online Marketing Strategy For Lead Generation Evaluating Current Marketing Performance Of Organization Slides PDF and observe how to make your presentation outstanding. Give an impeccable presentation to your group and make your presentation unforgettable.

Enhancing Buyer Journey Customer Service Concerns Faced By The Company Introduction PDF
This slide represent the issues faced by the company due to poor customer services such as decline in customer satisfaction, poor retention rate, falling churn rate etc. Are you in need of a template that can accommodate all of your creative concepts This one is crafted professionally and can be altered to fit any style. Use it with Google Slides or PowerPoint. Include striking photographs, symbols, depictions, and other visuals. Fill, move around, or remove text boxes as desired. Test out color palettes and font mixtures. Edit and save your work, or work with colleagues. Download Enhancing Buyer Journey Customer Service Concerns Faced By The Company Introduction PDF and observe how to make your presentation outstanding. Give an impeccable presentation to your group and make your presentation unforgettable.

5 Step Guide For Transitioning To Blue Ocean Strategy Blue Ocean Strategy Canvas Framework Inspiration PDF
This template covers strategy canvas framework. It is the action framework for building blue ocean strategy. The horizontal axis includes the range of factors that the industry competes on and invests in , where as vertical axis covers the offerings level that buyers receive across all of the key competing factors. Are you in need of a template that can accommodate all of your creative concepts This one is crafted professionally and can be altered to fit any style. Use it with Google Slides or PowerPoint. Include striking photographs, symbols, depictions, and other visuals. Fill, move around, or remove text boxes as desired. Test out color palettes and font mixtures. Edit and save your work, or work with colleagues. Download 5 Step Guide For Transitioning To Blue Ocean Strategy Blue Ocean Strategy Canvas Framework Inspiration PDF and observe how to make your presentation outstanding. Give an impeccable presentation to your group and make your presentation unforgettable.

Skill Enhancement Plan Forecasted Increase In Company Annual Production In Next 5 Years Graphics PDF
The following slide showcases the expected increase in company annual production rate in coming 5 years due to factors like increased productivity and efficiency of company employees after training program. Are you in need of a template that can accommodate all of your creative concepts This one is crafted professionally and can be altered to fit any style. Use it with Google Slides or PowerPoint. Include striking photographs, symbols, depictions, and other visuals. Fill, move around, or remove text boxes as desired. Test out color palettes and font mixtures. Edit and save your work, or work with colleagues. Download Skill Enhancement Plan Forecasted Increase In Company Annual Production In Next 5 Years Graphics PDF and observe how to make your presentation outstanding. Give an impeccable presentation to your group and make your presentation unforgettable.
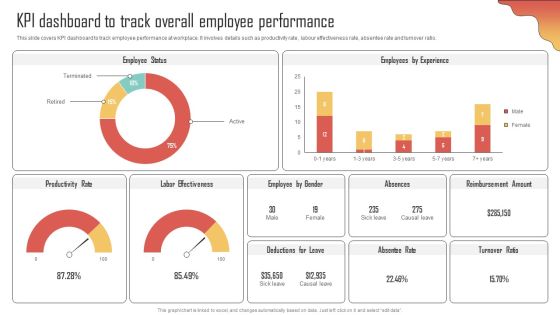
KPI Dashboard To Track Overall Employee Performance Enhancing Organization Productivity By Implementing Structure PDF
This slide covers KPI dashboard to track employee performance at workplace. It involves details such as productivity rate, labour effectiveness rate, absentee rate and turnover ratio. Are you in need of a template that can accommodate all of your creative concepts This one is crafted professionally and can be altered to fit any style. Use it with Google Slides or PowerPoint. Include striking photographs, symbols, depictions, and other visuals. Fill, move around, or remove text boxes as desired. Test out color palettes and font mixtures. Edit and save your work, or work with colleagues. Download KPI Dashboard To Track Overall Employee Performance Enhancing Organization Productivity By Implementing Structure PDF and observe how to make your presentation outstanding. Give an impeccable presentation to your group and make your presentation unforgettable.
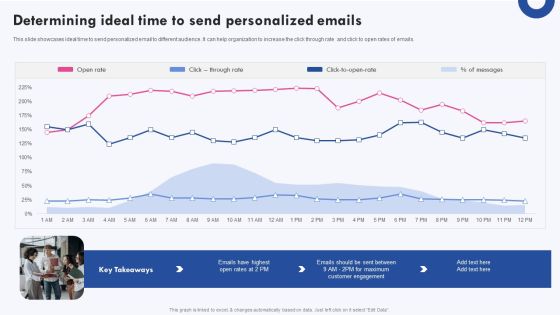
Targeted Marketing Campaigns To Improve Buyers Experience Determining Ideal Time To Send Personalized Emails Portrait PDF
This slide showcases ideal time to send personalized email to different audience. It can help organization to increase the click through rate and click to open rates of emails. Are you in need of a template that can accommodate all of your creative concepts This one is crafted professionally and can be altered to fit any style. Use it with Google Slides or PowerPoint. Include striking photographs, symbols, depictions, and other visuals. Fill, move around, or remove text boxes as desired. Test out color palettes and font mixtures. Edit and save your work, or work with colleagues. Download Targeted Marketing Campaigns To Improve Buyers Experience Determining Ideal Time To Send Personalized Emails Portrait PDF and observe how to make your presentation outstanding. Give an impeccable presentation to your group and make your presentation unforgettable.

Dashboard To Track Performance Of Digital Loan Applications Ppt Infographics PDF
This slide covers dashboard to assess outcomes for loan applications applied by customer through various omnichannel banking services. It includes results based on elements such as debt restructuring, commercial property loans, credit card along with branch based loans, approval rates, etc. Are you in need of a template that can accommodate all of your creative concepts This one is crafted professionally and can be altered to fit any style. Use it with Google Slides or PowerPoint. Include striking photographs, symbols, depictions, and other visuals. Fill, move around, or remove text boxes as desired. Test out color palettes and font mixtures. Edit and save your work, or work with colleagues. Download Dashboard To Track Performance Of Digital Loan Applications Ppt Infographics PDF and observe how to make your presentation outstanding. Give an impeccable presentation to your group and make your presentation unforgettable.

Customer Relationship Management Practices Monitoring Dashboard Designs PDF
Following slide demonstrates KPI dashboard to track business relationship management practices which can be adopted by companies to increase sales. It includes key points such as contacts, deals, campaigns, CRM activities progress status, lead targets, lead details, etc. Are you in need of a template that can accommodate all of your creative concepts This one is crafted professionally and can be altered to fit any style. Use it with Google Slides or PowerPoint. Include striking photographs, symbols, depictions, and other visuals. Fill, move around, or remove text boxes as desired. Test out color palettes and font mixtures. Edit and save your work, or work with colleagues. Download Customer Relationship Management Practices Monitoring Dashboard Designs PDF and observe how to make your presentation outstanding. Give an impeccable presentation to your group and make your presentation unforgettable.

Cybersecurity Operations Cybersecops Malware Attacks On Different Departments Topics PDF
This slide depicts the total number of malware attacks on different departments in the organization. The purpose of this slide is to showcase the percentage of malware attacks on different business divisions, including development, HR, accounts, and IT department. Are you in need of a template that can accommodate all of your creative concepts This one is crafted professionally and can be altered to fit any style. Use it with Google Slides or PowerPoint. Include striking photographs, symbols, depictions, and other visuals. Fill, move around, or remove text boxes as desired. Test out color palettes and font mixtures. Edit and save your work, or work with colleagues. Download Cybersecurity Operations Cybersecops Malware Attacks On Different Departments Topics PDF and observe how to make your presentation outstanding. Give an impeccable presentation to your group and make your presentation unforgettable.

Improving Buyer Journey Through Strategic Customer Engagement Dashboard Illustrating Customer Engagement Background PDF
This slide represents a dashboard highlighting organizations current KPI performance following the adoption of a successful customer engagement strategy. It includes Net promoter score, customer effort score, NPS and CES monthly growth and satisfaction score. Are you in need of a template that can accommodate all of your creative concepts This one is crafted professionally and can be altered to fit any style. Use it with Google Slides or PowerPoint. Include striking photographs, symbols, depictions, and other visuals. Fill, move around, or remove text boxes as desired. Test out color palettes and font mixtures. Edit and save your work, or work with colleagues. Download Improving Buyer Journey Through Strategic Customer Engagement Dashboard Illustrating Customer Engagement Background PDF and observe how to make your presentation outstanding. Give an impeccable presentation to your group and make your presentation unforgettable.

Incorporating Real Time Marketing For Improved Consumer Dashboard Showcasing Impact Of Real Time Sample PDF
The following slide depicts results of real time marketing . It includes elements such as sales metrics, subscribers, SMS sent, clicks, click through rate CTR, average order value, conversion rate, return on investment ROI etc. Are you in need of a template that can accommodate all of your creative concepts This one is crafted professionally and can be altered to fit any style. Use it with Google Slides or PowerPoint. Include striking photographs, symbols, depictions, and other visuals. Fill, move around, or remove text boxes as desired. Test out color palettes and font mixtures. Edit and save your work, or work with colleagues. Download Incorporating Real Time Marketing For Improved Consumer Dashboard Showcasing Impact Of Real Time Sample PDF and observe how to make your presentation outstanding. Give an impeccable presentation to your group and make your presentation unforgettable.
Facebook Ad Campaign Performance Tracking Dashboard Ppt Show Picture PDF
This slide represents the KPI dashboard to effectively measure and monitor performance of Facebook marketing campaign conducted by the organization to enhance customer engagement. It includes details related to KPIs such as ad impressions, ad reach etc. Are you in need of a template that can accommodate all of your creative concepts This one is crafted professionally and can be altered to fit any style. Use it with Google Slides or PowerPoint. Include striking photographs, symbols, depictions, and other visuals. Fill, move around, or remove text boxes as desired. Test out color palettes and font mixtures. Edit and save your work, or work with colleagues. Download Facebook Ad Campaign Performance Tracking Dashboard Ppt Show Picture PDF and observe how to make your presentation outstanding. Give an impeccable presentation to your group and make your presentation unforgettable.
Facebook Ad Campaign Performance Tracking Dashboard Ppt Ideas Objects PDF
This slide represents the KPI dashboard to effectively measure and monitor performance of Facebook marketing campaign conducted by the organization to enhance customer engagement. It includes details related to KPIs such as ad impressions, ad reach etc. Are you in need of a template that can accommodate all of your creative concepts This one is crafted professionally and can be altered to fit any style. Use it with Google Slides or PowerPoint. Include striking photographs, symbols, depictions, and other visuals. Fill, move around, or remove text boxes as desired. Test out color palettes and font mixtures. Edit and save your work, or work with colleagues. Download Facebook Ad Campaign Performance Tracking Dashboard Ppt Ideas Objects PDF and observe how to make your presentation outstanding. Give an impeccable presentation to your group and make your presentation unforgettable.

Arrow Diagram Highlighting Software Quality Control Planning Templates Set 1 Guidelines PDF
Following slide illustrate arrow diagram that highlight software development process starting from formalize specifications to release hardware, tutorials and software.Are you in need of a template that can accommodate all of your creative concepts This one is crafted professionally and can be altered to fit any style. Use it with Google Slides or PowerPoint. Include striking photographs, symbols, depictions, and other visuals. Fill, move around, or remove text boxes as desired. Test out color palettes and font mixtures. Edit and save your work, or work with colleagues. Download Arrow Diagram Highlighting Software Quality Control Planning Templates Set 1 Guidelines PDF and observe how to make your presentation outstanding. Give an impeccable presentation to your group and make your presentation unforgettable.

New Staff Induction Timeline With Key Stages Inspiration PDF
This slide shows new employee induction timeline with key phases. It provides information about pre arrival, initial paperwork, information, work task assignment and day end. Showcasing this set of slides titled New Staff Induction Timeline With Key Stages Inspiration PDF. The topics addressed in these templates are New Staff Induction Timeline With Key Stages. All the content presented in this PPT design is completely editable. Download it and make adjustments in color, background, font etc. as per your unique business setting.
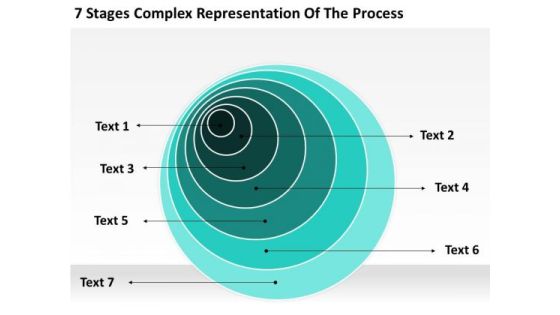
Complex Representation Of The Process Printable Business Plan Template PowerPoint Templates
We present our complex representation of the process printable business plan template PowerPoint templates.Use our Process and Flows PowerPoint Templates because You have a driving passion to excel in your field. Our PowerPoint Templates and Slides will prove ideal vehicles for your ideas. Download and present our Flow Charts PowerPoint Templates because Our PowerPoint Templates and Slides will steer your racing mind. Hit the right buttons and spur on your audience. Use our Business PowerPoint Templates because It can Leverage your style with our PowerPoint Templates and Slides. Charm your audience with your ability. Present our Shapes PowerPoint Templates because Our PowerPoint Templates and Slides help you meet the demand of the Market. Just browse and pick the slides that appeal to your intuitive senses. Download our Marketing PowerPoint Templates because Our PowerPoint Templates and Slides will let you Hit the right notes. Watch your audience start singing to your tune.Use these PowerPoint slides for presentations relating to Abstract, background, bright, communicate, communication, complex, conceptual, connect, decorative, design, detail,diamond, dimension, elaborate, fractal, future, information, intricate, join, line, link, many, matrix, mesh, multiple, net, numerous, pattern, physics, portrait, science, shape, technology, texture, turquoise. The prominent colors used in the PowerPoint template are Green, White, Black.
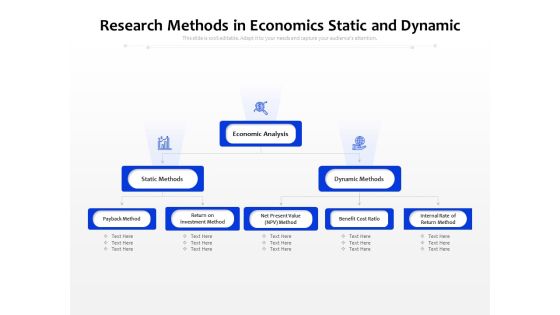
Research Methods In Economics Static And Dynamic Ppt PowerPoint Presentation File Shapes PDF
Presenting this set of slides with name research methods in economics static and dynamic ppt powerpoint presentation file shapes pdf. This is a three stage process. The stages in this process are economic analysis, static methods, dynamic methods, payback method, return on investment method, net present value npv method, benefit cost ratio, internal rate of return method . This is a completely editable PowerPoint presentation and is available for immediate download. Download now and impress your audience.

Performance Gap In Desired And Actual Position Ppt Powerpoint Presentation Professional Ideas Pdf
Persuade your audience using this performance gap in desired and actual position ppt powerpoint presentation professional ideas pdf. This PPT design covers four stages, thus making it a great tool to use. It also caters to a variety of topics including diversification, market development, market penetration, product development, gap analysis, desired position, actual position, market share. Download this PPT design now to present a convincing pitch that not only emphasizes the topic but also showcases your presentation skills.

Software Risk Mitigation Procedure With Planning And Priortization Ppt PowerPoint Presentation Gallery Show PDF
Persuade your audience using this software risk mitigation procedure with planning and priortization ppt powerpoint presentation gallery show pdf. This PPT design covers nine stages, thus making it a great tool to use. It also caters to a variety of topics including software risk management, risk assessment, risk control, risk identification, risk analysis, risk prioritization, risk planning, risk resolution, risk monitoring. Download this PPT design now to present a convincing pitch that not only emphasizes the topic but also showcases your presentation skills.

Strategies To Enhance Managed Service Business Add More Services In The Organization Diagrams PDF
This slide covers the additional service which a company must introduce to grow in the industry such as cybersecurity services, network operation center monitoring, mobile device management solution, VoIP technology. This modern and well arranged Strategies To Enhance Managed Service Business Add More Services In The Organization Diagrams PDF provides lots of creative possibilities. It is very simple to customize and edit with the Powerpoint Software. Just drag and drop your pictures into the shapes. All facets of this template can be edited with Powerpoint no extra software is necessary. Add your own material, put your images in the places assigned for them, adjust the colors, and then you can show your slides to the world, with an animated slide included.

Bar Graph Ppt PowerPoint Presentation Example 2015
This is a bar graph ppt powerpoint presentation example 2015. This is a two stage process. The stages in this process are bar graph, finance, marketing, analysis, business.

Hierarchy Ppt PowerPoint Presentation Shapes
This is a hierarchy ppt powerpoint presentation shapes. This is a three stage process. The stages in this process are hierarchy, management, analysis, strategy, business.

Stacked Bar Template 2 Ppt PowerPoint Presentation Deck
This is a stacked bar template 2 ppt powerpoint presentation deck. This is a two stage process. The stages in this process are business, strategy, analysis, marketing, finance.
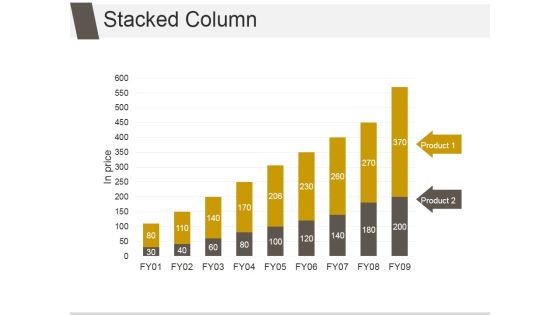
Stacked Column Ppt PowerPoint Presentation Layout
This is a stacked column ppt powerpoint presentation layout. This is a nine stage process. The stages in this process are business, strategy, analysis, marketing, finance, growth.

Distribution Strategy Ppt PowerPoint Presentation File Images
This is a distribution strategy ppt powerpoint presentation file images. This is a seven stage process. The stages in this process are business, strategy, marketing, analysis, circle process.

Stacked Column Ppt PowerPoint Presentation Infographic Template Graphics
This is a stacked column ppt powerpoint presentation infographic template graphics. This is a nine stage process. The stages in this process are business, marketing, finance, analysis, planning.
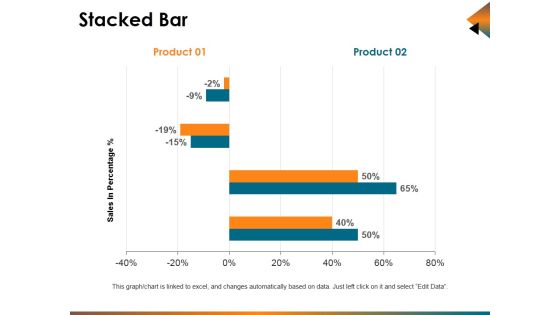
Stacked Bar Ppt PowerPoint Presentation Summary File Formats
This is a stacked bar ppt powerpoint presentation summary file formats. This is a four stage process. The stages in this process are business, marketing, finance, bar, analysis.
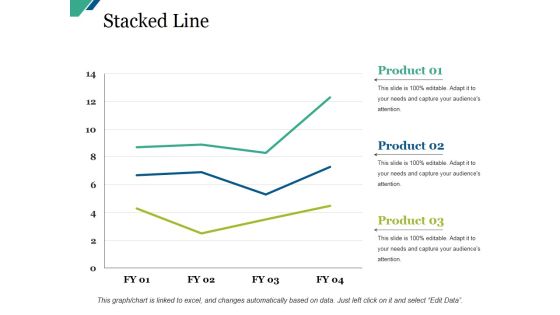
Stacked Line Ppt PowerPoint Presentation Show Design Inspiration
This is a stacked line ppt powerpoint presentation show design inspiration. This is a three stage process. The stages in this process are business, marketing, graph, finance, analysis.
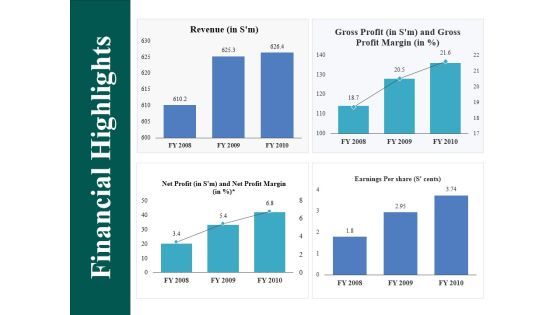
Financial Highlights Ppt PowerPoint Presentation Professional Graphics Example
This is a financial highlights ppt powerpoint presentation professional graphics example. This is a four stage process. The stages in this process are business, finance, planning, strategy, analysis.

Stacked Column Ppt PowerPoint Presentation Gallery Gridlines
This is a stacked column ppt powerpoint presentation gallery gridlines. This is a two stage process. The stages in this process are stacked column, finance, marketing, analysis, business.

Financial Ppt Powerpoint Presentation Ideas Example
This is a financial ppt powerpoint presentation ideas example. This is a three stage process. The stages in this process are business, finance, analysis, marketing, strategy.

Experience Projects Ppt PowerPoint Presentation Outline Guide
This is a experience projects ppt powerpoint presentation outline guide. This is a four stage process. The stages in this process are business, finance, marketing, strategy, analysis.
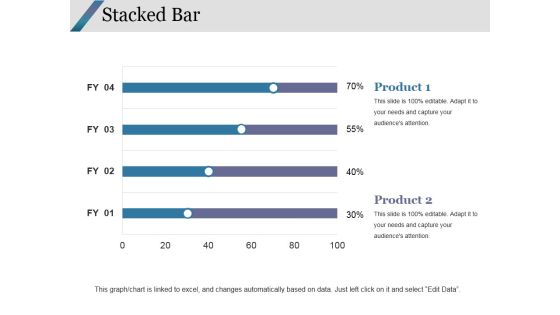
Stacked Bar Ppt PowerPoint Presentation Summary
This is a stacked bar ppt powerpoint presentation summary. This is a four stage process. The stages in this process are stacked bar, finance, analysis, business, marketing.
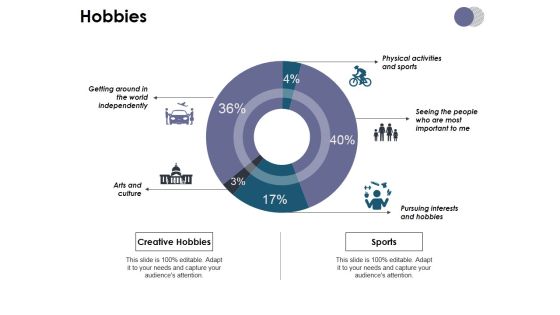
Hobbies Ppt PowerPoint Presentation Slides Master Slide
This is a hobbies ppt powerpoint presentation slides master slide. This is a five stage process. The stages in this process are business, finance, analysis, marketing, investment.

Clustered Bar Ppt PowerPoint Presentation Slides Show
This is a clustered bar ppt powerpoint presentation slides show. This is a three stage process. The stages in this process are finance, analysis, business, strategy, marketing.

Stacked Bar Ppt PowerPoint Presentation Professional Guidelines
This is a stacked bar ppt powerpoint presentation professional guidelines. This is a two stage process. The stages in this process are stacked bar, finance, analysis, business, marketing.

Clustered Bar Ppt PowerPoint Presentation Infographic Template Grid
This is a clustered bar ppt powerpoint presentation infographic template grid. This is a two stage process. The stages in this process are finance, analysis, marketing, business, strategy.

Financial Ppt PowerPoint Presentation Model Maker
This is a financial ppt powerpoint presentation model maker. This is a three stage process. The stages in this process are finance, business, marketing, strategy, analysis.
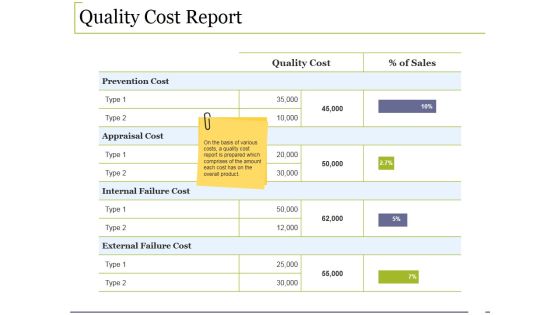
Quality Cost Report Ppt PowerPoint Presentation Summary Show
This is a quality cost report ppt powerpoint presentation summary show. This is a five stage process. The stages in this process are finance, analysis, strategy, business, marketing.

Stacked Column Ppt PowerPoint Presentation Outline Template
This is a stacked column ppt powerpoint presentation outline template. This is a two stage process. The stages in this process are stacked column, finance, analysis, management, business.

Filled Area Ppt PowerPoint Presentation Layouts Templates
This is a filled area ppt powerpoint presentation layouts templates. This is a two stage process. The stages in this process are filled area, finance, analysis, business, marketing.

Stacked Bar Ppt PowerPoint Presentation Ideas Inspiration
This is a stacked bar ppt powerpoint presentation ideas inspiration. This is a two stage process. The stages in this process are stacked bar, finance, marketing, analysis, business.
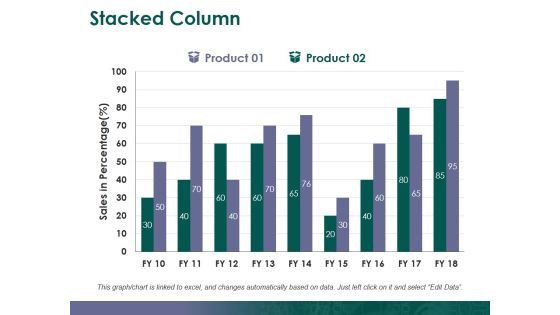
Stacked Column Ppt PowerPoint Presentation Gallery Graphics
This is a stacked column ppt powerpoint presentation gallery graphics. This is a two stage process. The stages in this process are stacked column, finance, analysis, business, marketing.

Income Statement Overview Ppt PowerPoint Presentation Model Example
This is a income statement overview ppt powerpoint presentation model example. This is a five stage process. The stages in this process are business, finance, marketing, strategy, analysis.

Activity Ratios Ppt PowerPoint Presentation Slides Layout
This is a activity ratios ppt powerpoint presentation slides layout. This is a two stage process. The stages in this process are business, finance, analysis, strategy, marketing.
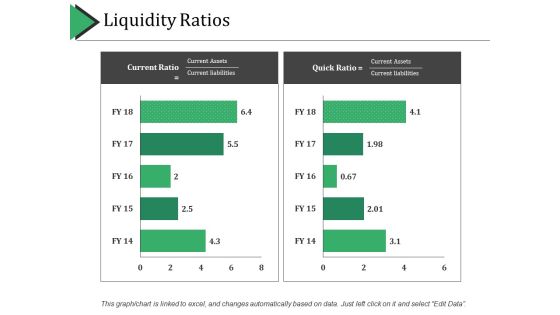
Liquidity Ratios Ppt PowerPoint Presentation Professional Ideas
This is a liquidity ratios ppt powerpoint presentation professional ideas. This is a two stage process. The stages in this process are business, finance, marketing, strategy, analysis.
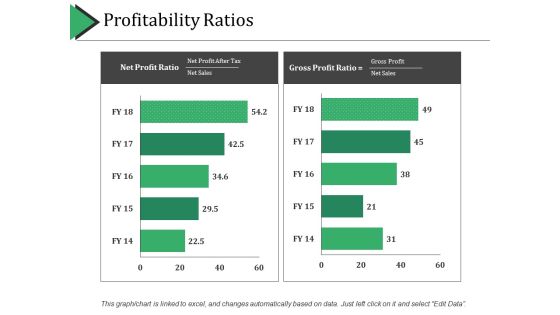
Profitability Ratios Ppt PowerPoint Presentation Layouts Gridlines
This is a profitability ratios ppt powerpoint presentation layouts gridlines. This is a two stage process. The stages in this process are business, finance, marketing, strategy, analysis.

Clustered Bar Ppt PowerPoint Presentation Model Gridlines
This is a clustered bar ppt powerpoint presentation model gridlines. This is a four stage process. The stages in this process are finance, marketing, analysis, management, planning.

Bar Graph Ppt PowerPoint Presentation File Display
This is a bar graph ppt powerpoint presentation file display. This is a four stage process. The stages in this process are bar graph, marketing, strategy, finance, analysis.

Predictive Analytics Benefits Ppt PowerPoint Presentation Professional Samples
This is a predictive analytics benefits ppt powerpoint presentation professional samples. This is a five stage process. The stages in this process are business, finance, marketing, strategy, analysis.

Clustered Column Ppt PowerPoint Presentation Gallery Microsoft
This is a clustered column ppt powerpoint presentation gallery microsoft. This is a two stage process. The stages in this process are clustered column, finance, marketing, strategy, analysis.

Clustered Bar Ppt PowerPoint Presentation Professional Guidelines
This is a clustered bar ppt powerpoint presentation professional guidelines. This is a three stage process. The stages in this process are clustered bar, finance, marketing, strategy, analysis.

Clustered Bar Ppt PowerPoint Presentation Outline Templates
This is a clustered bar ppt powerpoint presentation outline templates. This is a three stage process. The stages in this process are business, finance, analysis, management, marketing.

Clustered Bar Ppt PowerPoint Presentation Layouts Tips
This is a clustered bar ppt powerpoint presentation layouts tips. This is a three stage process. The stages in this process are clustered bar, finance, marketing, management, analysis.

Bar Graphs Ppt PowerPoint Presentation Gallery Elements
This is a bar graphs ppt powerpoint presentation gallery elements. This is a two stage process. The stages in this process are Bar Graphs, Business, Strategy, Marketing, Analysis.

Clustered Column Ppt PowerPoint Presentation Infographics Picture
This is a clustered column ppt powerpoint presentation infographics picture. This is a two stage process. The stages in this process are finance, marketing, management, investment, analysis.

Area Stacked Ppt PowerPoint Presentation Ideas Inspiration
This is a area stacked ppt powerpoint presentation ideas inspiration. This is a two stage process. The stages in this process are finance, marketing, management, investment, analysis.

Clustered Bar Ppt PowerPoint Presentation Summary Infographic Template
This is a clustered bar ppt powerpoint presentation summary infographic template. This is a three stage process. The stages in this process are finance, marketing, management, investment, analysis.
