Data Icon
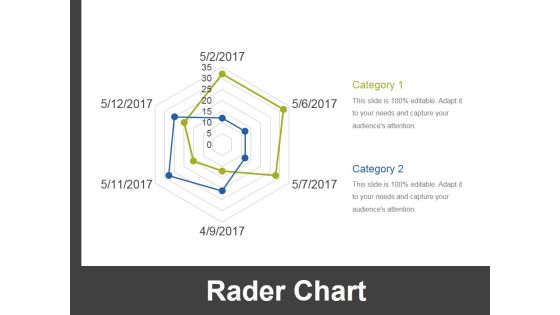
Rader Chart Ppt PowerPoint Presentation Pictures Slide Portrait
This is a rader chart ppt powerpoint presentation pictures slide portrait. This is a two stage process. The stages in this process are rader chart, management, analysis, strategy, business.

Scatter Chart Ppt PowerPoint Presentation Pictures Slide Download
This is a scatter chart ppt powerpoint presentation pictures slide download. This is a two stage process. The stages in this process are scatter chart, finance, analysis, marketing, business.

Stacked Line Chart Ppt PowerPoint Presentation Ideas Example File
This is a stacked line chart ppt powerpoint presentation ideas example file. This is a two stage process. The stages in this process are stacked line chart, growth, analysis, business, success.
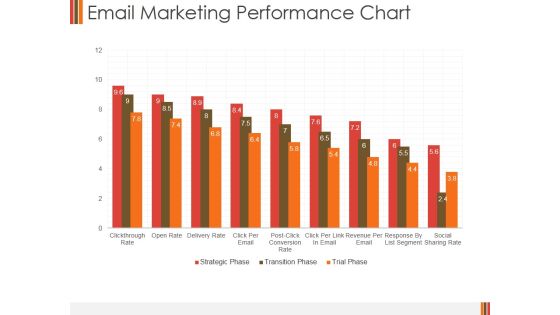
Email Marketing Performance Chart Ppt PowerPoint Presentation Portfolio Inspiration
This is a email marketing performance chart ppt powerpoint presentation portfolio inspiration. This is a nine stage process. The stages in this process are business, finance, marketing, performance chart, strategy, analysis.

Donut Pie Chart Ppt PowerPoint Presentation Summary Guide
This is a donut pie chart ppt powerpoint presentation summary guide. This is a four stage process. The stages in this process are pie chart, marketing, strategy, finance, analysis, business.

Column Chart Template 1 Ppt PowerPoint Presentation Professional Backgrounds
This is a column chart template 1 ppt powerpoint presentation professional backgrounds. This is a nine stage process. The stages in this process are column chart, product, growth, strategy, analysis, business.

Column Chart Template 2 Ppt PowerPoint Presentation Professional Slide
This is a column chart template 2 ppt powerpoint presentation professional slide. This is a nine stage process. The stages in this process are column chart, product, growth, strategy, analysis, business.
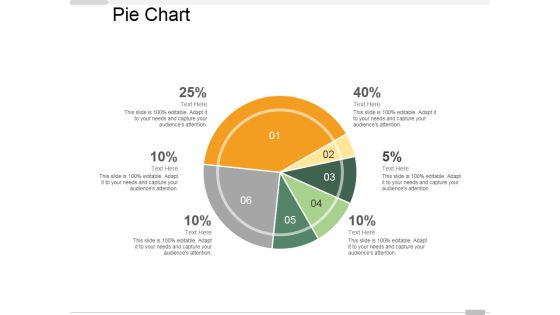
Pie Chart Ppt PowerPoint Presentation Infographic Template Master Slide
This is a pie chart ppt powerpoint presentation infographic template master slide. This is a six stage process. The stages in this process are pie chart, marketing, finance, analysis, business.
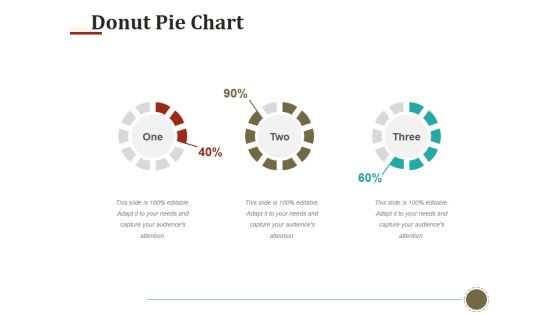
Donut Pie Chart Ppt PowerPoint Presentation Layouts Templates
This is a donut pie chart ppt powerpoint presentation layouts templates. This is a three stage process. The stages in this process are donut pie chart, finance, marketing, strategy, analysis, business.

Line Chart Ppt PowerPoint Presentation Summary Graphic Tips
This is a line chart ppt powerpoint presentation summary graphic tips. This is a two stage process. The stages in this process are line chart, product, in percentage, analysis, business.
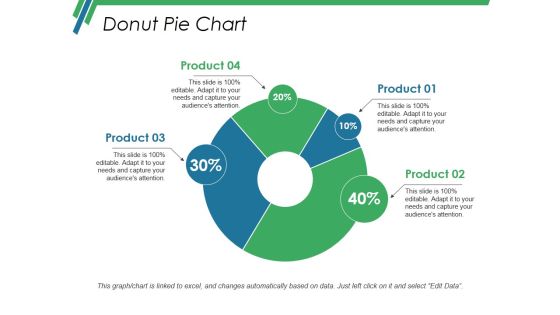
Donut Pie Chart Ppt PowerPoint Presentation Infographic Template Vector
This is a donut pie chart ppt powerpoint presentation infographic template vector. This is a four stage process. The stages in this process are donut pie chart, finance, analysis, business, strategy.
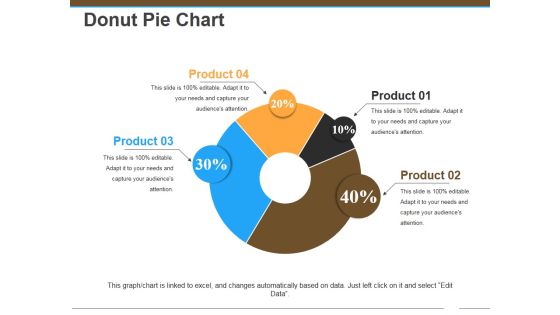
Donut Pie Chart Ppt Powerpoint Presentation Pictures Graphics Design
This is a donut pie chart ppt powerpoint presentation pictures graphics design. This is a four stage process. The stages in this process are donut pie chart, business, finance, management, analysis.
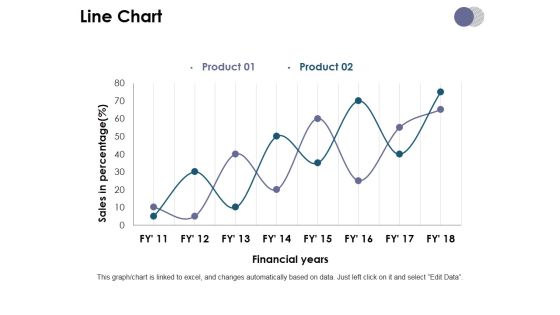
Line Chart Ppt PowerPoint Presentation Model Slide Download
This is a line chart ppt powerpoint presentation model slide download. This is a two stage process. The stages in this process are line chart, growth, finance, analysis, business.
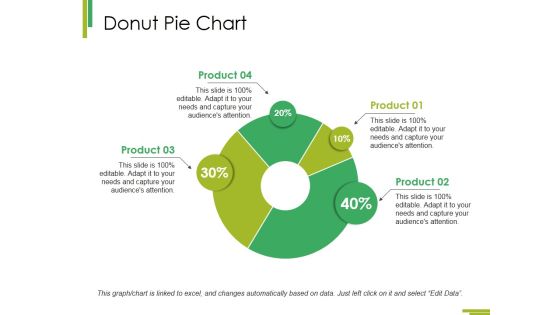
Donut Pie Chart Ppt PowerPoint Presentation Show Visual Aids
This is a donut pie chart ppt powerpoint presentation show visual aids. This is a four stage process. The stages in this process are donut pie chart, business, marketing, analysis, finance.
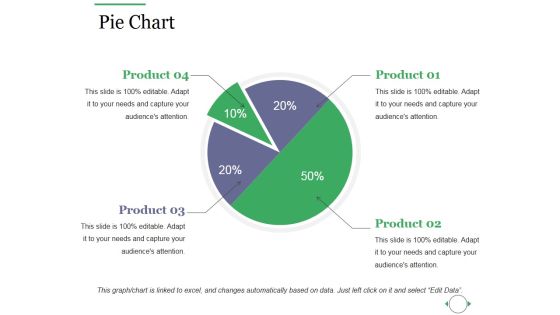
Pie Chart Ppt PowerPoint Presentation Infographic Template Summary
This is a pie chart ppt powerpoint presentation infographic template summary. This is a four stage process. The stages in this process are pie chart, marketing, strategy, analysis, business.

Stacked Line Chart Ppt PowerPoint Presentation Summary Graphics Pictures
This is a stacked line chart ppt powerpoint presentation summary graphics pictures. This is a two stage process. The stages in this process are stacked line chart, growth, analysis, finance, business.

Line Chart Ppt PowerPoint Presentation Infographics File Formats
This is a line chart ppt powerpoint presentation infographics file formats. This is a two stage process. The stages in this process are line chart, growth, strategy, analysis, business.

Line Chart Ppt PowerPoint Presentation Inspiration Graphics Tutorials
This is a line chart ppt powerpoint presentation inspiration graphics tutorials. This is a two stage process. The stages in this process are line chart, growth, strategy, analysis, business.

Pie Chart Ppt PowerPoint Presentation Infographic Template Vector
This is a pie chart ppt powerpoint presentation infographic template vector. This is a five stage process. The stages in this process are pie chart, finance, analysis, investment, business.

Radar Chart Ppt PowerPoint Presentation Infographic Template Visuals
This is a radar chart ppt powerpoint presentation infographic template visuals. This is a two stage process. The stages in this process are radar chart, finance, business, marketing, analysis.
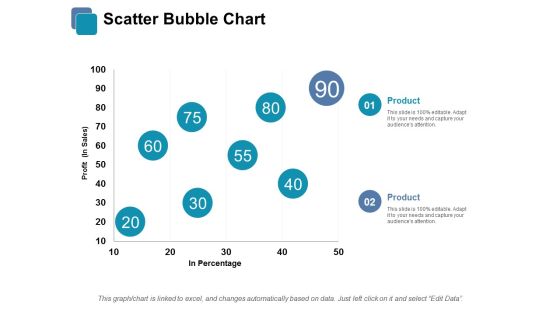
Scatter Bubble Chart Ppt PowerPoint Presentation Infographic Template Infographics
This is a scatter bubble chart ppt powerpoint presentation infographic template infographics. This is a two stage process. The stages in this process are scatter bubble chart, finance, business, marketing, analysis.

Area Chart Finance Ppt PowerPoint Presentation Ideas Slideshow
This is a area chart finance ppt powerpoint presentation ideas slideshow. This is a two stage process. The stages in this process are area chart, analysis, finance, marketing, management.

Clustered Bar Chart Finance Ppt PowerPoint Presentation Styles Design Inspiration
This is a clustered bar chart finance ppt powerpoint presentation styles design inspiration. This is a two stage process. The stages in this process are clustered bar chart, finance, business, analysis, investment.

Bubble Chart Finance Ppt PowerPoint Presentation File Graphics
This is a bubble chart finance ppt powerpoint presentation file graphics. This is a two stage process. The stages in this process are bubble chart, finance, marketing, analysis, investment.

Combo Chart Finance Ppt PowerPoint Presentation Slides Backgrounds
This is a combo chart finance ppt powerpoint presentation slides backgrounds. This is a three stage process. The stages in this process are combo chart, finance, marketing, analysis, business.

Bar Chart Finance Ppt Powerpoint Presentation Styles Skills
This is a bar chart finance ppt powerpoint presentation styles skills. This is a three stage process. The stages in this process are bar chart, finance, marketing, management, analysis.

Donut Chart Finance Ppt Powerpoint Presentation Infographic Template Slide Download
This is a donut chart finance ppt powerpoint presentation infographic template slide download. This is a three stage process. The stages in this process are donut chart, finance, marketing, management, analysis.

Bar Chart Finance Marketing Ppt PowerPoint Presentation Portfolio Slide
This is a bar chart finance marketing ppt powerpoint presentation portfolio slide. This is a two stage process. The stages in this process are bar chart, finance, marketing, business, analysis.

Combo Chart Finance Ppt PowerPoint Presentation Outline Example
This is a combo chart finance ppt powerpoint presentation outline example. This is a three stage process. The stages in this process are bar chart, finance, marketing, business, analysis.

Stacked Column Chart Ppt PowerPoint Presentation Professional Aids
This is a stacked column chart ppt powerpoint presentation professional aids. This is a three stage process. The stages in this process are bar chart, finance, marketing, business, analysis.

Combo Chart Finance Marketing Ppt PowerPoint Presentation Layouts Design Templates
This is a combo chart finance marketing ppt powerpoint presentation layouts design templates. This is a three stage process. The stages in this process are combo chart, finance, marketing, business, analysis.

Business Identity Dashboard Indicating Corporate Marketing Kpis Diagrams PDF
This slide shows business identity dashboard indicating brand marketing performance metrics. It contains details about brand metrics, advertisement metrics and purchase metrics. It also includes details from brand awareness to repeat purchase. Showcasing this set of slides titled Business Identity Dashboard Indicating Corporate Marketing Kpis Diagrams PDF. The topics addressed in these templates are Purchase, Engagement, Market Share. All the content presented in this PPT design is completely editable. Download it and make adjustments in color, background, font etc. as per your unique business setting.

Quarterly Evaluation Of Change In Startup Funding Mix Diagrams PDF
The following slide showcases the change in the funding mix as compared to the quarter 1 to 4 for the year 2021. It constitutes of various components such as deposits, long term unsecured debt, secured funding etc. Showcasing this set of slides titled Quarterly Evaluation Of Change In Startup Funding Mix Diagrams PDF. The topics addressed in these templates are Secured Funding, Term Unsecured Debt, Shareholder Equity. All the content presented in this PPT design is completely editable. Download it and make adjustments in color, background, font etc. as per your unique business setting.
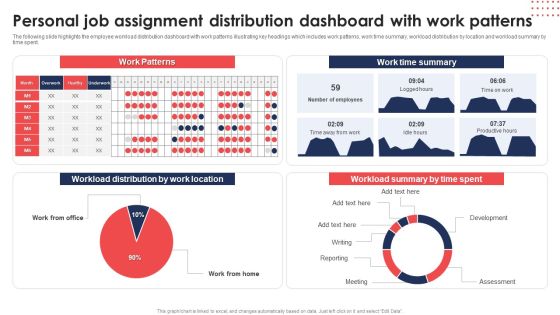
Personal Job Assignment Distribution Dashboard With Work Patterns Diagrams PDF
The following slide highlights the employee workload distribution dashboard with work patterns illustrating key headings which includes work patterns, work time summary, workload distribution by location and workload summary by time spent. Showcasing this set of slides titled Personal Job Assignment Distribution Dashboard With Work Patterns Diagrams PDF. The topics addressed in these templates are Work Patterns, Workload Distribution, Work Location. All the content presented in this PPT design is completely editable. Download it and make adjustments in color, background, font etc. as per your unique business setting.

Health Insurance Company Expenses Of Operation Expenses Diagrams PDF
This slide shows the 3 years distribution of operating expenditure in health insurance to control drug related issues and extra expenses. This includes hospital and medical benefits , professional fees, etc.Showcasing this set of slides titled Health Insurance Company Expenses Of Operation Expenses Diagrams PDF. The topics addressed in these templates are Percentage Total Expenses, Propessional Fees, Emergency Room. All the content presented in this PPT design is completely editable. Download it and make adjustments in color, background, font etc. as per your unique business setting.
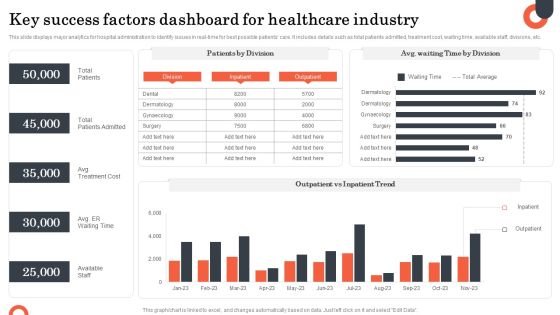
Key Success Factors Dashboard For Healthcare Industry Diagrams PDF
This slide displays major analytics for hospital administration to identify issues in real-time for best possible patients care. It includes details such as total patients admitted, treatment cost, waiting time, available staff, divisions, etc. Showcasing this set of slides titled Key Success Factors Dashboard For Healthcare Industry Diagrams PDF. The topics addressed in these templates are Success Factors, Total Patients, Total Patients Admitted, Available Staff. All the content presented in this PPT design is completely editable. Download it and make adjustments in color, background, font etc. as per your unique business setting.

Key Success Factors With Revenues And Customer Overview Diagrams PDF
This slide displays dashboard to review progress of entire organization by tracking actual performance and comparing it with targets set by organization. It further includes details about number of new consumers, percentage target achieved, customer acquisition cost and lifetime value, etc. Showcasing this set of slides titled Key Success Factors With Revenues And Customer Overview Diagrams PDF. The topics addressed in these templates are Compared Pervious Year, Customer Acquisition Cost. All the content presented in this PPT design is completely editable. Download it and make adjustments in color, background, font etc. as per your unique business setting.
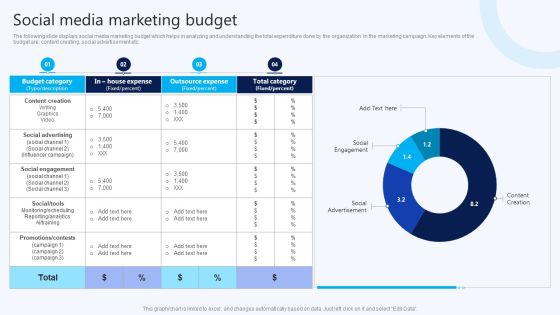
Social Media Marketing Budget B2B Electronic Commerce Startup Diagrams PDF
The following slide displays social media marketing budget which helps in analyzing and understanding the total expenditure done by the organization in the marketing campaign. Key elements of the budget are content creating, social advertisement etc. From laying roadmaps to briefing everything in detail, our templates are perfect for you. You can set the stage with your presentation slides. All you have to do is download these easy-to-edit and customizable templates. Social Media Marketing Budget B2B Electronic Commerce Startup Diagrams PDF will help you deliver an outstanding performance that everyone would remember and praise you for. Do download this presentation today.

Storage Facility Orders Productivity Management Dashboard Diagrams PDF
This slide showcases a dashboard for tracking and managing orders productivity performance at warehouse. It includes key components such as collection time, daily orders, number of workers per shift, top ordered products and least ordered products. Showcasing this set of slides titled Storage Facility Orders Productivity Management Dashboard Diagrams PDF. The topics addressed in these templates are Top Most Ordered Products, Least Ordered Products, Orders Per Day. All the content presented in this PPT design is completely editable. Download it and make adjustments in color, background, font etc. as per your unique business setting.
Storage Facility Productivity Tracking And Management System Dashboard Diagrams PDF
This slide showcases a dashboard for managing and tracking warehouse productivity to optimize operational process. It includes key components such as user registered, subscribers request, orders, sales, transaction summary and top profiles. Showcasing this set of slides titled Storage Facility Productivity Tracking And Management System Dashboard Diagrams PDF. The topics addressed in these templates are Transaction Summary, Registered Users, Tracking Management. All the content presented in this PPT design is completely editable. Download it and make adjustments in color, background, font etc. as per your unique business setting.
Lead Tracking Metrics Dashboard With User Responses Diagrams PDF
This slide showcases dashboard for lead conversion metrics that can help organization to filter out total leads interested from the leads who have responded to the phone calls by organization. It also showcases key metrics such as leads busiest hours, leads busiest days, phone number types and lead types. Showcasing this set of slides titled Lead Tracking Metrics Dashboard With User Responses Diagrams PDF. The topics addressed in these templates are Busiest Hours Leads, Conversion Metrics, Lead Types. All the content presented in this PPT design is completely editable. Download it and make adjustments in color, background, font etc. as per your unique business setting.
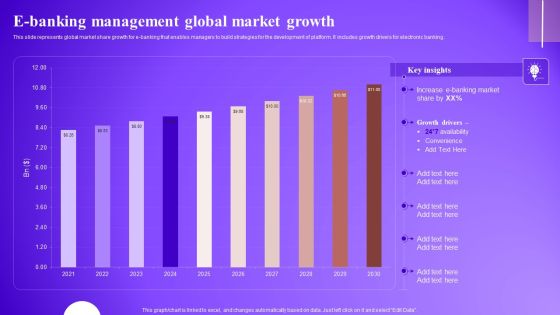
E Banking Management Global Market Growth Diagrams PDF
This slide represents global market share growth for e banking that enables managers to build strategies for the development of platform. It includes growth drivers for electronic banking. Boost your pitch with our creative E Banking Management Global Market Growth Diagrams PDF. Deliver an awe inspiring pitch that will mesmerize everyone. Using these presentation templates you will surely catch everyones attention. You can browse the ppts collection on our website. We have researchers who are experts at creating the right content for the templates. So you do not have to invest time in any additional work. Just grab the template now and use them.

Company Payout Dashboard For Tracking Expenses And Transactions Diagrams PDF
The slide highlights the dashboard to effectively manage day-to-day payments. Various elements included are wallet, last week transaction, amount receivable, payable, total invoices and previous transactions. Showcasing this set of slides titled Company Payout Dashboard For Tracking Expenses And Transactions Diagrams PDF. The topics addressed in these templates are Last Week Transaction, Your Wallet, Total Invoices, Invoice Done. All the content presented in this PPT design is completely editable. Download it and make adjustments in color, background, font etc. as per your unique business setting.
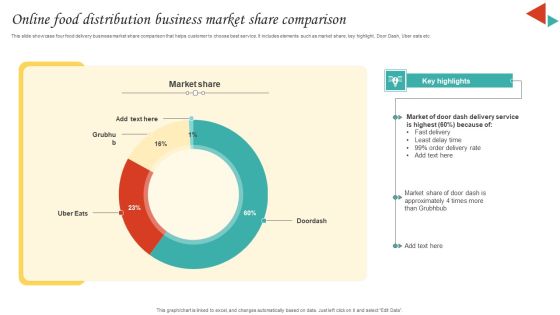
Online Food Distribution Business Market Share Comparison Diagrams PDF
This slide showcase four food delivery business market share comparison that helps customer to choose best service. It includes elements such as market share, key highlight, Door Dash, Uber eats etc. Showcasing this set of slides titled Online Food Distribution Business Market Share Comparison Diagrams PDF. The topics addressed in these templates are Market Share, Delivery Service, Least Delay Time. All the content presented in this PPT design is completely editable. Download it and make adjustments in color, background, font etc. as per your unique business setting.

Merchant Performance Report With Rating And Status Diagrams PDF
The purpose of this slide is to measure the performance and effectiveness of vendors and suppliers who provides goods or services to the company. Certain metrics include quality, delivery, cost, local factors, and order count. Showcasing this set of slides titled Merchant Performance Report With Rating And Status Diagrams PDF. The topics addressed in these templates are Merchant Performance Report, Rating And Status. All the content presented in this PPT design is completely editable. Download it and make adjustments in color, background, font etc. as per your unique business setting.

Enhancing Buyer Journey Assessment Of Current Customer Services Diagrams PDF
This slide highlight the results of current customer support services that represents the key major concerns such as poor customer service, low retention rate, and increasing call duration time etc. Boost your pitch with our creative Enhancing Buyer Journey Assessment Of Current Customer Services Diagrams PDF. Deliver an awe inspiring pitch that will mesmerize everyone. Using these presentation templates you will surely catch everyones attention. You can browse the ppts collection on our website. We have researchers who are experts at creating the right content for the templates. So you do not have to invest time in any additional work. Just grab the template now and use them.

Comparison Of HDI On Different Parameters Diagrams PDF
Following slides shows the summary of the human development index comparing many factors which will assist in comparing with rest of the world on income inequality parameters . It took the tenure from 2017 to 2022. Showcasing this set of slides titled Comparison Of HDI On Different Parameters Diagrams PDF. The topics addressed in these templates are Inequality Primary Components, Plus Loss Income Inequality, Different Parameters . All the content presented in this PPT design is completely editable. Download it and make adjustments in color, background, font etc. as per your unique business setting.
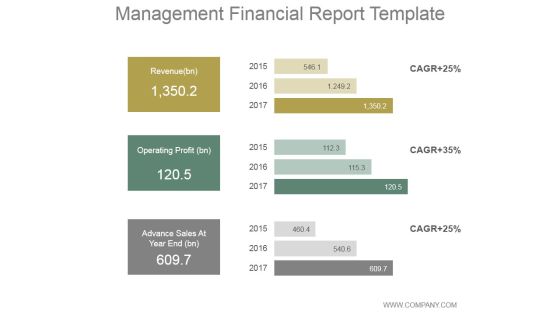
Management Financial Report Ppt PowerPoint Presentation Diagrams
This is a management financial report ppt powerpoint presentation diagrams. This is a three stage process. The stages in this process are revenue, operating profit, advance sales at year end.

Campaign Report Ppt PowerPoint Presentation Infographics Diagrams
This is a campaign report ppt powerpoint presentation infographics diagrams. This is a nine stage process. The stages in this process are email name, send date, recipients, delivered, spam, transactions.
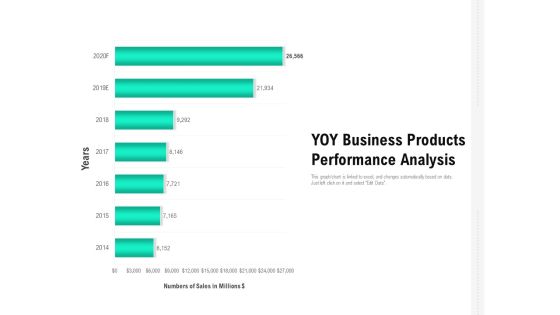
YOY Business Products Performance Analysis Ppt PowerPoint Presentation Infographic Template Design Templates PDF
Pitch your topic with ease and precision using this yoy business products performance analysis ppt powerpoint presentation infographic template design templates pdf. This layout presents information on yoy business products performance analysis. It is also available for immediate download and adjustment. So, changes can be made in the color, design, graphics or any other component to create a unique layout.

ABC Analysis Layout With Dollar Value Ppt PowerPoint Presentation Infographic Template Gridlines PDF
Pitch your topic with ease and precision using this abc analysis layout with dollar value ppt powerpoint presentation infographic template gridlines pdf. This layout presents information on abc analysis layout with dollar value. It is also available for immediate download and adjustment. So, changes can be made in the color, design, graphics or any other component to create a unique layout.
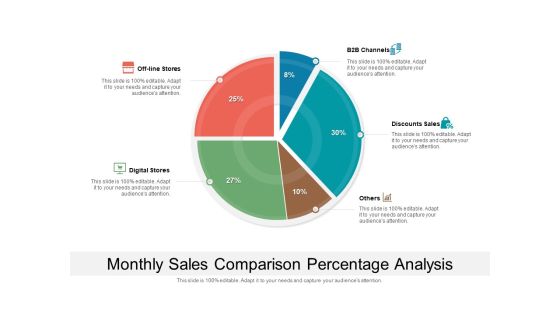
Monthly Sales Comparison Percentage Analysis Ppt PowerPoint Presentation File Infographic Template PDF
Pitch your topic with ease and precision using this monthly sales comparison percentage analysis ppt powerpoint presentation file infographic template pdf. This layout presents information on monthly sales comparison percentage analysis. It is also available for immediate download and adjustment. So, changes can be made in the color, design, graphics or any other component to create a unique layout.
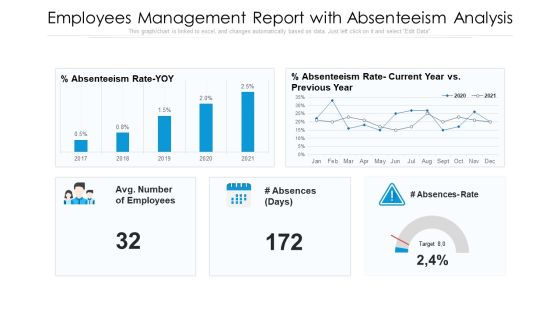
Employees Management Report With Absenteeism Analysis Ppt PowerPoint Presentation Gallery Example Topics PDF
Pitch your topic with ease and precision using this employees management report with absenteeism analysis ppt powerpoint presentation gallery example topics pdf. This layout presents information on employees management report with absenteeism analysis. It is also available for immediate download and adjustment. So, changes can be made in the color, design, graphics or any other component to create a unique layout.

Spend Analysis Of Traditional And Online Media Ppt Professional Show PDF
Pitch your topic with ease and precision using this spend analysis of traditional and online media ppt professional show pdf. This layout presents information on spend analysis of traditional and online media . It is also available for immediate download and adjustment. So, changes can be made in the color, design, graphics or any other component to create a unique layout.
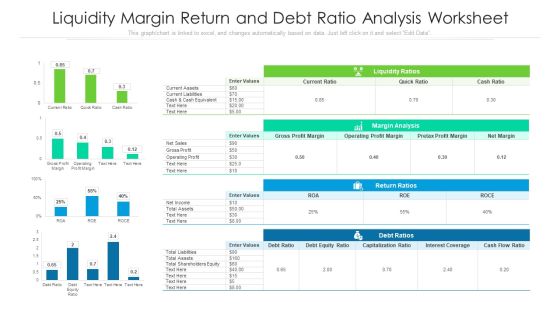
Liquidity Margin Return And Debt Ratio Analysis Worksheet Ppt PowerPoint Presentation File Design Ideas PDF
Pitch your topic with ease and precision using this liquidity margin return and debt ratio analysis worksheet ppt powerpoint presentation file design ideas pdf. This layout presents information on liquidity ratios, margin analysis, return ratios. It is also available for immediate download and adjustment. So, changes can be made in the color, design, graphics or any other component to create a unique layout.
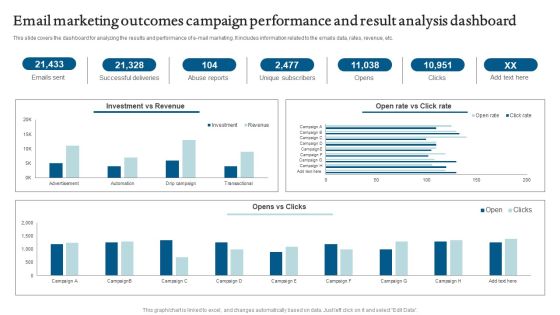
Email Marketing Outcomes Campaign Performance And Result Analysis Dashboard Introduction PDF
Pitch your topic with ease and precision using this Email Marketing Outcomes Campaign Performance And Result Analysis Dashboard Introduction PDF. This layout presents information on Email Marketing Outcomes, Campaign Performance, Result Analysis Dashboard. It is also available for immediate download and adjustment. So, changes can be made in the color, design, graphics or any other component to create a unique layout.

Diagram For Business Operation Management Ppt Plan Professional PowerPoint Templates
We present our diagram for business operation management ppt plan professional PowerPoint templates.Use our Arrows PowerPoint Templates because Watching this your Audience will Grab their eyeballs, they wont even blink. Download our Business PowerPoint Templates because You canTake a leap off the starting blocks with our PowerPoint Templates and Slides. They will put you ahead of the competition in quick time. Download and present our Process and Flows PowerPoint Templates because Our PowerPoint Templates and Slides are created with admirable insight. Use them and give your group a sense of your logical mind. Use our Marketing PowerPoint Templates because Our PowerPoint Templates and Slides will provide you a launch platform. Give a lift off to your ideas and send them into orbit. Download and present our Shapes PowerPoint Templates because Our PowerPoint Templates and Slides are specially created by a professional team with vast experience. They diligently strive to come up with the right vehicle for your brilliant Ideas. Use these PowerPoint slides for presentations relating to Business, chart, concept, diagram, planning, project, growth, abstract, banking, statistics, success, presentation, marketing, management, graph, illustration, sale, strategy, professional, competition, profit, background, work, commerce, advertising. The prominent colors used in the PowerPoint template are Gray, Blue light, Black.

Hospital Management System Healthcare Marketing Plan Diagrams PDF
Presenting hospital management system healthcare marketing plan diagrams pdf to provide visual cues and insights. Share and navigate important information on five stages that need your due attention. This template can be used to pitch topics like content performance measures, commercial measures, brand measures. In addtion, this PPT design contains high resolution images, graphics, etc, that are easily editable and available for immediate download.

Cashless Payment Strategies To Enhance Business Performance Best Practices Of QR Code Implementation Infographics PDF
Mentioned slide provides information about best practices which can be implemented by businesses to increase sales. It includes best practices such as Include call to action, personalize QR code, check code scannability, update content regularly. Are you searching for a Cashless Payment Strategies To Enhance Business Performance Best Practices Of QR Code Implementation Infographics PDF that is uncluttered, straightforward, and original Its easy to edit, and you can change the colors to suit your personal or business branding. For a presentation that expresses how much effort you have put in, this template is ideal With all of its features, including tables, diagrams, statistics, and lists, its perfect for a business plan presentation. Make your ideas more appealing with these professional slides. Download Cashless Payment Strategies To Enhance Business Performance Best Practices Of QR Code Implementation Infographics PDF from Slidegeeks today.

Presentation Process Diagram 10 Stages Create Business Plan PowerPoint Templates
We present our presentation process diagram 10 stages create business plan PowerPoint templates.Present our Circle Charts PowerPoint Templates because Our PowerPoint Templates and Slides has conjured up a web of all you need with the help of our great team. Use them to string together your glistening ideas. Present our Business PowerPoint Templates because Our PowerPoint Templates and Slides will effectively help you save your valuable time. They are readymade to fit into any presentation structure. Download our Shapes PowerPoint Templates because It is Aesthetically crafted by artistic young minds. Our PowerPoint Templates and Slides are designed to display your dexterity. Download and present our Success PowerPoint Templates because You should Kick up a storm with our PowerPoint Templates and Slides. The heads of your listeners will swirl with your ideas. Use our Process and Flows PowerPoint Templates because Our PowerPoint Templates and Slides are conceived by a dedicated team. Use them and give form to your wondrous ideas.Use these PowerPoint slides for presentations relating to process, closeup, model, white, consultant, concept, arrow, scope, presentation, finger, arm, diagram, analyst, analysis, drawing, female, management, expectation, diamond, time, project, money, girl, close up, direction, woman, group, person, quality, pointing, education, virtual, manager, explanation, screen, hand. The prominent colors used in the PowerPoint template are Pink, Gray, Black.


 Continue with Email

 Home
Home


