Data Icon
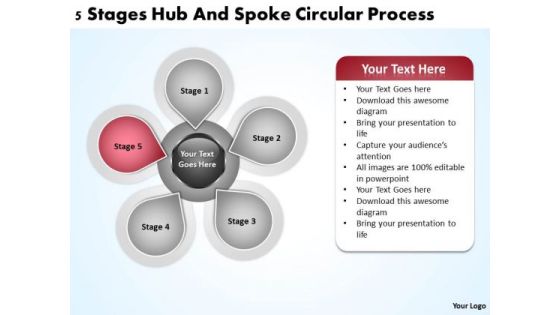
Business Development Process Diagram Ppt PowerPoint Templates Backgrounds For Slides
We present our business development process diagram ppt PowerPoint templates backgrounds for slides.Download our Ring Charts PowerPoint Templates because You can Connect the dots. Fan expectations as the whole picture emerges. Present our Circle Charts PowerPoint Templates because Our PowerPoint Templates and Slides will let your team Walk through your plans. See their energy levels rise as you show them the way. Download and present our Process and Flows PowerPoint Templates because Our PowerPoint Templates and Slides are topically designed to provide an attractive backdrop to any subject. Present our Shapes PowerPoint Templates because Our PowerPoint Templates and Slides offer you the needful to organise your thoughts. Use them to list out your views in a logical sequence. Download our Business PowerPoint Templates because our PowerPoint Templates and Slides will give your ideas the shape.Use these PowerPoint slides for presentations relating to Access, brochure, business, catalog, chart, circle,color, colorful, concept, conceptual, connection, corporate, creative, cycle, design,diagram, different, five, frame, graphic, group, idea, illustration,information, item, management, marketing, model, navigation, options, parts,piece, plan, presentation, report, round, shape, solution, speech, title, vector, web. The prominent colors used in the PowerPoint template are Red, Gray, Black.

Key Factors Affecting SEO Ranking On Search Engine Ppt Infographics Diagrams PDF
This slide represents major factors that impact SEO ranking and site visibility over search engine. It covers user friendly website, page speed, content quality, search intent etc. If you are looking for a format to display your unique thoughts, then the professionally designed Key Factors Affecting SEO Ranking On Search Engine Ppt Infographics Diagrams PDF is the one for you. You can use it as a Google Slides template or a PowerPoint template. Incorporate impressive visuals, symbols, images, and other charts. Modify or reorganize the text boxes as you desire. Experiment with shade schemes and font pairings. Alter, share or cooperate with other people on your work. Download Key Factors Affecting SEO Ranking On Search Engine Ppt Infographics Diagrams PDF and find out how to give a successful presentation. Present a perfect display to your team and make your presentation unforgettable.

Diagram Business PowerPoint Presentation Slides C
Microsoft Powerpoint Slides and Backgrounds with hand drawing diagram isolated on white background
Diagram Business PowerPoint Presentation Slides Cc
Microsoft Powerpoint Slides and Backgrounds with hand drawing diagram isolated on white background

Diagram Business PowerPoint Presentation Slides F
Microsoft Powerpoint Slides and Backgrounds with hand drawing diagram isolated on white background
Diagram Business PowerPoint Presentation Slides R
Microsoft Powerpoint Slides and Backgrounds with hand drawing diagram isolated on white background
Diagram Business PowerPoint Presentation Slides S
Microsoft Powerpoint Slides and Backgrounds with hand drawing diagram isolated on white background
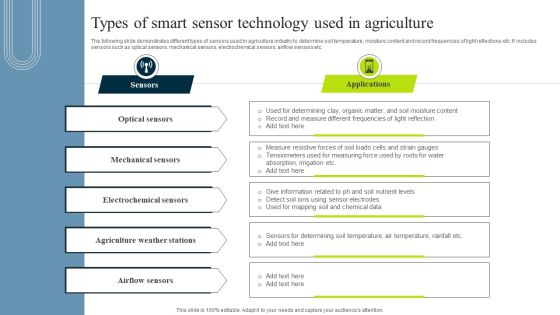
Types Of Smart Sensor Technology Used In Agriculture Formats PDF
The following slide demonstrates different types of sensors used in agriculture industry to determine soil temperature, moisture content and record frequencies of light reflections etc. It includes sensors such as optical sensors, mechanical sensors, electrochemical sensors, airflow sensors etc. Presenting Types Of Smart Sensor Technology Used In Agriculture Formats PDF to dispense important information. This template comprises five stages. It also presents valuable insights into the topics including Sensors, Applications, Optical Sensors . This is a completely customizable PowerPoint theme that can be put to use immediately. So, download it and address the topic impactfully.
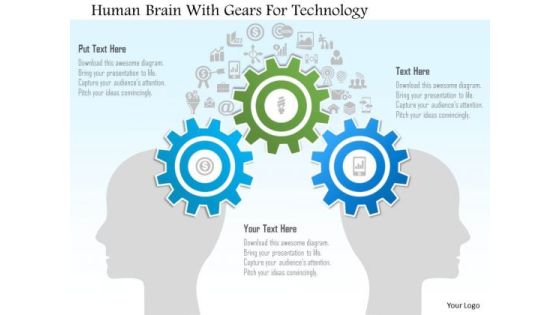
Human Brain With Gears For Technology PowerPoint Template
Graphics of human brain with gears are used to design this business slide. This business diagram helps to portray concept of process control and idea generation. Use this slide to build unique presentations for your viewers.

Strategic Plan For Call Center Employees Impact Of Poor Customer Support At Call Center Information PDF
This slide highlights the impacts on the company of poor customer support at BPO call center which showcases comparison of call center companies performance with Quarterly revenue. Coming up with a presentation necessitates that the majority of the effort goes into the content and the message you intend to convey. The visuals of a PowerPoint presentation can only be effective if it supplements and supports the story that is being told. Keeping this in mind our experts created Strategic Plan For Call Center Employees Impact Of Poor Customer Support At Call Center Information PDF to reduce the time that goes into designing the presentation. This way, you can concentrate on the message while our designers take care of providing you with the right template for the situation.
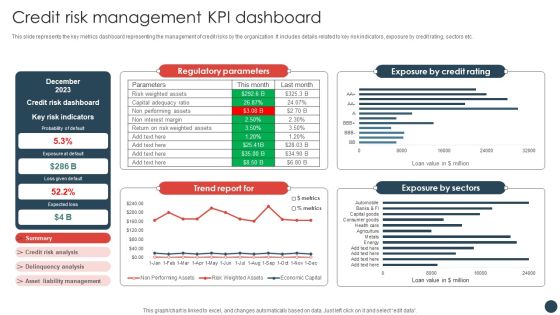
Strategic Risk Management Plan Credit Risk Management KPI Dashboard Information PDF
This slide represents the key metrics dashboard representing the management of credit risks by the organization. It includes details related to key risk indicators, exposure by credit rating, sectors etc.Coming up with a presentation necessitates that the majority of the effort goes into the content and the message you intend to convey. The visuals of a PowerPoint presentation can only be effective if it supplements and supports the story that is being told. Keeping this in mind our experts created Strategic Risk Management Plan Credit Risk Management KPI Dashboard Information PDF to reduce the time that goes into designing the presentation. This way, you can concentrate on the message while our designers take care of providing you with the right template for the situation.
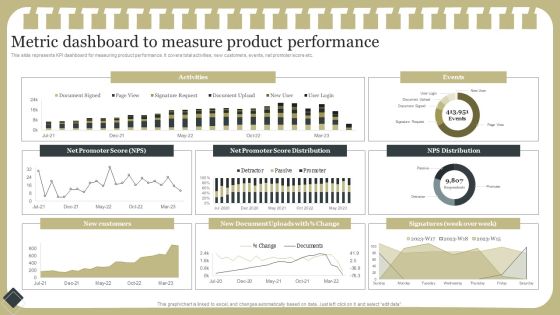
Effective Product Development Strategy Metric Dashboard To Measure Product Performance Information PDF
This slide represents KPI dashboard for measuring product performance. It covers total activities, new customers, events, net promoter score etc.Coming up with a presentation necessitates that the majority of the effort goes into the content and the message you intend to convey. The visuals of a PowerPoint presentation can only be effective if it supplements and supports the story that is being told. Keeping this in mind our experts created Effective Product Development Strategy Metric Dashboard To Measure Product Performance Information PDF to reduce the time that goes into designing the presentation. This way, you can concentrate on the message while our designers take care of providing you with the right template for the situation.

System Deployment Project Key Performance Indicators Highlighting Current Problems Information PDF
This slide represents the key performance indicators to track the problems faced by organization and draw effective strategies to tackle the problems. It includes key performance indicators of decline in organizational sales and customer engagement rate. Coming up with a presentation necessitates that the majority of the effort goes into the content and the message you intend to convey. The visuals of a PowerPoint presentation can only be effective if it supplements and supports the story that is being told. Keeping this in mind our experts created System Deployment Project Key Performance Indicators Highlighting Current Problems Information PDF to reduce the time that goes into designing the presentation. This way, you can concentrate on the message while our designers take care of providing you with the right template for the situation.
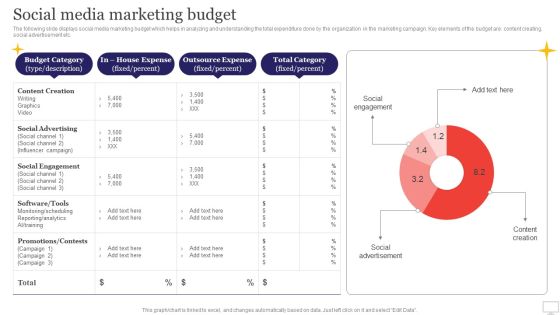
Target Audience Strategy For B2B And B2C Business Social Media Marketing Budget Information PDF
The following slide displays social media marketing budget which helps in analyzing and understanding the total expenditure done by the organization in the marketing campaign. Key elements of the budget are content creating, social advertisement etc. Slidegeeks is here to make your presentations a breeze with Target Audience Strategy For B2B And B2C Business Social Media Marketing Budget Information PDF With our easy-to-use and customizable templates, you can focus on delivering your ideas rather than worrying about formatting. With a variety of designs to choose from, you are sure to find one that suits your needs. And with animations and unique photos, illustrations, and fonts, you can make your presentation pop. So whether youre giving a sales pitch or presenting to the board, make sure to check out Slidegeeks first
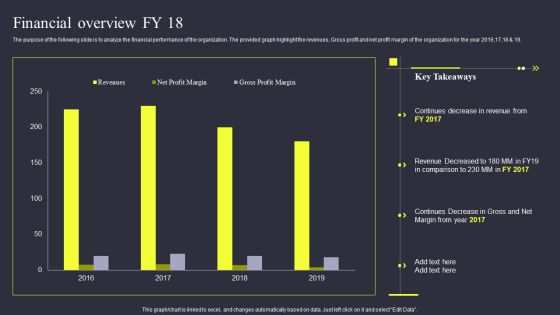
Strategies To Enhance Managed Service Business Financial Overview Fy 18 Information PDF
The purpose of the following slide is to analyze the financial performance of the organization. The provided graph highlight the revenues, Gross profit and net profit margin of the organization for the year 2016,17,18 and 19. Coming up with a presentation necessitates that the majority of the effort goes into the content and the message you intend to convey. The visuals of a PowerPoint presentation can only be effective if it supplements and supports the story that is being told. Keeping this in mind our experts created Strategies To Enhance Managed Service Business Financial Overview Fy 18 Information PDF to reduce the time that goes into designing the presentation. This way, you can concentrate on the message while our designers take care of providing you with the right template for the situation.

Incorporating Real Time Marketing For Improved Consumer Quantify Survey Results To Derive Decisions Information PDF
The following slide illustrates key outcomes of survey to facilitate quick decision making and improving customer experience. It includes elements such as price, sustainability, convenience, flexibility, branding, quality etc. Coming up with a presentation necessitates that the majority of the effort goes into the content and the message you intend to convey. The visuals of a PowerPoint presentation can only be effective if it supplements and supports the story that is being told. Keeping this in mind our experts created Incorporating Real Time Marketing For Improved Consumer Quantify Survey Results To Derive Decisions Information PDF to reduce the time that goes into designing the presentation. This way, you can concentrate on the message while our designers take care of providing you with the right template for the situation.

Building Financial Security PowerPoint Templates And PowerPoint Themes 1012
Building Financial Security PowerPoint Templates And PowerPoint Themes 1012-We have a piggy bank here that you will just fall in love with. You can use this Template for presentations on money box cash box savings box collecting box. This image has been professionally designed to emphasize the concept of building Financial Security for your Business as well for your Home. Our PPT images are so ideally designed that it reveals the very basis of our PPT Template and are an effective tool to make your clients understand.-Building Financial Security PowerPoint Templates And PowerPoint Themes 1012-This PowerPoint template can be used for presentations relating to-Financial insurance. Piggy bank with padlock, finance, business, money, security, shapes

Golden Egg Savings Money PowerPoint Templates And PowerPoint Themes 1012
Golden Egg Savings Money PowerPoint Templates And PowerPoint Themes 1012-The above template shows golden eggs standing in a straight line. This image refers the concept of savings. Use this template for presentations on success ideas, getting rich, improving personal wealth, beneficial and profitable proposals, etc. It is a useful captivating tool conceived to enable you to define your message in your Business PPT presentations. Our PPT images are so ideally designed that it reveals the very basis of our PPT template are an effective tool to make your clients understand.-Golden Egg Savings Money PowerPoint Templates And PowerPoint Themes 1012-This PowerPoint template can be used for presentations relating to-Golden egg saving money, Money, Future, Finance, Security,Metaphor

Idea On Keyboard Computer PowerPoint Templates And PowerPoint Themes 1012
Idea On Keyboard Computer PowerPoint Templates And PowerPoint Themes 1012-Use this PowerPoint Template to express your Ideas Graphically using Keyboard and Computer. It signifies thought, philosophy, thinking, notions, accepted wisdom, planning, concept, design way of thinking, beliefs, opinion, philosophy, position, mindset, point of view, viewpoint etc. Like your thoughts arrows are inherently precise and true. Illustrate your plans to your listeners with the same accuracy. Show them how to persistently hit bulls
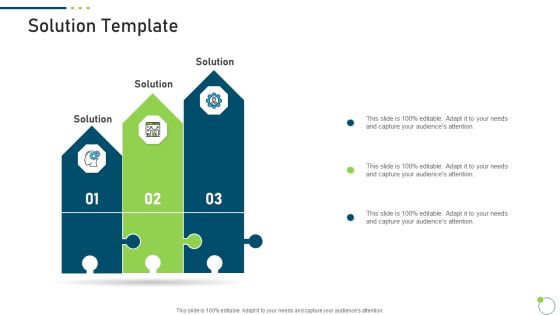
Investor Pitch Deck New Venture Capital Raising Solution Template Diagrams PDF
This is a investor pitch deck new venture capital raising solution template diagrams pdf template with various stages. Focus and dispense information on three stages using this creative set, that comes with editable features. It contains large content boxes to add your information on topics like solution. You can also showcase facts, figures, and other relevant content using this PPT layout. Grab it now.

Introduce Yourself For A Meeting Extra Curricular Activities Social Diagrams PDF
This is a introduce yourself for a meeting extra curricular activities social diagrams pdf template with various stages. Focus and dispense information on five stages using this creative set, that comes with editable features. It contains large content boxes to add your information on topics like education. You can also showcase facts, figures, and other relevant content using this PPT layout. Grab it now.

Yearly Selling Forecasts Revenue Chart Summary PDF
This slide covers projections for yearly revenue generation from product sales. It includes forecasted revenue for different years and a graph depicting the projected sales revenue growth. Showcasing this set of slides titled Yearly Selling Forecasts Revenue Chart Summary PDF. The topics addressed in these templates are Project Sales Revenue, Forecasts Revenue Chart. All the content presented in this PPT design is completely editable. Download it and make adjustments in color, background, font etc. as per your unique business setting.

Quarterly Revenue Growth Linear Chart Elements PDF
This slide depicts the quarterly revenue generated to check the financial health of the business. It includes parts such as quarters and growth percent Showcasing this set of slides titled Quarterly Revenue Growth Linear Chart Elements PDF. The topics addressed in these templates are Observations, Growth Chart, Production. All the content presented in this PPT design is completely editable. Download it and make adjustments in color, background, font etc. as per your unique business setting.

Target Audience Analysis By Multiple Demographic Factors Pictures PDF
Mentioned slide provides insights about various demographics which can be used by business to identify potential target customer for business. It includes key demographics such as age range, gender, marital status, location and income level. Get a simple yet stunning designed Target Audience Analysis By Multiple Demographic Factors Pictures PDF. It is the best one to establish the tone in your meetings. It is an excellent way to make your presentations highly effective. So, download this PPT today from Slidegeeks and see the positive impacts. Our easy to edit Target Audience Analysis By Multiple Demographic Factors Pictures PDF can be your go to option for all upcoming conferences and meetings. So, what are you waiting for Grab this template today.
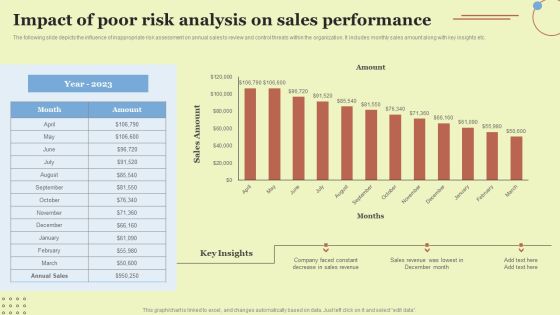
Impact Of Poor Risk Analysis On Sales Performance Introduction PDF
The following slide depicts the influence of inappropriate risk assessment on annual sales to review and control threats within the organization. It includes monthly sales amount along with key insights etc. Do you have to make sure that everyone on your team knows about any specific topic I yes, then you should give Impact Of Poor Risk Analysis On Sales Performance Introduction PDF a try. Our experts have put a lot of knowledge and effort into creating this impeccable Impact Of Poor Risk Analysis On Sales Performance Introduction PDF. You can use this template for your upcoming presentations, as the slides are perfect to represent even the tiniest detail. You can download these templates from the Slidegeeks website and these are easy to edit. So grab these today.

Customer Segmentation And Behavioral Analysis Customer Segmentation Monitor Elements PDF
The following slide showcases a dashboard to monitor customer segmentation based on similar traits and characteristics. It highlights elements such as total customer in each segments, segments description, segment characteristics and search customer by ID. Crafting an eye catching presentation has never been more straightforward. Let your presentation shine with this tasteful yet straightforward Customer Segmentation And Behavioral Analysis Customer Segmentation Monitor Elements PDF template. It offers a minimalistic and classy look that is great for making a statement. The colors have been employed intelligently to add a bit of playfulness while still remaining professional. Construct the ideal Customer Segmentation And Behavioral Analysis Customer Segmentation Monitor Elements PDF that effortlessly grabs the attention of your audience. Begin now and be certain to wow your customers.

Five Steps Voc Concept Chart Powerpoint Slide Designs
This is a five steps voc concept chart powerpoint slide designs. This is a five stage process. The stages in this process are analysis, marketing, presentation, strategy.

Spaghetti Chart Tamplate 1 Ppt PowerPoint Presentation Summary
This is a spaghetti chart tamplate 1 ppt powerpoint presentation summary. This is a three stage process. The stages in this process are business, marketing, analysis, success, strategy.
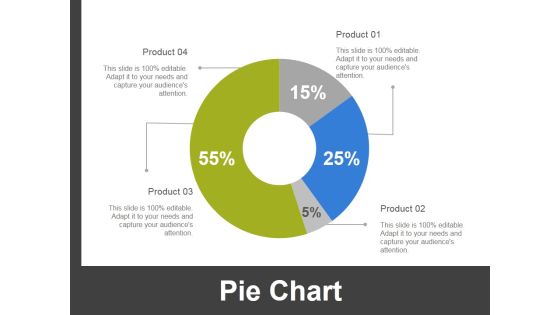
Pie Chart Ppt PowerPoint Presentation Infographic Template Deck
This is a pie chart ppt powerpoint presentation infographic template deck. This is a four stage process. The stages in this process are business, finance, marketing, strategy, analysis.

Line Chart Ppt PowerPoint Presentation Infographic Template Shapes
This is a line chart ppt powerpoint presentation infographic template shapes. This is a seven stage process. The stages in this process are business, strategy, analysis, marketing, growth.
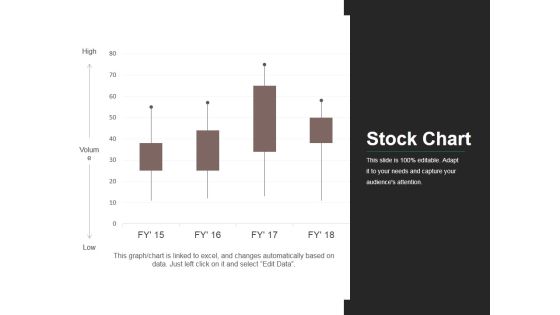
Stock Chart Ppt PowerPoint Presentation Infographic Template Elements
This is a stock chart ppt powerpoint presentation infographic template elements. This is a four stage process. The stages in this process are business, market, stock, finance, analysis.

Bubble Chart Finance Ppt PowerPoint Presentation Ideas Graphics
This is a bubble chart finance ppt powerpoint presentation ideas graphics. This is a two stage process. The stages in this process are finance, marketing, management, investment, analysis.

Clustered Column Chart Ppt PowerPoint Presentation Show Samples
This is a clustered column chart ppt powerpoint presentation show samples. This is a three stage process. The stages in this process are finance, marketing, management, investment, analysis.

Column Chart Finance Ppt PowerPoint Presentation Layouts Display
This is a column chart finance ppt powerpoint presentation layouts display. This is a two stage process. The stages in this process are finance, marketing, management, investment, analysis.

Combo Chart Ppt PowerPoint Presentation Layouts Example Topics
This is a combo chart ppt powerpoint presentation layouts example topics. This is a two stage process. The stages in this process are finance, marketing, management, investment, analysis.
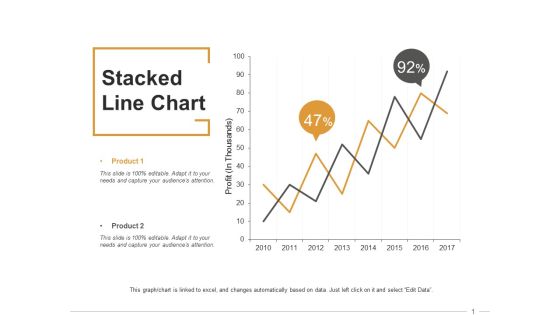
Stacked Line Chart Ppt PowerPoint Presentation Inspiration Format
This is a stacked line chart ppt powerpoint presentation inspiration format. This is a two stage process. The stages in this process are finance, marketing, management, investment, analysis.

Pie Chart Ppt PowerPoint Presentation File Slide Download
This is a pie chart ppt powerpoint presentation file slide download. This is a five stage process. The stages in this process are business, management, strategy, analysis, planning.
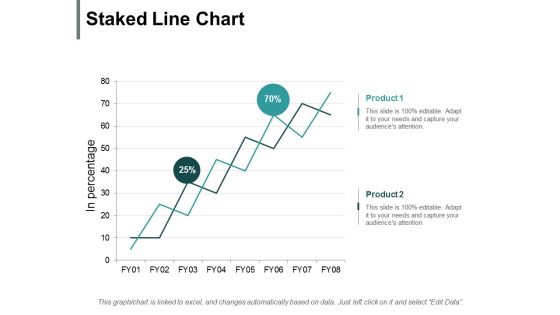
Staked Line Chart Ppt PowerPoint Presentation Ideas Influencers
This is a staked line chart ppt powerpoint presentation ideas influencers. This is a two stage process. The stages in this process are finance, marketing, management, investment, analysis.

Area Chart Finance Ppt PowerPoint Presentation Model Ideas
This is a area chart finance ppt powerpoint presentation model ideas. This is a two stage process. The stages in this process are finance, marketing, analysis, business, investment.

Bubble Chart Finance Ppt PowerPoint Presentation Slides Show
This is a bubble chart finance ppt powerpoint presentation slides show. This is a two stage process. The stages in this process are finance, marketing, analysis, business, investment.

Area Chart Finance Ppt PowerPoint Presentation Outline Design Templates
This is a area chart finance ppt powerpoint presentation outline design templates. This is a three stage process. The stages in this process arefinance, marketing, management, investment, analysis.
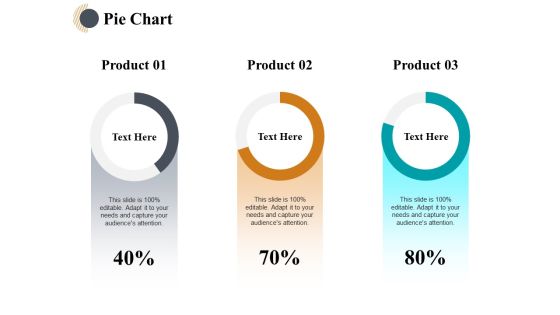
Pie Chart Finance Ppt PowerPoint Presentation Outline Pictures
This is a pie chart finance ppt powerpoint presentation outline pictures. This is a three stage process. The stages in this process are finance, analysis, business, investment, marketing.

Area Chart Finance Ppt PowerPoint Presentation Infographics Deck
This is a area chart finance ppt powerpoint presentation infographics deck. This is a three stage process. The stages in this process are finance, marketing, management, investment, analysis.

Combo Chart Finance Ppt PowerPoint Presentation Styles Example
This is a combo chart finance ppt powerpoint presentation styles example. This is a three stage process. The stages in this process are finance, marketing, management, investment, analysis.

area chart finance ppt powerpoint presentation pictures format
This is a area chart finance ppt powerpoint presentation pictures format. This is a three stage process. The stages in this process are finance, marketing, management, investment, analysis.
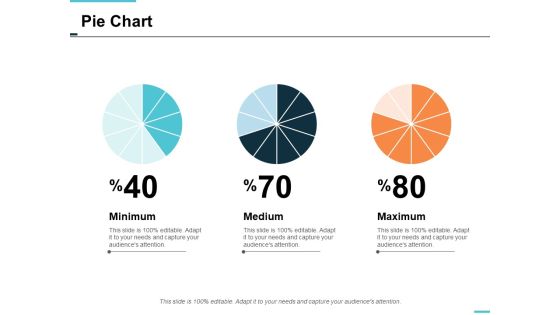
pie chart finance ppt powerpoint presentation styles skills
This is a pie chart finance ppt powerpoint presentation styles skills. This is a three stage process. The stages in this process are finance, marketing, management, investment, analysis.

Clustered Chart Finance Ppt PowerPoint Presentation Summary Guide
This is a clustered chart finance ppt powerpoint presentation summary guide. This is a three stage process. The stages in this process are finance, marketing, management, investment, analysis.

Combo Chart Finance Ppt PowerPoint Presentation Portfolio Guidelines
This is a combo chart finance ppt powerpoint presentation portfolio guidelines. This is a three stage process. The stages in this process are finance, marketing, management, investment, analysis.
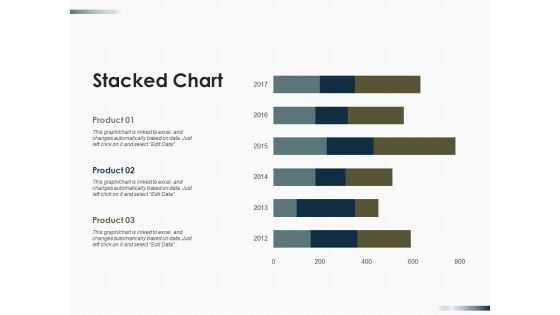
Stacked Chart Finance Ppt PowerPoint Presentation Outline Infographics
This is a stacked chart finance ppt powerpoint presentation outline infographics. This is a three stage process. The stages in this process are finance, marketing, management, investment, analysis.

Area Chart Contribution Ppt PowerPoint Presentation Gallery Structure
This is a area chart contribution ppt powerpoint presentation gallery structure. This is a three stage process. The stages in this process are business, management, strategy, analysis, marketing.

Donut Chart Management Ppt Powerpoint Presentation Slides Aids
This is a donut chart management ppt powerpoint presentation slides aids. This is a six stage process. The stages in this process are finance, marketing, management, investment, analysis.

Column Chart Finance Ppt Powerpoint Presentation Summary Visuals
This is a column chart finance ppt powerpoint presentation summary visuals. This is a four stage process. The stages in this process are finance, marketing, management, investment, analysis.

area chart finance ppt powerpoint presentation layouts ideas
This is a area chart finance ppt powerpoint presentation layouts ideas. This is a three stage process. The stages in this process are finance, marketing, management, investment, analysis.
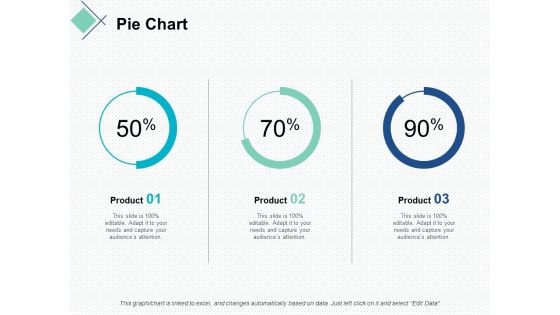
pie chart finance marketing ppt powerpoint presentation slides demonstration
This is a pie chart finance marketing ppt powerpoint presentation slides demonstration. This is a stage process. The stages in this process are finance, marketing, management, investment, analysis.

Column Chart Finance Ppt Powerpoint Presentation Gallery Maker
This is a column chart finance ppt powerpoint presentation gallery maker. This is a two stage process. The stages in this process are finance, marketing, management, investment, analysis.

Stock Chart Graph Ppt PowerPoint Presentation Ideas Demonstration
This is a stock chart graph ppt powerpoint presentation ideas demonstration. This is a three stage process. The stages in this process are finance, marketing, management, investment, analysis.
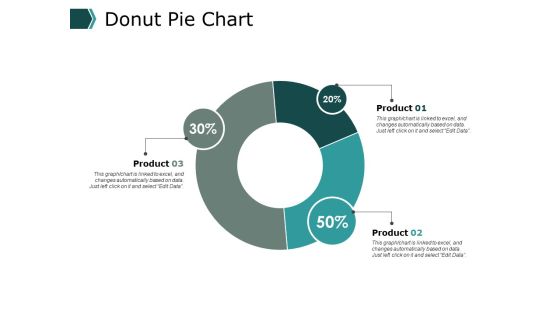
Donut Pie Chart Ppt PowerPoint Presentation Model Deck
This is a donut pie chart ppt powerpoint presentation model deck. This is a three stage process. The stages in this process are finance, marketing, management, investment, analysis.

Combo Chart Graph Ppt PowerPoint Presentation Inspiration Template
This is a combo chart graph ppt powerpoint presentation inspiration template. This is a three stage process. The stages in this process are finance, marketing, management, investment, analysis.

Column Chart Finance Ppt Powerpoint Presentation Styles Examples
This is a column chart finance ppt powerpoint presentation styles examples. This is a two stage process. The stages in this process are finance, marketing, management, investment, analysis.

Column Chart Finance Ppt PowerPoint Presentation Summary Grid
This is a column chart finance ppt powerpoint presentation summary grid. This is a three stage process. The stages in this process are finance, marketing, management, investment, analysis.


 Continue with Email

 Home
Home


