AI PPT Maker
Templates
PPT Bundles
Design Services
Business PPTs
Business Plan
Management
Strategy
Introduction PPT
Roadmap
Self Introduction
Timelines
Process
Marketing
Agenda
Technology
Medical
Startup Business Plan
Cyber Security
Dashboards
SWOT
Proposals
Education
Pitch Deck
Digital Marketing
KPIs
Project Management
Product Management
Artificial Intelligence
Target Market
Communication
Supply Chain
Google Slides
Research Services
 One Pagers
All Categories
-
Home
- Customer Favorites
- Data Icon
Data Icon
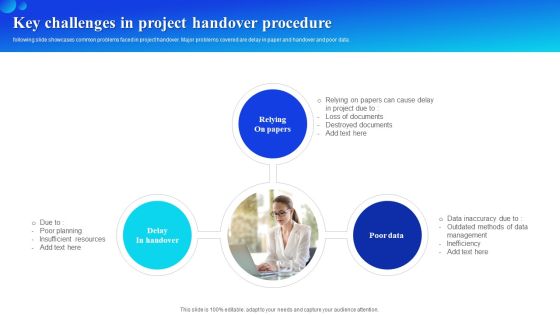
Key Challenges In Project Handover Procedure Designs PDF
following slide showcases common problems faced in project handover. Major problems covered are delay in paper and handover and poor data. Presenting Key Challenges In Project Handover Procedure Designs PDF to dispense important information. This template comprises three stages. It also presents valuable insights into the topics including Relying On Papers, Delay In Handover, Poor Data. This is a completely customizable PowerPoint theme that can be put to use immediately. So, download it and address the topic impactfully.

Business Phase Ands Customer Partnership Formats PDF
Pitch your topic with ease and precision using this Business Phase Ands Customer Partnership Formats PDF. This layout presents information on Supplier, Cross Functional Communication, Operating Data. It is also available for immediate download and adjustment. So, changes can be made in the color, design, graphics or any other component to create a unique layout.
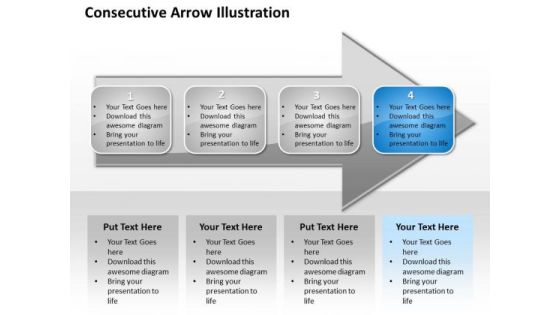
Ppt Consecutive Illustration Of 4 Concepts An Arrow PowerPoint Templates
PPT consecutive illustration of 4 concepts an arrow PowerPoint Templates-Use this Diagram to display the data. It make easier for the analysts to visualize and interpret the data-PPT consecutive illustration of 4 concepts an arrow PowerPoint Templates-3d, Abstract, Around, Arrows, Blue, Border, Business, Center, Circle, Circular, Concept, Connections, Copy, Curve, Cycle, Directions, Distribution, Illustration, Management, Middle, Objects, Pieces, Plan, Pointing, Process, Recycle, Rounded, Shadows, Space, System
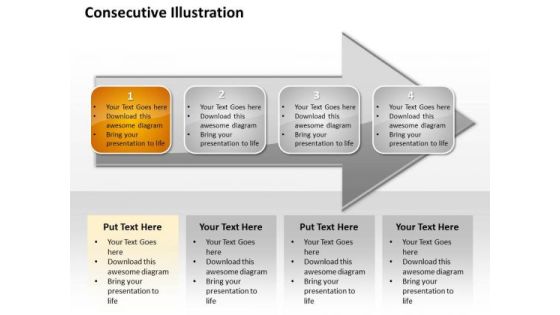
Ppt Consecutive Mobile Marketing PowerPoint Presentation Steps An Arrow Templates
PPT consecutive mobile marketing powerpoint presentation steps an arrow Templates-Use this Diagram to display the data. It makes easier for the analysts to visualize and interpret the data-PPT consecutive mobile marketing powerpoint presentation steps an arrow Templates-3d, Abstract, Around, Arrows, Blue, Border, Business, Center, Circle, Circular, Concept, Connections, Copy, Curve, Cycle, Directions, Distribution, Illustration, Management, Middle, Objects, Pieces, Plan, Pointing, Process, Recycle, Rounded, Shadows, Space, System

Brand Tracking Info Graphics Ppt PowerPoint Presentation Model Example
This is a brand tracking info graphics ppt powerpoint presentation model example. This is a four stage process. The stages in this process are finance, marketing, percentage, business, icons.

Managing Artificial Intelligence Project Framework Ppt Ideas Backgrounds PDF
This slide exhibits information about self driving car project using anonymizing faces to protect individual privacy. It includes elements such as data, skills, value proposition, integration, stakeholders, revenue etc. Presenting Managing Artificial Intelligence Project Framework Ppt Ideas Backgrounds PDF to dispense important information. This template comprises four stages. It also presents valuable insights into the topics including Data, Value Proposition, Integration. This is a completely customizable PowerPoint theme that can be put to use immediately. So, download it and address the topic impactfully.

Business Diagram Circles Around Gears For Process Control Presentation Template
This power point template has been designed with graphic of multiple gears and text circles. This PPT diagram contains the concept of process control Develop your marketing strategy with this diagram.

Five Levels Pyramid Layout For Success Of Financial Planning Ppt PowerPoint Presentation Gallery Topics PDF
Presenting five levels pyramid layout for success of financial planning ppt powerpoint presentation gallery topics pdf to dispense important information. This template comprises five stages. It also presents valuable insights into the topics including develop financial plan, analyse the data, collect financial data. This is a completely customizable PowerPoint theme that can be put to use immediately. So, download it and address the topic impactfully.
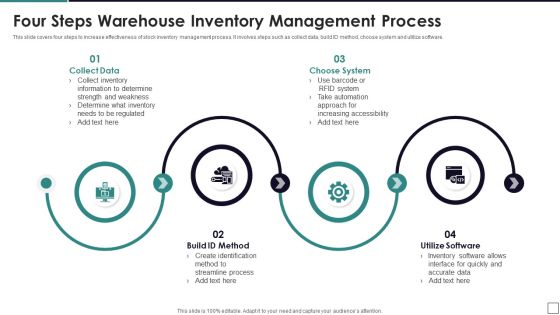
Four Steps Warehouse Inventory Management Process Demonstration PDF
This slide covers four steps to increase effectiveness of stock inventory management process. It involves steps such as collect data, build ID method, choose system and utilize software. Presenting Four Steps Warehouse Inventory Management Process Demonstration PDF to dispense important information. This template comprises four stages. It also presents valuable insights into the topics including Collect Data, Choose System, Utilize Software. This is a completely customizable PowerPoint theme that can be put to use immediately. So, download it and address the topic impactfully.

Employee Community Engagement Principles With Management Role Inspiration PDF
The slide highlights the employee engagement principles with management role illustrating recognition, real time data, appreciation gesture, management role and engagement structure. Presenting Employee Community Engagement Principles With Management Role Inspiration PDF to dispense important information. This template comprises five stages. It also presents valuable insights into the topics including Recognition, Real Time Data, Appreciation Gesture, Management Role. This is a completely customizable PowerPoint theme that can be put to use immediately. So, download it and address the topic impactfully.
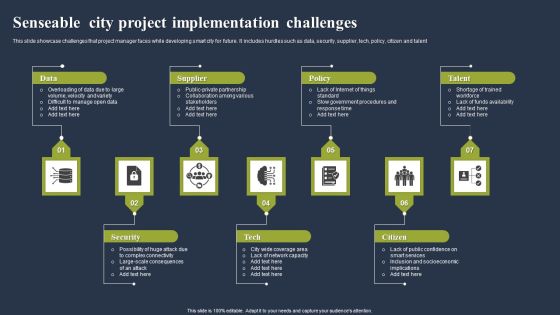
Senseable City Project Implementation Challenges Topics PDF
This slide showcase challenges that project manager faces while developing smart city for future. It includes hurdles such as data, security, supplier, tech, policy, citizen and talent. Presenting Senseable City Project Implementation Challenges Topics PDF to dispense important information. This template comprises seven stages. It also presents valuable insights into the topics including Data, Supplier, Policy. This is a completely customizable PowerPoint theme that can be put to use immediately. So, download it and address the topic impactfully.

Best Practices For New Client Onboarding Procedure Slides PDF
This slide covers best practices for new customer onboarding process. It involves measures such as onboard team, gather data, communicate and regularly assess customer needs. Presenting Best Practices For New Client Onboarding Procedure Slides PDF to dispense important information. This template comprises four stages. It also presents valuable insights into the topics including Onboard Team, Gather Data, Communicate Effectively, Regularly Assess. This is a completely customizable PowerPoint theme that can be put to use immediately. So, download it and address the topic impactfully.
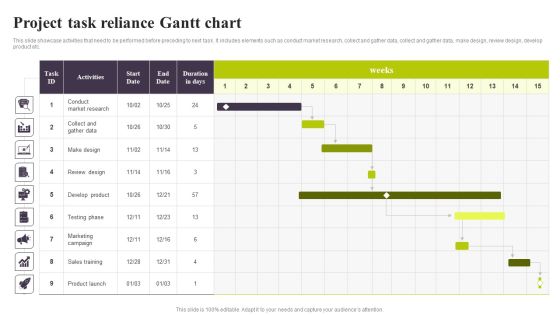
Project Task Reliance Gantt Chart Ppt PowerPoint Presentation Diagram PDF
This slide showcase activities that need to be performed before preceding to next task. It includes elements such as conduct market research, collect and gather data, collect and gather data, make design, review design, develop product etc. Showcasing this set of slides titled Project Task Reliance Gantt Chart Ppt PowerPoint Presentation Diagram PDF. The topics addressed in these templates are Conduct Market Research, Marketing Campaign, Sales Training. All the content presented in this PPT design is completely editable. Download it and make adjustments in color, background, font etc. as per your unique business setting.
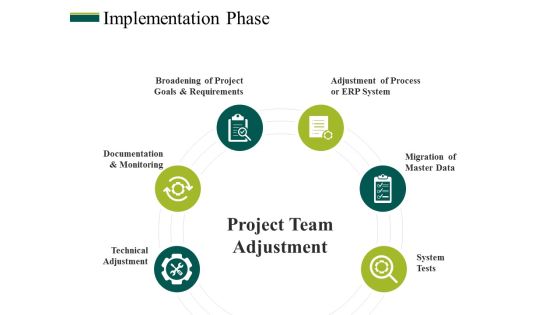
Implementation Phase Ppt PowerPoint Presentation Show Visuals
This is a implementation phase ppt powerpoint presentation show visuals. This is a six stage process. The stages in this process are technical adjustment, documentation and monitoring, broadening of project goals and requirements, adjustment of process or erp system, migration of master data.
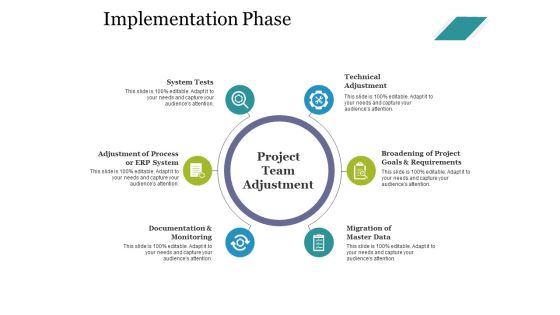
Implementation Phase Ppt PowerPoint Presentation Examples
This is a implementation phase ppt powerpoint presentation examples. This is a six stage process. The stages in this process are migration of master data, broadening of project goals and requirements, technical adjustment, system tests, adjustment of process or erp syst.

Implementation Phase Ppt PowerPoint Presentation Outline Deck
Presenting this set of slides with name implementation phase ppt powerpoint presentation outline deck. This is a six stage process. The stages in this process are broadening project goals and requirements, documentation and monitoring, technical adjustment, system tests, migration master data, adjustment process, erp system. This is a completely editable PowerPoint presentation and is available for immediate download. Download now and impress your audience.
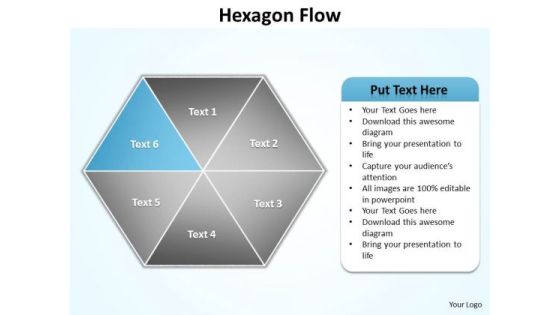
Ppt Blue Factor Hexagon Angles Spider Diagram PowerPoint Template Editable Templates
PPT blue factor hexagon angles spider diagram PowerPoint template editable Templates-You can easily collaborate this PowerPoint diagram with colleagues to create detailed process diagrams and use them as a key element in streamlining your processes. Use this graphical approach to represent global business issues such as financial data, stock market Exchange, increase in sales, corporate presentations and more. -PPT blue factor hexagon angles spider diagram PowerPoint template editable Templates-attached, backgrounds, blue, cell, color, component, connect, connection, diagram, elements, geometric, graphic, group, hexagon, honeycomb, icon, illustration, intricacy, lines, link, map, mesh, model, network, science, shape, shiny, strategy, structure, symbol, teamwork, technology
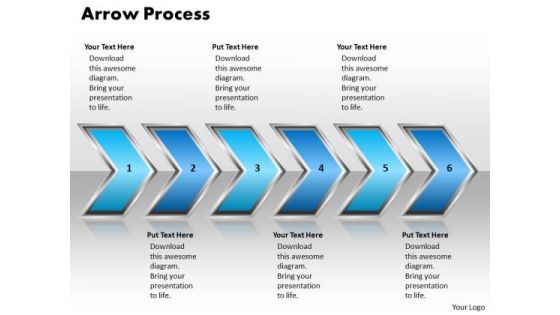
Ppt Pointing Curved Arrow Forging Process PowerPoint Slides 6 State Diagram Templates
PPT pointing curved arrow forging process powerpoint slides 6 state diagram Templates-This diagram is an amazing tool to ensure that strategic planning sessions contribute to teambuilding. Use this graphical approach to represent global business issues such as financial data, stock market Exchange, increase in sales, corporate presentations and more.-PPT pointing curved arrow forging process powerpoint slides 6 state diagram Templates-Aim, Arrow, Arrowheads, Badge, Border, Click, Connection, Curve, Design, Direction, Download, Element, Fuchsia, Icon, Illustration, Indicator, Internet, Magenta, Mark, Object, Orientation, Pointer, Shadow, Shape, Sign
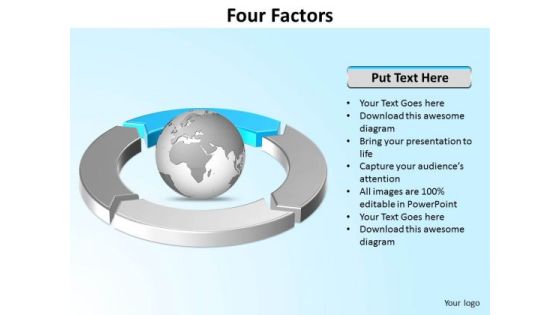
Ppt Four Segments Around Globe PowerPoint Presentation Circle Blue Templates
PPT four segments around globe powerpoint presentation circle blue Templates-This PowerPoint Diagram can be used to represent worldwide business issues such as financial data, stock market Exchange, increase in sales, corporate presentations and more. It illustrates the blue component of this worldwide PowerPoint Diagram.-Can be used for presentations on abstract, achievement, aim, arrow, background, business, chart, communication, company, competition, concept, design, development, diagram, direction, finance, financial, forecast, forward, goal, graph, graphic, growth, icon, illustration, increase, investment, leader, leadership, marketing, motion, moving, path, price, process, profit, progress, progress bar, shape, sign, success, symbol, target, team, teamwork, turquoise blue, up, upward-PPT four segments around globe powerpoint presentation circle blue Templates
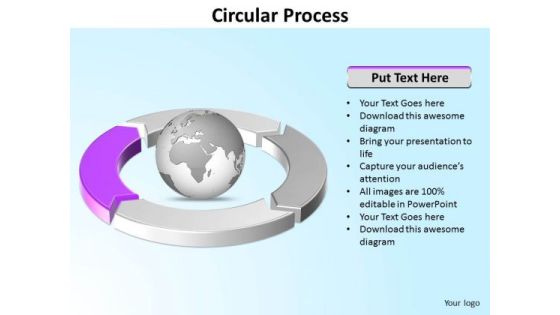
Ppt Four Segments Around Microsoft PowerPoint Backgrounds Circle Purple Templates
PPT four segments around microsoft powerpoint backgrounds circle purple Templates-This PowerPoint Diagram can be used to represent worldwide business issues such as financial data, stock market Exchange, increase in sales, corporate presentations and more. It illustrates the purple component. This Diagram will fit for Business Presentations.-Can be used for presentations on abstract, achievement, aim, arrow, background, business, chart, communication, company, competition, concept, design, development, diagram, direction, finance, financial, forecast, forward, goal, graph, graphic, growth, icon, illustration, increase, investment, leader, leadership, marketing, motion, moving, path, price, process, profit, progress, progress bar, shape, sign, success, symbol, target, team, teamwork, turquoise blue, up, upward-PPT four segments around microsoft powerpoint backgrounds circle purple Templates

Ppt Arrows PowerPoint 2010 Pointing Vertical Downwards Templates
PPT arrows powerpoint 2010 pointing vertical downwards Templates-Arrows PowerPoint Diagram is nice for financial PowerPoint Diagram presentations as well as other analysis or business PowerPoint diagram needs. Use this graphical approach to represent global business issues such as financial data, stock market Exchange, increase in sales, corporate presentations and more.-PPT arrows powerpoint 2010 pointing vertical downwards Templates-advertising, arrow, bend, black, blue, bookmark, business, collection, control, corner, curl, customer, design, down, element, gold, green, icon, illustration, label, mark, marketing, message, new, origami, paper, product, service, set, shadow, shiny, shop, sign, site, sticker, symbol, tag

Ppt Four Segments Around Globe In Circle PowerPoint Presentation Templates
PPT four segments around globe in circle powerpoint presentation Templates-Use this graphical approach to represent global business issues such as financial data, stock market Exchange, increase in sales, corporate presentations and more. It Signifies common, comprehensive, extensive, global, international, multinational, omnipresent, planetary, ubiquitous, universal etc.-Can be used for presentations on abstract, achievement, aim, arrow, background, business, chart, communication, company, competition, concept, design, development, diagram, direction, finance, financial, forecast, forward, goal, graph, graphic, growth, icon, illustration, increase, investment, leader, leadership, marketing, motion, moving, path, price, process, profit, progress, progress bar, shape, sign, success, symbol, target, team, teamwork, turquoise blue, up, upward-PPT four segments around globe in circle powerpoint presentation Templates
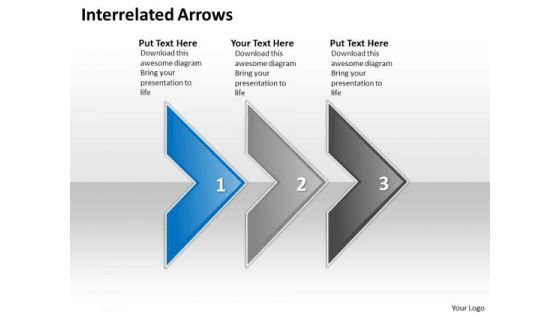
Ppt Interrelated Arrows Three Practice The PowerPoint Macro Steps Business Templates
PPT interrelated arrows three practice the powerpoint macro steps Business Templates-Use this graphical approach to represent global business issues such as financial data, stock market Exchange, increase in sales, corporate presentations and more. This image has been conceived to enable you to emphatically communicate your ideas in your Business, Marketing PPT presentation.-PPT interrelated arrows three practice the powerpoint macro steps Business Templates-Aim, Arrow, Arrowheads, Badge, Border, Click, Connection, Curve, Design, Direction, Download, Element, Fuchsia, Icon, Illustration, Indicator, Internet, Magenta, Mark, Object, Orientation, Pointer, Shadow, Shape, Sign

Key Statistics Management Ppt PowerPoint Presentation Professional Graphics Tutorials
This is a key statistics management ppt powerpoint presentation professional graphics tutorials. This is a five stage process. The stages in this process are strategy, marketing, business, management, icons.

Key Stats And Figure Movie Editing Company Outline Ideas PDF
This slide showcases the statistics associated with film production house which includes global box office collection, revenue, number of released movies, average hours of production, number of crew members, etc. Retrieve professionally designed Key Stats And Figure Movie Editing Company Outline Ideas PDF to effectively convey your message and captivate your listeners. Save time by selecting pre-made slideshows that are appropriate for various topics, from business to educational purposes. These themes come in many different styles, from creative to corporate, and all of them are easily adjustable and can be edited quickly. Access them as PowerPoint templates or as Google Slides themes. You donot have to go on a hunt for the perfect presentation because Slidegeeks got you covered from everywhere.
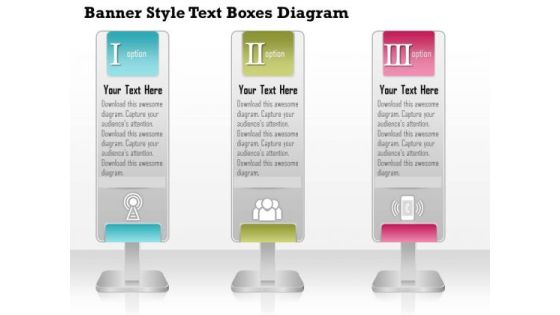
Business Diagram Banner Style Text Boxes Diagram PowerPoint Ppt Presentation
This diagram displays banner style text boxes. It contains three text boxes with icons.You may use this layout to display business process in an interesting, eye-catching manner.
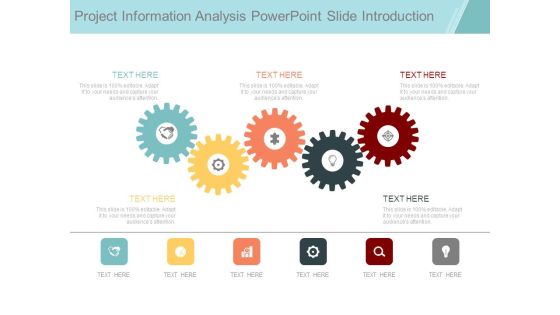
Project Information Analysis Powerpoint Slide Introduction
This is a project information analysis powerpoint slide introduction. This is a five stage process. The stages in this process are gears, business, icons, strategy, industrial, marketing.

Continuous Process Product Quality Improvement Action Plan Phases Introduction PDF
The slide involves different phases of quality improvement plan to increase customer satisfaction and raise the value of business. It includes three phases such as phase 1 team development, concept definition, etc, phase 2 presentation of data, problem identification, etc and phase 3 plan analysis, etc.

PowerPoint Process Rings Business Ppt Theme
PowerPoint Process Rings Business PPT Theme-This PowerPoint Diagram Shows the Colorful Interconnected Rings. SmartArt graphics add color, shape, and emphasis to your text and data, and they're a snap to use. This PowerPoint Template Signifies the Strategy, Planning required for Business.-PowerPoint Process Rings Business PPT Theme

Business Diagram Business Diagram 3d Bulb With Stair Design For Idea Generation Presentation Templat
This business diagram has been designed with graphic of light bulb and stairs and icons. These stairs contains various business icons. This professional slide depicts innovative business ideas. Use this PPT slide for your business presentations.

Benefits Of Using Digital Loans Platform Ppt Diagram Graph Charts PDF
This slide contains the benefits of using the platform for digitally lending money to the borrowers. It includes optimize loan cycle, consistent, easy collection of applicant data, quicker decision making, etc. Persuade your audience using this Benefits Of Using Digital Loans Platform Ppt Diagram Graph Charts PDF. This PPT design covers three stages, thus making it a great tool to use. It also caters to a variety of topics including Optimize Loan Cycle, Easy Collection, Candidate Data. Download this PPT design now to present a convincing pitch that not only emphasizes the topic but also showcases your presentation skills.

Business Diagram Thumbs Up For Save The World Campaign Presentation Template
This Power Point diagram has been crafted with graphic of text boxes with icons. It contains diagram of thumb up hand graphics with communication icons. Use this diagram to build professional presentation for your viewers.
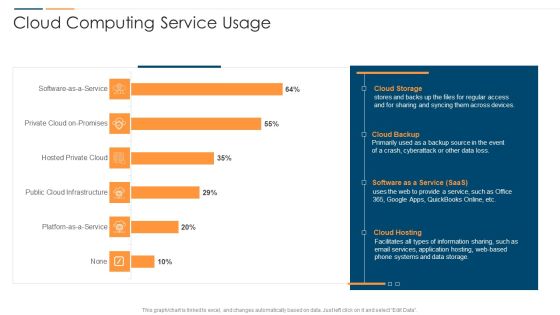
Revolution In Online Business Cloud Computing Service Usage Ppt PowerPoint Presentation File Themes PDF
This graph or chart is linked to excel, and changes automatically based on data. Just left click on it and select Edit Data. Deliver and pitch your topic in the best possible manner with this Revolution In Online Business Cloud Computing Service Usage Ppt PowerPoint Presentation File Themes PDF. Use them to share invaluable insights on Cloud Storage System, Cloud Backup Saas, Cloud Hosting Storage and impress your audience. This template can be altered and modified as per your expectations. So, grab it now.
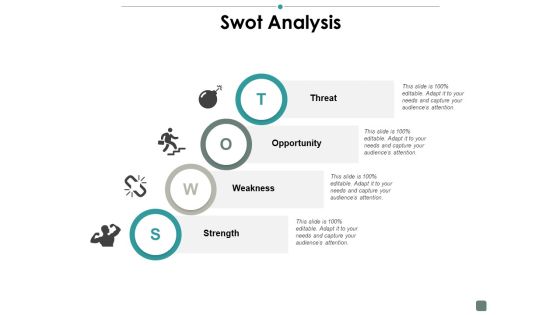
Swot Analysis Contribution Ppt PowerPoint Presentation Pictures Information
This is a swot analysis contribution ppt powerpoint presentation pictures information. This is a four stage process. The stages in this process are marketing, icons, business, management, strategy.

Service Level Agreement KPI Dashboard Indicating Violation Count And Overdue Requests Diagrams PDF
This graph or chart is linked to excel, and changes automatically based on data. Just left click on it and select Edit Data. Showcasing this set of slides titled Service Level Agreement KPI Dashboard Indicating Violation Count And Overdue Requests Diagrams PDF. The topics addressed in these templates are Total Requests Category, Total Requests Status, Urgent Requests. All the content presented in this PPT design is completely editable. Download it and make adjustments in color, background, font etc. as per your unique business setting.

CRM For Online Business Ppt PowerPoint Presentation Pictures Microsoft
Presenting this set of slides with name crm for online business ppt powerpoint presentation pictures microsoft. This is a four stage process. The stages in this process are customer service icon, crm icon, customer relationship management icon. This is a completely editable PowerPoint presentation and is available for immediate download. Download now and impress your audience.
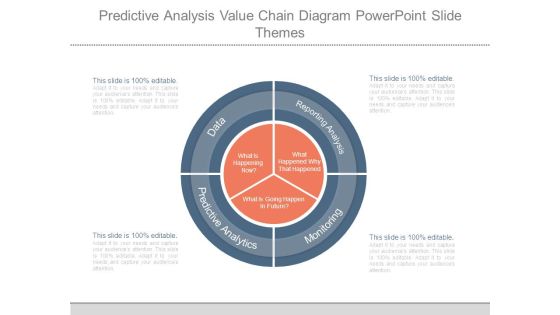
Predictive Analysis Value Chain Diagram Powerpoint Slide Themes
This is a predictive analysis value chain diagram powerpoint slide themes. This is a four stage process. The stages in this process are what is happening now, what is going happen in future, what happened why that happened, data, predictive analytics, reporting analysis, monitoring.
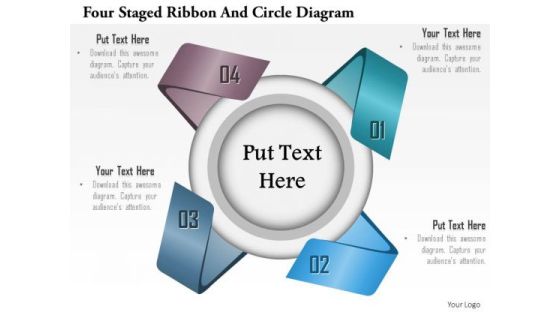
Business Diagram Four Staged Ribbon And Circle Diagram Presentation Template
This Power Point template slide has been crafted with graphic of four staged ribbon diagram. This exclusive graphic diagram template slide can be used to show the concept of business data. Use this slide and build a creative presentation for your viewers.

Content Advertising Campaign Key Stats And Figures For Content Marketing Summary PDF
This slide provides an overview of the key statistics about content marketing. Major stats covered are most businesses invest in organic research, pandemic led to rise in content usage, most marketers outsource their content marketing, etc. Want to ace your presentation in front of a live audience Our Content Advertising Campaign Key Stats And Figures For Content Marketing Summary PDF can help you do that by engaging all the users towards you. Slidegeeks experts have put their efforts and expertise into creating these impeccable powerpoint presentations so that you can communicate your ideas clearly. Moreover, all the templates are customizable, and easy to edit and downloadable. Use these for both personal and commercial use.
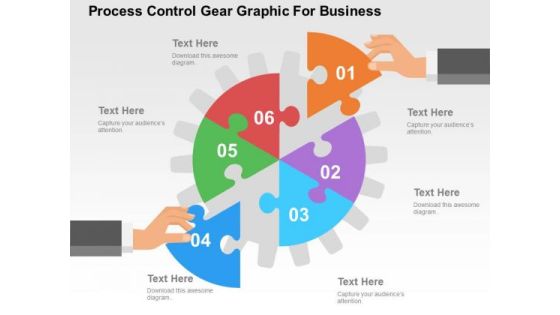
Process Control Gear Graphic For Business PowerPoint Template
Our professionally designed gear diagram is as an effective tool for communicating ideas. It contains graphics of gear with six segments. Convey your views with this diagram slide. It will amplify the strength of your logic.
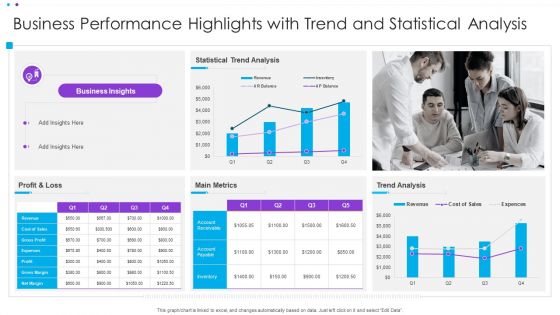
Business Performance Highlights With Trend And Statistical Analysis Ppt Infographic Template Display PDF
This graph or chart is linked to excel, and changes automatically based on data. Just left click on it and select Edit Data. Pitch your topic with ease and precision using this Business Performance Highlights With Trend And Statistical Analysis Ppt Infographic Template Display PDF. This layout presents information on Statistical Trend Analysis, Main Metrics, Profit And Loss. It is also available for immediate download and adjustment. So, changes can be made in the color, design, graphics or any other component to create a unique layout.

Power Plant Energy Production Dashboard For Consumption Statistics Download PDF
This graph or chart is linked to excel, and changes automatically based on data. Just left click on it and select edit data. Pitch your topic with ease and precision using this Multiple Country Energy Consumption Statistics Comparison Dashboard Formats PDF. This layout presents information on August Year 2022, Return on Investments, Power Plan Detail . It is also available for immediate download and adjustment. So, changes can be made in the color, design, graphics or any other component to create a unique layout.

Steps To Conduct Competitor Analysis Column Chart Ppt Model Gridlines PDF
This graph or chart is linked to excel, and changes automatically based on data. Just left click on it and select edit data. If your project calls for a presentation, then Slidegeeks is your go-to partner because we have professionally designed, easy-to-edit templates that are perfect for any presentation. After downloading, you can easily edit Steps To Conduct Competitor Analysis Column Chart Ppt Model Gridlines PDF and make the changes accordingly. You can rearrange slides or fill them with different images. Check out all the handy templates

Prevention Of Information Key Statistics Showing The Impact Of Security Awareness Infographics PDF
This graph or chart is linked to excel, and changes automatically based on data. Just left click on it and select Edit Data. This modern and well-arranged Prevention Of Information Key Statistics Showing The Impact Of Security Awareness Infographics PDF provides lots of creative possibilities. It is very simple to customize and edit with the Powerpoint Software. Just drag and drop your pictures into the shapes. All facets of this template can be edited with Powerpoint, no extra software is necessary. Add your own material, put your images in the places assigned for them, adjust the colors, and then you can show your slides to the world, with an animated slide included.
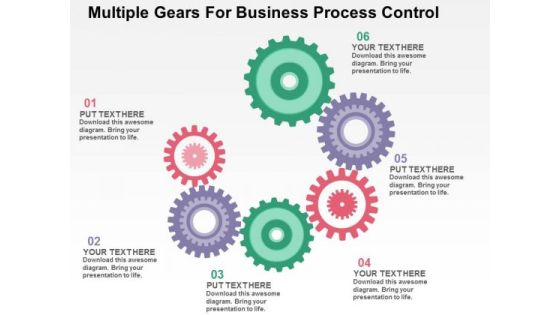
Multiple Gears For Business Process Control PowerPoint Template
This business diagram has been designed with multiple gears. It may use to display task management and process control. Prove the viability of your ideas to help your organization to achieve the quality and success required.

Quarterly Timeline Template Ppt PowerPoint Presentation Ideas Background Images
This is a quarterly timeline template ppt powerpoint presentation ideas background images. This is a four stage process. The stages in this process are icons, years, marketing, strategy, planning.
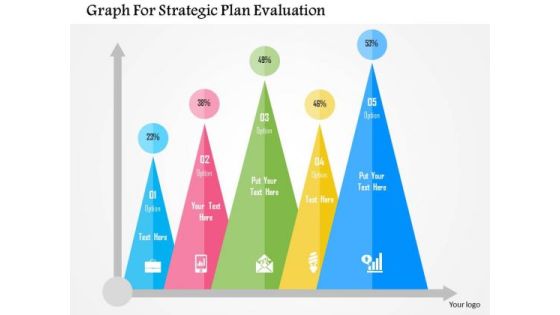
Business Diagram Graph For Strategic Plan Evaluation Presentation Template
Strategic plan evaluation can be explained with this diagram. It contains business statistics graph with icons. Download this diagram slide to make impressive presentations.

Multiaccess Edge Computing Mec Overview 5G Functional Architecture Themes PDF
This slide represents the overview of multi-access edge computing, including its characteristics, such as low latency, high bandwidth, and real-time access to RAN. This method eliminates the lengthy network channel that separates the user and host while transferring data.This is a Multiaccess Edge Computing Mec Overview 5G Functional Architecture Themes PDF template with various stages. Focus and dispense information on six stages using this creative set, that comes with editable features. It contains large content boxes to add your information on topics like Previously Separated, Centralized Data, Low Latency. You can also showcase facts, figures, and other relevant content using this PPT layout. Grab it now.

Content Execution Ppt PowerPoint Presentation Outline Vector
This is a content execution ppt powerpoint presentation outline vector. This is a seven stage process. The stages in this process are icons, planning, strategy, analysis, marketing.

Service Level Agreement KPI Dashboard With Current Risk Statistics Topics PDF
This graph or chart is linked to excel, and changes automatically based on data. Just left click on it and select Edit Data. Pitch your topic with ease and precision using this Service Level Agreement KPI Dashboard With Current Risk Statistics Topics PDF. This layout presents information on Current Risk SLAS, Current Breached Slas, Personal Active SLA It is also available for immediate download and adjustment. So, changes can be made in the color, design, graphics or any other component to create a unique layout.
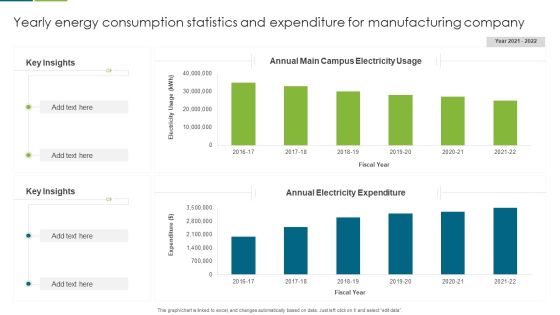
Yearly Energy Consumption Statistics And Expenditure For Manufacturing Company Guidelines PDF
This graph or chart is linked to excel, and changes automatically based on data. Just left click on it and select edit data. Pitch your topic with ease and precision using this Yearly Energy Consumption Statistics And Expenditure For Manufacturing Company Guidelines PDF. This layout presents information on Key Insights, Annual Electricity Expenditure, Annual Main Campus, Electricity Usage. It is also available for immediate download and adjustment. So, changes can be made in the color, design, graphics or any other component to create a unique layout.

Strategic Management Figure Chart Consulting Diagram
Good Camaraderie Is A Key To Teamwork. Our Strategic Management Figure Chart Consulting Diagram Powerpoint Templates Can Be A Cementing Force.

Organizing Security Awareness Major Statistics Of Cyber Security Awareness Formats PDF
This graph or chart is linked to excel, and changes automatically based on data. Just left click on it and select Edit Data. Welcome to our selection of the Organizing Security Awareness Major Statistics Of Cyber Security Awareness Formats PDF. These are designed to help you showcase your creativity and bring your sphere to life. Planning and Innovation are essential for any business that is just starting out. This collection contains the designs that you need for your everyday presentations. All of our PowerPoints are 100 percent editable, so you can customize them to suit your needs. This multi-purpose template can be used in various situations. Grab these presentation templates today.
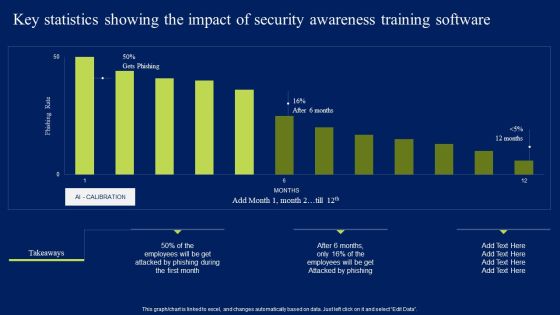
Key Statistics Showing The Impact Of Security Awareness Training Software Elements PDF
This graph or chart is linked to excel, and changes automatically based on data. Just left click on it and select Edit Data. Slidegeeks is one of the best resources for PowerPoint templates. You can download easily and regulate Key Statistics Showing The Impact Of Security Awareness Training Software Elements PDF for your personal presentations from our wonderful collection. A few clicks is all it takes to discover and get the most relevant and appropriate templates. Use our Templates to add a unique zing and appeal to your presentation and meetings. All the slides are easy to edit and you can use them even for advertisement purposes.

Five Steps To Conduct Quantitative Market Research Themes PDF
This slide covers steps for organizations to perform successful market research in order to achieve their targets. It includes specifying goals, creating a plan, collecting, analyzing and compiling data. Presenting Five Steps To Conduct Quantitative Market Research Themes PDF to dispense important information. This template comprises five stages. It also presents valuable insights into the topics including Specify Goal, Create Plan, Collect Data. This is a completely customizable PowerPoint theme that can be put to use immediately. So, download it and address the topic impactfully.

Six Staged Business Growth Analysis PowerPoint Template
Growth analysis of business can be explained with this diagram. It contains graphics of bars with icons. You can use this design to complement your idea themed presentation.

Best Practices To Raise Money Through Welfare Fundraising Diagrams PDF
This slide showcases ideas to initiate effectively fundraising plan. This template focuses on encouraging people to donate for causes they care about. It includes information related to collecting data, determining charity goals, etc. Presenting Best Practices To Raise Money Through Welfare Fundraising Diagrams PDF to dispense important information. This template comprises four stages. It also presents valuable insights into the topics including Fundraising Goals, Donor Data, Mission. This is a completely customizable PowerPoint theme that can be put to use immediately. So, download it and address the topic impactfully.
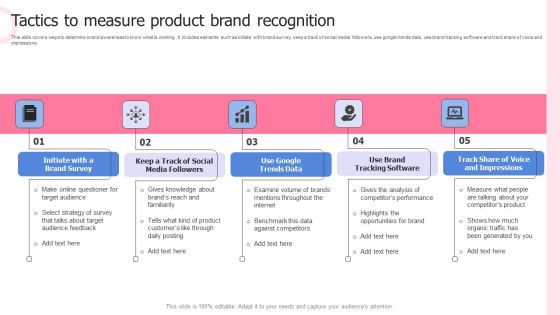
Tactics To Measure Product Brand Recognition Diagrams PDF
This slide covers ways to determine brand awareness to know what is working . It includes elements such as initiate with brand survey, keep a track of social media followers, use google trends data, use brand tracking software and track share of voice and impressions. Presenting Tactics To Measure Product Brand Recognition Diagrams PDF to dispense important information. This template comprises five stages. It also presents valuable insights into the topics including Use Google Trends Data, Use Brand Tracking Software, Brand Survey. This is a completely customizable PowerPoint theme that can be put to use immediately. So, download it and address the topic impactfully.

Process Of Consumer Partition Using Machine Learning Diagrams PDF
This slide presents process of customer segmentation using machine learning to improve marketing strategies. The steps include design business case, prepare data, develop segments, tune hyperparameters and visualization of results. Presenting Process Of Consumer Partition Using Machine Learning Diagrams PDF to dispense important information. This template comprises five stages. It also presents valuable insights into the topics including Design Business Case, Prepare Data, Develop Segments, Tune Hyperparameters, Visualization Of Results. This is a completely customizable PowerPoint theme that can be put to use immediately. So, download it and address the topic impactfully.

Colorful Infographic For Text Representation Powerpoint Templates
Our above business diagram has been designed with colorful circular tags with icons. This slide is suitable for text representation in visual manner. Use this business diagram to present your work in a more smart and precise manner.
