AI PPT Maker
Templates
PPT Bundles
Design Services
Business PPTs
Business Plan
Management
Strategy
Introduction PPT
Roadmap
Self Introduction
Timelines
Process
Marketing
Agenda
Technology
Medical
Startup Business Plan
Cyber Security
Dashboards
SWOT
Proposals
Education
Pitch Deck
Digital Marketing
KPIs
Project Management
Product Management
Artificial Intelligence
Target Market
Communication
Supply Chain
Google Slides
Research Services
 One Pagers
All Categories
-
Home
- Customer Favorites
- Data Icon
Data Icon

Percentage Symbol With Text Holders Ppt PowerPoint Presentation Example 2015
This is a percentage symbol with text holders ppt powerpoint presentation example 2015. This is a three stage process. The stages in this process are percentage icon, dividend icon, portion icon.
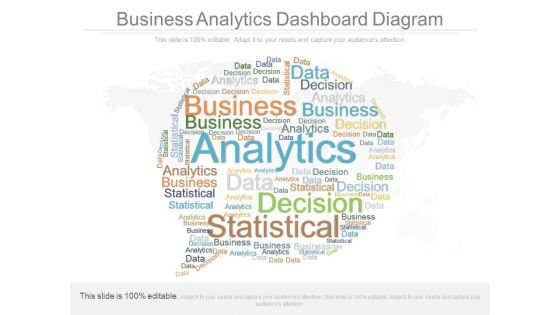
Business Analytics Dashboard Diagram
This is a business analytics dashboard diagram. This is a one stage process. The stages in this process are analytics, decision, data, business, statistics.

Organizational Change Management Process Flow Dashboard Ppt PowerPoint Presentation Diagram PDF
This slide covers Business change management lifecycle dashboard. It involves overall health, customer data, financials and operational efficiency. Pitch your topic with ease and precision using this Organizational Change Management Process Flow Dashboard Ppt PowerPoint Presentation Diagram PDF. This layout presents information on Financial Data, Operational Efficiency, Consumer Data. It is also available for immediate download and adjustment. So, changes can be made in the color, design, graphics or any other component to create a unique layout.
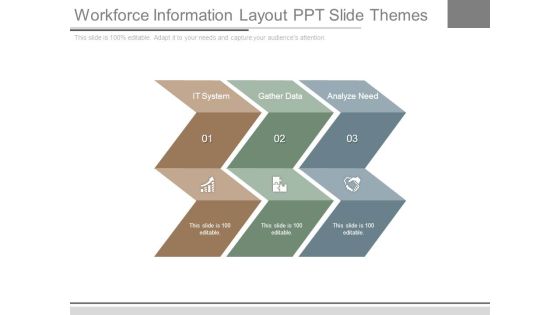
Workforce Information Layout Ppt Slide Themes
This is a workforce information layout ppt slide themes. This is a three stage process. The stages in this process are it system, gather data, analyze need.
Laptop With Gears Software Testing Ppt PowerPoint Presentation Infographic Template Sample
This is a laptop with gears software testing ppt powerpoint presentation infographic template sample. This is a two stage process. The stages in this process are metrics icon, kpis icon, statistics icon.

Bar Chart For Business Performance Evaluation Ppt PowerPoint Presentation Infographics Professional
This is a bar chart for business performance evaluation ppt powerpoint presentation infographics professional. This is a five stage process. The stages in this process are metrics icon, kpis icon, statistics icon.

Website Maintenance And Support Design And Development Ppt PowerPoint Presentation Inspiration Outfit
This is a website maintenance and support design and development ppt powerpoint presentation inspiration outfit. This is a five stage process. The stages in this process are metrics icon, kpis icon, statistics icon.

Database Diagram Example Ppt Slides
This is a database diagram example ppt slides. This is a four stage process. The stages in this process are information, flowchart, data, design.

Security Process Diagram Powerpoint Presentation
This is a security process diagram powerpoint presentation. This is a four stage process. The stages in this process are data, policy, assess, identify risk.

Human Respiratory System Vector With Text Holders Ppt PowerPoint Presentation Gallery Ideas
This is a human respiratory system vector with text holders ppt powerpoint presentation gallery ideas. This is a three stage process. The stages in this process are lung icon, pulmonary vein icon, respiratory organ icon.
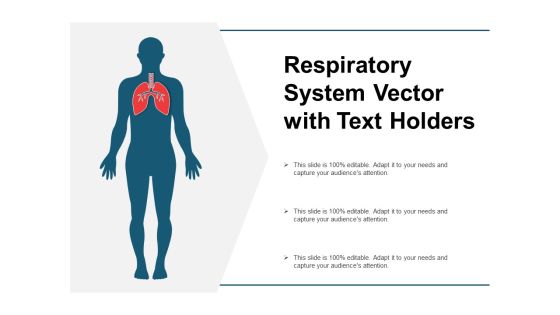
Respiratory System Vector With Text Holders Ppt PowerPoint Presentation Show Design Ideas
This is a respiratory system vector with text holders ppt powerpoint presentation show design ideas. This is a three stage process. The stages in this process are lung icon, pulmonary vein icon, respiratory organ icon.

Acceptance Or Rejection Signs With Text Holders Ppt Powerpoint Presentation Infographics Structure
This is a acceptance or rejection signs with text holders ppt powerpoint presentation infographics structure. This is a two stage process. The stages in this process are correct incorrect icon, dos and do not icon, right and wrong icon.

Correct And Incorrect Signs With Text Holders Ppt Powerpoint Presentation Professional Backgrounds
This is a correct and incorrect signs with text holders ppt powerpoint presentation professional backgrounds. This is a two stage process. The stages in this process are correct incorrect icon, dos and do not icon, right and wrong icon.

Right And Wrong Signs With Text Holders Ppt Powerpoint Presentation File Background Designs
This is a right and wrong signs with text holders ppt powerpoint presentation file background designs. This is a two stage process. The stages in this process are correct incorrect icon, dos and do not icon, right and wrong icon.

Sales Effectiveness Improvement Diagram Ppt Sample
This is a sales effectiveness improvement diagram ppt sample. This is a four stage process. The stages in this process are people, process, technology, data, iterate and repeat.

Business To Business Survey Diagram Powerpoint Layout
This is a Business To Business Survey Diagram Powerpoint Layout. This is a six stage process. The stages in this process are research, analysis, data, business, customer, search.
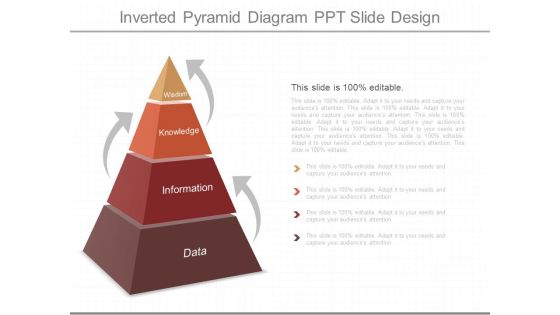
Inverted Pyramid Diagram Ppt Slide Design
This is a inverted pyramid diagram ppt slide design. This is a four stage process. The stages in this process are wisdom, knowledge, information, data.

Kpi Dashboard Diagram Example Of Ppt Presentation
This is a kpi dashboard diagram example of ppt presentation. This is a five stage process. The stages in this process are business, direction, objectives, data, study.
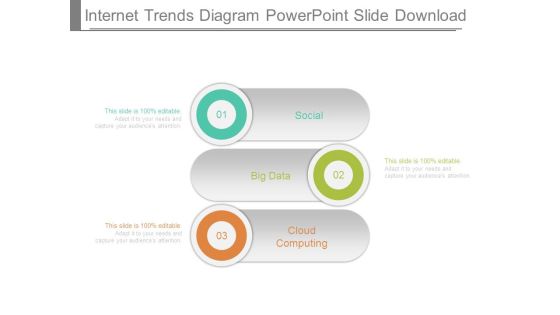
Internet Trends Diagram Powerpoint Slide Download
This is a internet trends diagram powerpoint slide download. This is a three stage process. The stages in this process are social, big data, cloud computing.

Company Credit Risk Template Diagram Ppt Slides
This is a company credit risk template diagram ppt slides. This is a four stage process. The stages in this process are customer data, decisions, risk, classification.

Service Construction Ppt Diagram Presentation Ideas
This is a service construction ppt diagram presentation ideas. This is a four stage process. The stages in this process are business process, data, service design, success.
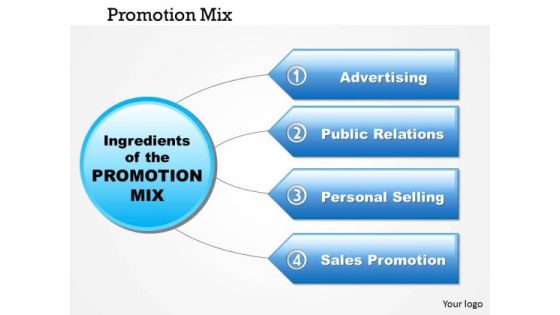
Business Framework Promotion Mix PowerPoint Presentation
This innovative diagram has been designed to display project management data. Use this diagram in business and marketing presentations. This diagram will enhance the quality of your presentations.

Research Approach Workflow Chart Ppt PowerPoint Presentation Gallery Vector PDF
Presenting research approach workflow chart ppt powerpoint presentation gallery vector pdf to dispense important information. This template comprises three stages. It also presents valuable insights into the topics including collection of data, analysis of data, hypothesis building. This is a completely customizable PowerPoint theme that can be put to use immediately. So, download it and address the topic impactfully.
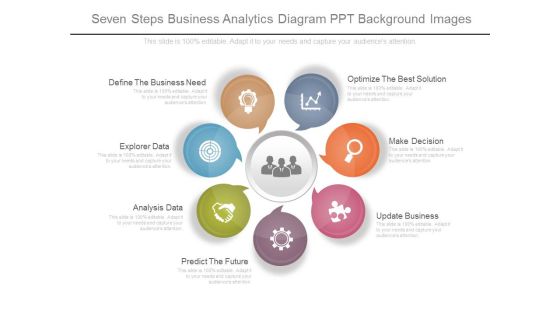
Seven Steps Business Analytics Diagram Ppt Background Images
This is a seven steps business analytics diagram ppt background images. This is a seven stage process. The stages in this process are optimize the best solution, make decision, update business, predict the future, analysis data, explorer data, define the business need.

PowerPoint Theme Ring Chart Diagram Growth Ppt Template
PowerPoint Theme Ring Chart Diagram Growth PPT Template-Use this graphical approach to represent global business issues such as financial data, stock market Exchange, increase in sales, corporate presentations and more.-PowerPoint Theme Ring Chart Diagram Growth PPT Template

Core Strategic Segmentation Powerpoint Ideas
This is a core strategic segmentation powerpoint ideas. This is a five stage process. The stages in this process are data, diagram, business, marketing, analysis.

Costs Of Marketing Sample Ppt Presentation
This is a costs of marketing sample ppt presentation. This is a five stage process. The stages in this process are data, diagram, business, marketing, analysis, collection.
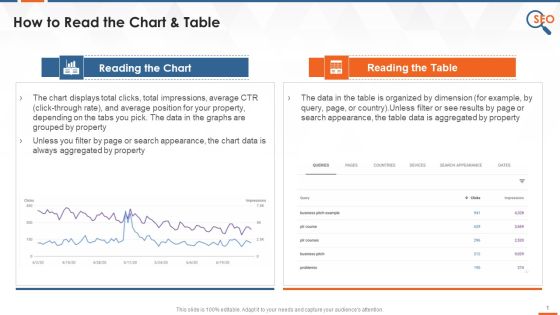
Reading Charts And Tables In Google Search Console Training Ppt
This slide covers how a user can read charts and tables in the google search console. It also depicts that Unless users filter by page or search appearance, the chart data, as well as table data, will always be aggregated by property.

Distinct Red Folder In Row Of Folders PowerPoint Templates Ppt Backgrounds For Slides 0113
We present our Distinct Red Folder In Row Of Folders PowerPoint Templates PPT Backgrounds For Slides 0113.Download our Computer PowerPoint Templates because Our PowerPoint Templates and Slides will let Your superior ideas hit the target always and everytime. Download our Business PowerPoint Templates because Our PowerPoint Templates and Slides will fulfill your every need. Use them and effectively satisfy the desires of your audience. Use our Finance PowerPoint Templates because Our PowerPoint Templates and Slides will let you Leave a lasting impression to your audiences. They possess an inherent longstanding recall factor. Download our Signs PowerPoint Templates because Our PowerPoint Templates and Slides will let you Hit the target. Go the full distance with ease and elan. Download and present our Security PowerPoint Templates because Our PowerPoint Templates and Slides are created by a hardworking bunch of busybees. Always flitting around with solutions gauranteed to please.Use these PowerPoint slides for presentations relating to Folder icons row with one selected, computer, business, finance, signs, security. The prominent colors used in the PowerPoint template are Yellow, White, Red. Professionals tell us our Distinct Red Folder In Row Of Folders PowerPoint Templates PPT Backgrounds For Slides 0113 look good visually. PowerPoint presentation experts tell us our business PowerPoint templates and PPT Slides will get their audience's attention. You can be sure our Distinct Red Folder In Row Of Folders PowerPoint Templates PPT Backgrounds For Slides 0113 provide great value for your money. Be assured of finding the best projection to highlight your words. PowerPoint presentation experts tell us our one PowerPoint templates and PPT Slides are designed to make your presentations professional. We assure you our Distinct Red Folder In Row Of Folders PowerPoint Templates PPT Backgrounds For Slides 0113 are aesthetically designed to attract attention. We guarantee that they will grab all the eyeballs you need. PowerPoint presentation experts tell us our one PowerPoint templates and PPT Slides will help them to explain complicated concepts.

Business Framework Statistical Process Control And Quality Improvement Ppt Presentation
Multileveled process flow diagram has been used to design this business framework diagram. This diagram contains the process control and quality improvement concept. Use this diagram for marketing and business related presentations.

Multi Step Process Of Consumer Partition Slides PDF
This slide consists of a basic process of customer segmentation which can be followed by business managers to develop high value segments. The steps include establishing goals, gather data, analyze data, define segments, implement targeting strategies and review results. Presenting Multi Step Process Of Consumer Partition Slides PDF to dispense important information. This template comprises six stages. It also presents valuable insights into the topics including Establishing Goals, Gather Data, Analyze Data, Define Segments, Implement Targeting Strategies, Review Results. This is a completely customizable PowerPoint theme that can be put to use immediately. So, download it and address the topic impactfully.

Technology Process Steps Infographics Powerpoint Template
Communicate with your group through this professional slide. It contains graphics of tags with icons. This PowerPoint template is suitable for topics like technology and communication.
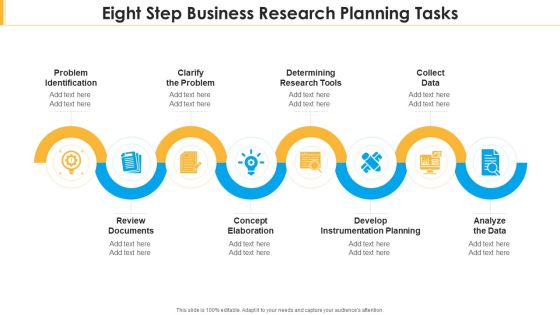
Eight Step Business Research Planning Tasks Diagrams PDF
Presenting eight step business research planning tasks diagrams pdf to dispense important information. This template comprises eight stages. It also presents valuable insights into the topics including analyze the data, develop instrumentation planning, collect data. This is a completely customizable PowerPoint theme that can be put to use immediately. So, download it and address the topic impactfully.
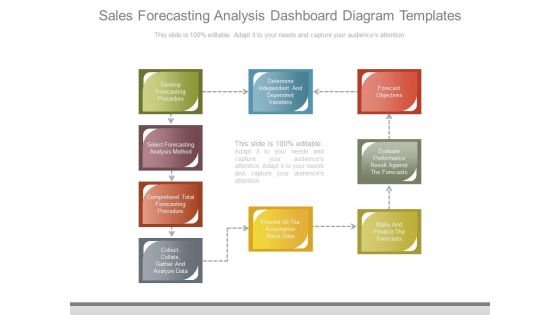
Sales Forecasting Analysis Dashboard Diagram Templates
This is a sales forecasting analysis dashboard diagram templates. This is a nine stage process. The stages in this process are develop forecasting procedure, select forecasting analysis method, comprehend total forecasting procedure, collect collate gather and analyze data, determine independent and dependent variables, present all the assumption about data, forecast objectives, evaluate performance result against the forecasts, make and finalize the forecasts.

Computer Screen For Operating Systems And Control Ppt PowerPoint Presentation Show Files
This is a computer screen for operating systems and control ppt powerpoint presentation show files. This is a three stage process. The stages in this process are computer icon, desktop icon, laptop screen icon.

Computer Screen Vector With Five Points Ppt PowerPoint Presentation Infographics Guidelines
This is a computer screen vector with five points ppt powerpoint presentation infographics guidelines. This is a five stage process. The stages in this process are computer icon, desktop icon, laptop screen icon.

Computer Screen With Rocket For Startup Planning Ppt PowerPoint Presentation Inspiration Tips
This is a computer screen with rocket for startup planning ppt powerpoint presentation inspiration tips. This is a five stage process. The stages in this process are computer icon, desktop icon, laptop screen icon.

Effective Social Media For Network Marketing Ppt PowerPoint Presentation Outline
This is a effective social media for network marketing ppt powerpoint presentation outline. This is a four stage process. The stages in this process are computer icon, desktop icon, laptop screen icon.

Implementation Phase Ppt PowerPoint Presentation Professional Styles
This is a implementation phase ppt powerpoint presentation professional styles. This is a six stage process. The stages in this process are technical adjustment, adjustment of process or erp system, migration of master data, documentation and monitoring, system tests.

Jigsaw Depicting 10 Stages Of Continual Service Improvement Process Diagrams PDF
Presenting Jigsaw Depicting 10 Stages Of Continual Service Improvement Process Diagrams PDF to dispense important information. This template comprises ten stages. It also presents valuable insights into the topics including Gather Data, Analyze Data, Implement. This is a completely customizable PowerPoint theme that can be put to use immediately. So, download it and address the topic impactfully.
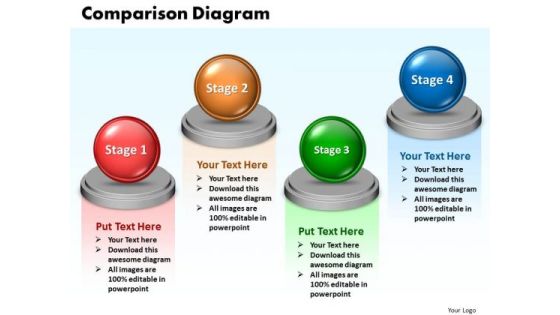
Ppt Comparison Network Diagram PowerPoint Template 4 Phase Templates
PPT comparison network diagram powerpoint template 4 phase Templates-This PowerPoint diagram slide shows four opposing views. You can use the This PowerPoint diagram slide to represent views from different functions on an issue.-PPT comparison network diagram powerpoint template 4 phase Templates-Abstract, Achievement, Business, Chart, Comparison, Concepts, Data, Descriptive, Design, Development, Diagram, Element, Figure, Finance, Financial, Graph, Graphic, Growth, Icon, Ideas, Improvement, Investment, Market, Money, Progress, Raise, Real, Report, Revenue, Sale, Shape, Sign, Silhouette, Stock, Success, Symbol, Technology
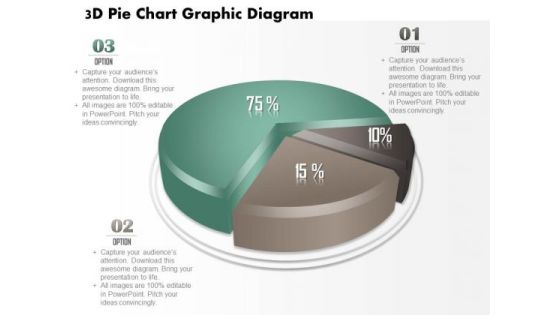
Business Diagram 3d Pie Chart Graphic Diagram PowerPoint Ppt Presentation
This business diagram displays 3d pie chart. It contains pie chart with percentage ratios. This pie chart is a visual way of displaying data. Use this diagram to make outstanding presentations.

Ppt Circular PowerPoint Menu Template Scheme 8 Phase Diagram Templates
PPT circular powerpoint menu template scheme 8 phase diagram Templates-Use this graphical approach to represent global business issues such as financial data, stock market Exchange, increase in sales, corporate presentations and more. It illustrates the second stage of the process.-PPT circular powerpoint menu template scheme 8 phase diagram Templates-Arrow, Art, Blue, Business, Button, Circular, Clip, Design, Diagram, Drop, Element, Glowing, Graph, Graphic, Icon, Illustration, Isolated, Process, Round, Set, Shadow, Sphere, Symbol

New Product Introduction In The Market Sales Forecasting Ppt PowerPoint Presentation Visual Aids Pictures PDF
Presenting this set of slides with name new product introduction in the market sales forecasting ppt powerpoint presentation visual aids pictures pdf. The topics discussed in these slides are historical data, projected data. This is a completely editable PowerPoint presentation and is available for immediate download. Download now and impress your audience.

Ppt Summary Of 4 State PowerPoint Project Diagram Involved Mechanism Templates
PPT summary of 4 state powerpoint project diagram involved mechanism Templates-This diagram is a graphical illustration of the relationships between and among sets of data, groups of objects that share something in common. They are indicators of the path you have in mind.-PPT summary of 4 state powerpoint project diagram involved mechanism Templates-abstract, background, balance, business, circle, colorful, complement, concept, conceptual, connected, control, cooperation, design, gear, harmony, icon, ideal, illustration, involved, machine, progress, rhythm, round, shape, spin, support, system, teamwork, technology, together, wheel

System Integration Vector Online Backup And Cloud Storage Ppt Powerpoint Presentation Professional Pictures
This is a system integration vector online backup and cloud storage ppt powerpoint presentation professional pictures. This is a three stage process. The stages in this process are combination icon, incorporation icon, integration icon.

Robot With Bulb For Artificial Intelligence Ppt PowerPoint Presentation Show Backgrounds
This is a robot with bulb for artificial intelligence ppt powerpoint presentation show backgrounds. This is a one stage process. The stages in this process are machine learning icon, ai icon, artificial intelligence icon.

Robot With Right And Wrong Symbol Ppt PowerPoint Presentation Inspiration Show
This is a robot with right and wrong symbol ppt powerpoint presentation inspiration show. This is a one stage process. The stages in this process are machine learning icon, ai icon, artificial intelligence icon.
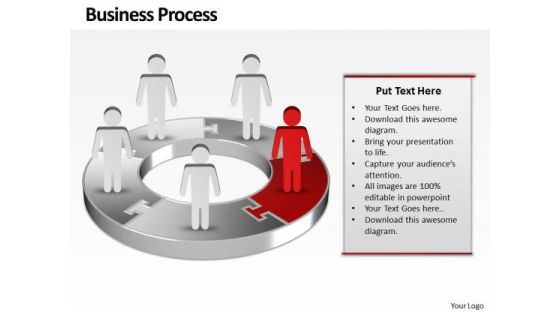
Ppt Red Men Standing On Business PowerPoint Theme Pie Chart Templates
PPT red men standing on business powerpoint theme pie chart Templates-Use this graphical approach to represent global business issues such as financial data, stock market Exchange, increase in sales, corporate presentations and more.-PPT red men standing on business powerpoint theme pie chart Templates-3d, arrow, background, blue, chart, circle, circular, clipart, colorful, connection, continuity, cycle, cyclic, diagram, direction, flow, graph, icon, illustration, isolated, loop, motion, process, progress, recycle, ring, round, step, sticker, symbol, teamwork, template, turn, vector

Ppt Red White And Blue PowerPoint Theme Circlular Arrow Marketing Strategy Templates
PPT red white and blue powerpoint theme circlular arrow marketing strategy Templates-Use this graphical approach to represent global business issues such as financial data, stock market Exchange, increase in sales, corporate presentations and more.-PPT red white and blue powerpoint theme circlular arrow marketing strategy Templates-3d, Advertisement, Advertising, Arrow, Border, Business, Circles, Collection, Customer, Design, Element, Icon, Idea, Illustration, Info, Information, Isolated, Label, Light, Location, Needle, New, Notification, Notify, Point, Pointer, Promotion, Role, Rounded

Implementation Phase Ppt PowerPoint Presentation Slides Background Images
This is a implementation phase ppt powerpoint presentation slides background images. This is a six stage process. The stages in this process are technical adjustment, documentation and monitoring, adjustment of process or erp system, system tests, migration of master data.

Web Analytics Diagram Ppt Slides Themes
This is a web analytics diagram ppt slides themes. This is a three stage process. The stages in this process are build, analyse, measure, test alternatives, optimise, collect data, define goals, report, implement.

Dashboard For Real Time Telemarketing Process Management Themes PDF
The following slide highlights the dashboard for real time telesales process management illustrating real time data, employee data, performance, daily data, average handled call vs average answered call, employee ranking, AHT, AvgACW, ASA and hold percentage Showcasing this set of slides titled dashboard for real time telemarketing process management themes pdf The topics addressed in these templates are dashboard for real time telemarketing process management All the content presented in this PPT design is completely editable. Download it and make adjustments in color, background, font etc. as per your unique business setting.

Machine Learning Main Points Ppt PowerPoint Presentation Diagram Graph Charts
This is a machine learning main points ppt powerpoint presentation diagram graph charts. This is a four stages process. The stages in this process are learning, pattern detection, programming, data, machine learning main points.
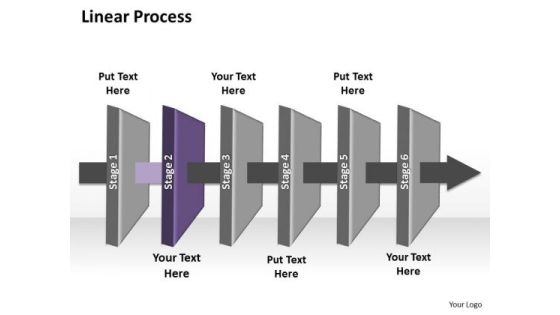
Ppt Direct Flow Of Marketing Startegy Ishikawa Diagram PowerPoint Template Templates
PPT direct flow of marketing startegy ishikawa diagram powerpoint template Templates-Use this graphical approach to represent global business issues such as financial data, stock market Exchange, increase in sales, corporate presentations and more. It Signifies common, comprehensive, extensive, global, international, multinational, omnipresent, planetary, ubiquitous, universal etc.-PPT direct flow of marketing startegy ishikawa diagram powerpoint template Templates-3d, Air, Arrow, Art, Business, Chart, Clip, Clipart, Cooling, Diagram, Drip, Drop, Dry, Energy, Eps10, Evaporate, Evaporating, Evaporation, Graphic, Heat, Icon, Illustration, Isolated, Isometric, Layers, Material, Moisture, Process

Ppt Homogenuous Representation By 6 Shapes Arrows PowerPoint Templates
PPT homogenuous representation by 6 shapes arrows powerpoint Templates-Use this graphical approach to represent global business issues such as financial data, stock market Exchange, increase in sales, corporate presentations and more. This image has been conceived to enable you to emphatically communicate your ideas in your Business, Marketing PPT presentation.-PPT homogenuous representation by 6 shapes arrows powerpoint Templates-Arrow, Background, Process, Business, Chart, Diagram, Financial, Graphic, Gray, Icon, Illustration, Management, Orange, Perspective, Planning Process, Stages, Steps, Text, Transparency

Ppt Linear Flow 3 Stages1 PowerPoint Templates
PPT linear flow 3 stages1 PowerPoint Templates-This PowerPoint Diagram can be used to represent worldwide business issues such as financial data, stock market Exchange, increase in sales, corporate presentations and more. It illustrates the blue component of this worldwide PowerPoint Diagram.-PPT linear flow 3 stages1 PowerPoint Templates-Abstract, Arrow, Blank, Business, Chart, Circular, Circulation, Concept, Conceptual, Design, Diagram, Executive, Icon, Idea, Illustration, Management, Model, Numbers, Organization, Procedure, Process, Progression, Resource, Sequence, Sequential, 3Stages, Steps, Strategy

Ppt Direct Demonstration Of Process Using Arrows Download PowerPoint Layouts Templates
PPT direct demonstration of process using arrows download powerpoint layouts Templates-Use this graphical approach to represent global business issues such as financial data, stock market Exchange, increase in sales, corporate presentations and more. It Signifies common, comprehensive, extensive, global, international, multinational, omnipresent, planetary, ubiquitous, universal etc.-PPT direct demonstration of process using arrows download powerpoint layouts Templates-Aim, Arrow, Arrowheads, Badge, Border, Click, Connection, Curve, Design, Direction, Download, Element, Fuchsia, Icon, Illustration, Indicator, Internet, Magenta, Mark, Object, Orientation, Pointer, Shadow, Shape, Sign

Artificial Intelligence Process With Essential Methods For Engineering Workflow Ppt PowerPoint Presentation File Demonstration PDF
Presenting artificial intelligence process with essential methods for engineering workflow ppt powerpoint presentation file demonstration pdf to dispense important information. This template comprises four stages. It also presents valuable insights into the topics including access data, analyze data, develop. This is a completely customizable PowerPoint theme that can be put to use immediately. So, download it and address the topic impactfully.

Jigsaw Depicting 7 Stages Of Continual Service Improvement Process Mockup PDF
Presenting Jigsaw Depicting 7 Stages Of Continual Service Improvement Process Mockup PDF to dispense important information. This template comprises seven stages. It also presents valuable insights into the topics including Gather Data, Analyze Data, Implement Corrective Action. This is a completely customizable PowerPoint theme that can be put to use immediately. So, download it and address the topic impactfully.

Jigsaw Depicting 8 Stages Of Continual Service Improvement Process Inspiration PDF
Presenting Jigsaw Depicting 8 Stages Of Continual Service Improvement Process Inspiration PDF to dispense important information. This template comprises eight stages. It also presents valuable insights into the topics including Gather Data, Analyze Data, Implement Corrective Action. This is a completely customizable PowerPoint theme that can be put to use immediately. So, download it and address the topic impactfully.

Jigsaw Depicting 9 Stages Of Continual Service Improvement Process Slides PDF
Presenting Jigsaw Depicting 9 Stages Of Continual Service Improvement Process Slides PDF to dispense important information. This template comprises nine stages. It also presents valuable insights into the topics including Gather Data, Analyze Data, Implement. This is a completely customizable PowerPoint theme that can be put to use immediately. So, download it and address the topic impactfully.

Jigsaw Depicting 11 Stages Of Continual Service Improvement Process Topics PDF
Presenting Jigsaw Depicting 11 Stages Of Continual Service Improvement Process Topics PDF to dispense important information. This template comprises eleven stages. It also presents valuable insights into the topics including Analyze Data, Implement Corrective Action, Analyze Data. This is a completely customizable PowerPoint theme that can be put to use immediately. So, download it and address the topic impactfully.

Jigsaw Depicting 12 Stages Of Continual Service Improvement Process Structure PDF
Presenting Jigsaw Depicting 12 Stages Of Continual Service Improvement Process Structure PDF to dispense important information. This template comprises tweleve stages. It also presents valuable insights into the topics including Analyze Data, Implement Corrective Action, Gather Data. This is a completely customizable PowerPoint theme that can be put to use immediately. So, download it and address the topic impactfully.
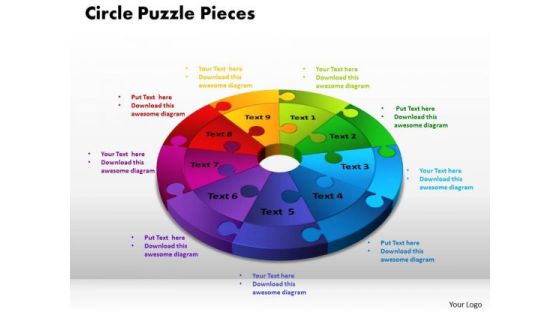
PowerPoint Process Circle Puzzle Pieces Business Ppt Theme
PowerPoint Process Circle Puzzle Pieces Business PPT Theme-This diagram is a graphical illustration of the relationships between and among sets of data, groups of objects.-PowerPoint Process Circle Puzzle Pieces Business PPT Theme

Ppt Arrow Illustration Of 4 Concepts PowerPoint Templates
PPT arrow illustration of 4 concepts PowerPoint Templates-Use this Diagram to display the data. It make easier for the analysts to visualize and interpret the data-PPT arrow illustration of 4 concepts PowerPoint Templates-3d, Abstract, Around, Arrows, Blue, Border, Business, Center, Circle, Circular, Concept, Connections, Copy, Curve, Cycle, Directions, Distribution, Illustration, Management, Middle, Objects, Pieces, Plan, Pointing, Process, Recycle, Rounded, Shadows, Space, System
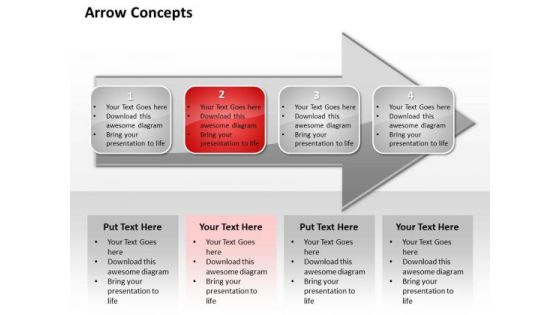
Ppt Illustration Of Concept Free Download Concepts PowerPoint Templates
PPT illustration of concept free download concepts PowerPoint Templates-Use this Diagram to display the data. It makes easier for the analysts to visualize and interpret the data-PPT illustration of concept free download concepts PowerPoint Templates-3d, Abstract, Around, Arrows, Blue, Border, Business, Center, Circle, Circular, Concept, Connections, Copy, Curve, Cycle, Directions, Distribution, Illustration, Management, Middle, Objects, Pieces, Plan, Pointing, Process, Recycle, Rounded, Shadows, Space, System
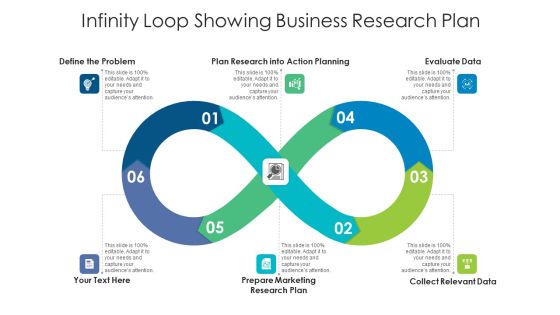
Infinity Loop Showing Business Research Plan Ppt PowerPoint Presentation File Design Templates PDF
Presenting infinity loop showing business research plan ppt powerpoint presentation file design templates pdf to dispense important information. This template comprises six stages. It also presents valuable insights into the topics including action planning, evaluate data, collect relevant data. This is a completely customizable PowerPoint theme that can be put to use immediately. So, download it and address the topic impactfully.

5 Piece Wheel For Organization Market Research Ppt Model Styles PDF
Presenting 5 Piece Wheel For Organization Market Research Ppt Model Styles PDF to dispense important information. This template comprises five stages. It also presents valuable insights into the topics including Analyze Your Data, Interpretation Your Result, Visualize Your Data. This is a completely customizable PowerPoint theme that can be put to use immediately. So, download it and address the topic impactfully.

6 Piece Wheel For Organization Market Research Ppt Inspiration Graphic Tips PDF
Presenting 6 Piece Wheel For Organization Market Research Ppt Inspiration Graphic Tips PDF to dispense important information. This template comprises six stages. It also presents valuable insights into the topics including Analyze Your Data, Interpretation Your Result, Visualize Your Data. This is a completely customizable PowerPoint theme that can be put to use immediately. So, download it and address the topic impactfully.

7 Piece Wheel For Organization Market Research Ppt Infographic Template Design Templates PDF
Presenting 7 Piece Wheel For Organization Market Research Ppt Infographic Template Design Templates PDF to dispense important information. This template comprises seven stages. It also presents valuable insights into the topics including Analyze Your Data, Interpretation Your Result, Visualize Your Data. This is a completely customizable PowerPoint theme that can be put to use immediately. So, download it and address the topic impactfully.

8 Piece Wheel For Organization Market Research Ppt Ideas Shapes PDF
Presenting 8 Piece Wheel For Organization Market Research Ppt Ideas Shapes PDF to dispense important information. This template comprises eight stages. It also presents valuable insights into the topics including Analyze Your Data, Interpretation Your Result, Visualize Your Data. This is a completely customizable PowerPoint theme that can be put to use immediately. So, download it and address the topic impactfully.

9 Piece Wheel For Organization Market Research Ppt Portfolio Layouts PDF
Presenting 9 Piece Wheel For Organization Market Research Ppt Portfolio Layouts PDF to dispense important information. This template comprises nine stages. It also presents valuable insights into the topics including Analyze Your Data, Interpretation Your Result, Visualize Your Data. This is a completely customizable PowerPoint theme that can be put to use immediately. So, download it and address the topic impactfully.

10 Piece Wheel For Organization Market Research Ppt File Samples PDF
Presenting 10 Piece Wheel For Organization Market Research Ppt File Samples PDF to dispense important information. This template comprises ten stages. It also presents valuable insights into the topics including Analyze Your Data, Interpretation Your Result, Visualize Your Data. This is a completely customizable PowerPoint theme that can be put to use immediately. So, download it and address the topic impactfully.

11 Piece Wheel For Organization Market Research Ppt Styles Graphics Example PDF
Presenting 11 Piece Wheel For Organization Market Research Ppt Styles Graphics Example PDF to dispense important information. This template comprises eleven stages. It also presents valuable insights into the topics including Analyze Your Data, Interpretation Your Result, Visualize Your Data. This is a completely customizable PowerPoint theme that can be put to use immediately. So, download it and address the topic impactfully.

12 Piece Wheel For Organization Market Research Ppt Layouts Layout PDF
Presenting 12 Piece Wheel For Organization Market Research Ppt Layouts Layout PDF to dispense important information. This template comprises tweleve stages. It also presents valuable insights into the topics including Analyze Your Data, Interpretation Your Result, Visualize Your Data. This is a completely customizable PowerPoint theme that can be put to use immediately. So, download it and address the topic impactfully.

Business Diagram Four Options Layout Diagram For Business Presentation Template
Four options circular diagram is used to design this power point template. This business diagram can be used to compare and present data. Use this diagram to make your presentations more effective.

Planned Statistics Assessment Template Powerpoint Themes
This is a planned statistics assessment template powerpoint themes. This is a eight stage process. The stages in this process are cleanse, group, stakeholder and users, technology and infrastructure, process and data, analyze, validate, collect.

Business Diagram Four Staged Gears Process Diagram Presentation Template
This business slide depicts four staged gears process diagram. This diagram can help by summarizing the key features of the data. Use this editable diagram for your business and management related presentations.

Mobile Relationship Management Diagram Presentation Powerpoint Templates
This is a mobile relationship management diagram presentation powerpoint templates. This is a four stage process. The stages in this process are strategy, execution, data, transaction, engagement, awareness, loyalty.

Chart Illustrating Manufacturing Plant Energy Consumption Statistics Slides PDF
This graph or chart is linked to excel, and changes automatically based on data. Just left click on it and select edit data. Pitch your topic with ease and precision using this Chart Illustrating Manufacturing Plant Energy Consumption Statistics Slides PDF. This layout presents information on Equipment Inefficiency, Process Heating, Energy Export. It is also available for immediate download and adjustment. So, changes can be made in the color, design, graphics or any other component to create a unique layout.
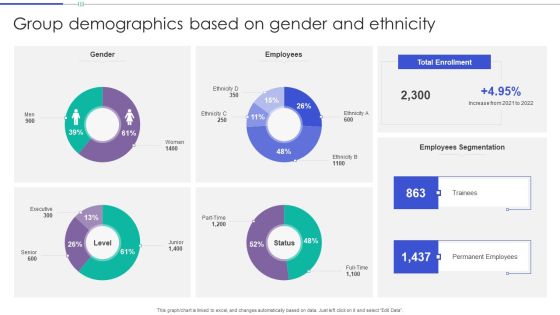
Group Demographics Based On Gender And Ethnicity Themes PDF
This graph or chart is linked to excel, and changes automatically based on data. Just left click on it and select Edit Data. Showcasing this set of slides titled Group Demographics Based On Gender And Ethnicity Themes PDF. The topics addressed in these templates are Gender, Employees, Total Enrollment. All the content presented in this PPT design is completely editable. Download it and make adjustments in color, background, font etc. as per your unique business setting.

Construction Management Dashboard With Productivity And Worked Hours Themes PDF
This graph for chart is linked to excel, and changes automatically based on data. Just left click on it and select Edit Data. Deliver an awe inspiring pitch with this creative Construction Management Dashboard With Productivity And Worked Hours Themes PDF bundle. Topics like Teams, Employees, Overall Construction Management Efficiency, Remuneration, Work Environment can be discussed with this completely editable template. It is available for immediate download depending on the needs and requirements of the user.

Automobile Sales Scorecard Scorecard For Global Auto Sales Themes PDF
This graph or chart is linked to excel, and changes automatically based on data. Just left click on it and select Edit Data. Deliver and pitch your topic in the best possible manner with this Automobile Sales Scorecard Scorecard For Global Auto Sales Themes PDF. Use them to share invaluable insights on Scorecard For Global, Auto Sales Global and impress your audience. This template can be altered and modified as per your expectations. So, grab it now.

Business Diagram Four Staged Circular Gear Diagram For Process Control Presentation Template
This business slide depicts four staged circular gears diagram. This diagram can help by summarizing the key features of the data. Use this editable diagram for your business and management related presentations.

Planned Statistics Assessment Template Ppt Diagrams
This is a planned statistics assessment template ppt diagrams. This is a eight stage process. The stages in this process are quality context, competitors, stakeholders and users, processes and data, resources, evaluation, tools and techniques, structure.
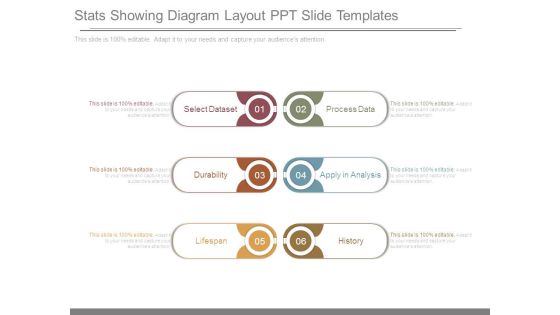
Stats Showing Diagram Layout Ppt Slide Templates
This is a stats showing diagram layout ppt slide templates. This is a six stage process. The stages in this process are select dataset, durability, lifespan, process data, apply in analysis, history.
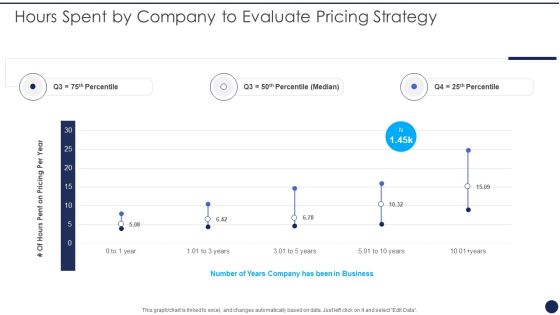
Hours Spent By Company To Evaluate Pricing Strategy Product Pricing Strategies Analysis Themes PDF
This graph or chart is linked to excel, and changes automatically based on data. Just left click on it and select Edit Data. Deliver and pitch your topic in the best possible manner with this Hours Spent By Company To Evaluate Pricing Strategy Product Pricing Strategies Analysis Themes PDF. Use them to share invaluable insights on Pricing Per Year, Number Years Business and impress your audience. This template can be altered and modified as per your expectations. So, grab it now.
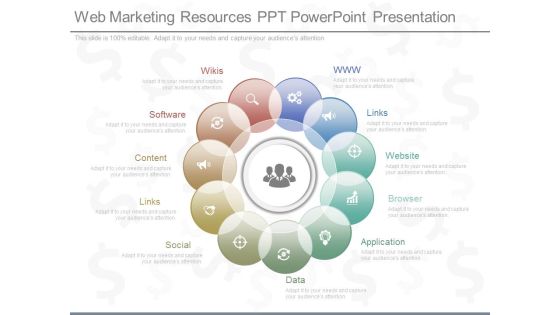
Web Marketing Resources Ppt Powerpoint Presentation
This is a web marketing resources ppt powerpoint presentation. This is a eleven stage process. The stages in this process are www, links, website, browser, application, data, social, links, content, software, wikis.
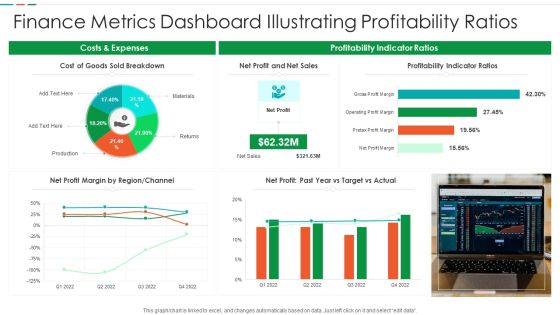
Finance Metrics Dashboard Illustrating Profitability Ratios Diagrams PDF
This graph or chart is linked to excel, and changes automatically based on data. Just left click on it and select edit data. Pitch your topic with ease and precision using this Finance Metrics Dashboard Illustrating Profitability Ratios Diagrams PDF. This layout presents information on Cost Goods Sold, Net Profit Net, Sales Profitability Indicator. It is also available for immediate download and adjustment. So, changes can be made in the color, design, graphics or any other component to create a unique layout.
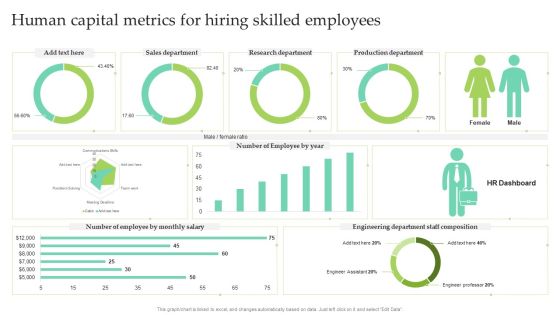
Human Capital Metrics For Hiring Skilled Employees Ppt Slides Themes PDF
This graph or chart is linked to excel, and changes automatically based on data. Just left click on it and select Edit Data. Showcasing this set of slides titled Human Capital Metrics For Hiring Skilled Employees Ppt Slides Themes PDF. The topics addressed in these templates are Sales Department, Research Department, Production Department. All the content presented in this PPT design is completely editable. Download it and make adjustments in color, background, font etc. as per your unique business setting.

Active Approval Salesforce Layout Powerpoint Themes
This is a active approval salesforce layout powerpoint themes. This is a five stage process. The stages in this process are proposal management, vision and strategy, technology and data, configuration and pricing, approvals management.
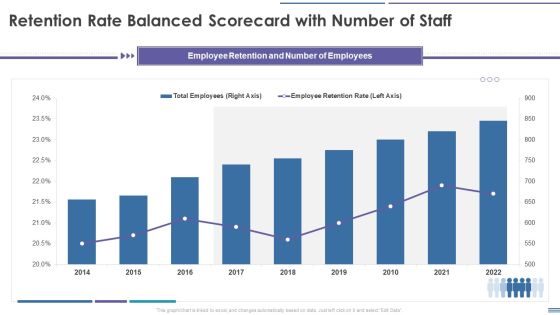
Staff Retention Balanced Scorecard Retention Rate Balanced Scorecard With Number Of Staff Diagrams PDF
This graph or chart is linked to excel, and changes automatically based on data. Just left click on it and select Edit Data. Deliver an awe inspiring pitch with this creative Staff Retention Balanced Scorecard Retention Rate Balanced Scorecard With Number Of Staff Diagrams PDF bundle. Topics like Total Employees, Employee Retention Rate, 2014 To 2022 can be discussed with this completely editable template. It is available for immediate download depending on the needs and requirements of the user.

Hr Accomplishment Framework Template Powerpoint Slide Themes
This is a hr accomplishment framework template powerpoint slide themes. This is a six stage process. The stages in this process are meet with org leadership, assimilate, analyze data, implement, collaborate and discuss, discover.

Comprehensive Guide For Launch Sales By Lead Source Performance Indicator Inspiration PDF
This graph or chart is linked to excel, and changes automatically based on data. Just left click on it and select Edit Data. The Comprehensive Guide For Launch Sales By Lead Source Performance Indicator Inspiration PDF is a compilation of the most recent design trends as a series of slides. It is suitable for any subject or industry presentation, containing attractive visuals and photo spots for businesses to clearly express their messages. This template contains a variety of slides for the user to input data, such as structures to contrast two elements, bullet points, and slides for written information. Slidegeeks is prepared to create an impression.

Business Diagram Five Staged Business Points Display Text Box Diagram Presentation Template
This Power Point template slide has been designed with graphic of five staged text box diagrams. This PPT slide can be used for displaying business data. Use this PPT slide for your business presentations and get good remarks.

Chart Showing Food Branding Platforms Ppt Summary Gridlines PDF
This graph or chart is linked to excel, and changes automatically based on data. Just left click on it and select Edit Data. Showcasing this set of slides titled chart showing food branding platforms ppt summary gridlines pdf. The topics addressed in these templates are chart showing food branding platforms. All the content presented in this PPT design is completely editable. Download it and make adjustments in color, background, font etc. as per your unique business setting.

Hiring Agency Profile With Financial Charts Ppt Model Example PDF
This graph or chart is linked to excel, and changes automatically based on data. Just left click on it and select edit data. Pitch your topic with ease and precision using this hiring agency profile with financial charts ppt model example pdf. This layout presents information on revenue, operating income, operating margin, satisfaction rate. It is also available for immediate download and adjustment. So, changes can be made in the color, design, graphics or any other component to create a unique layout.

Web Mapping Diagram Powerpoint Templates
This is a web mapping diagram powerpoint templates. This is a six stage process. The stages in this process are spatial data, prepare response, user request, information, geography, web mapping.
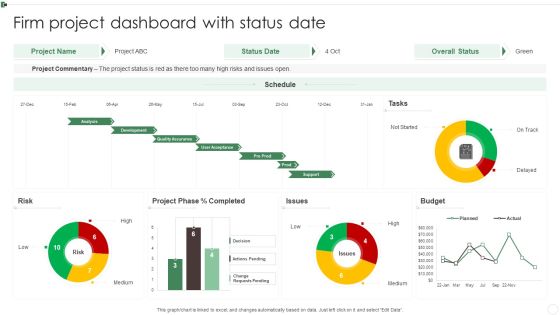
Firm Project Dashboard With Status Date Ppt Infographics Slides PDF
This graph or chart is linked to excel, and changes automatically based on data. Just left click on it and select Edit Data. Pitch your topic with ease and precision using this Firm Project Dashboard With Status Date Ppt Infographics Slides PDF. This layout presents information on Project Commentary, Budget, Project Phase, Risk. It is also available for immediate download and adjustment. So, changes can be made in the color, design, graphics or any other component to create a unique layout.

Professional Services Support Diagram Presentation Visual Aids
This is a professional services support diagram presentation visual aids. This is a five stage process. The stages in this process are statistical models, gather data, enrollment, capacity, boundaries.
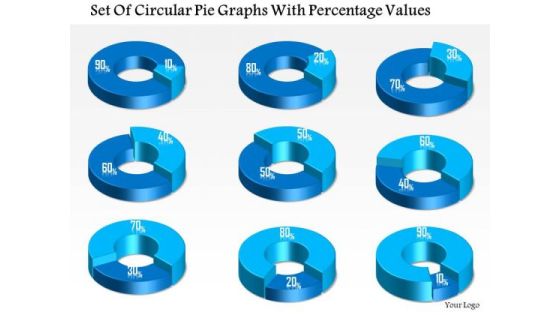
Business Diagram Set Of Circular Pie Graphs With Percentage Values Presentation Template
This business diagram displays set of pie charts. This Power Point template has been designed to compare and present business data. Download this diagram to represent stages of business growth.
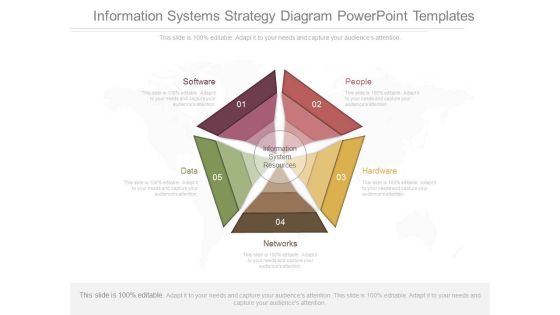
Information Systems Strategy Diagram Powerpoint Templates
This is a information systems strategy diagram powerpoint templates. This is a five stage process. The stages in this process are software, people, hardware, data, networks, information system resources.

Website Traffic Analysis Diagram Presentation Layouts
This is a website traffic analysis diagram presentation layouts. This is a four stage process. The stages in this process are keywords used, design analysis, define goals, collect data, web analysis process.
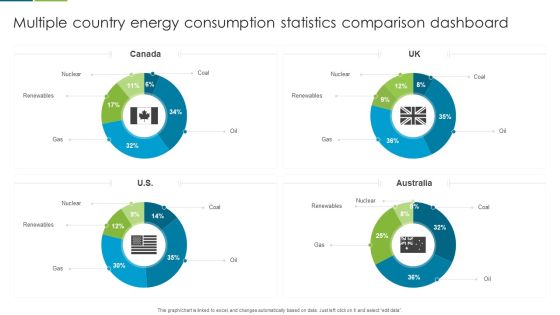
Multiple Country Energy Consumption Statistics Comparison Dashboard Formats PDF
This graph or chart is linked to excel, and changes automatically based on data. Just left click on it and select edit data. Pitch your topic with ease and precision using this Multiple Country Energy Consumption Statistics Comparison Dashboard Formats PDF. This layout presents information on Nuclear, Renewables, Gas. It is also available for immediate download and adjustment. So, changes can be made in the color, design, graphics or any other component to create a unique layout.

Local Level Intelligence Diagram Powerpoint Slide Download
This is a local level intelligence diagram powerpoint slide download. This is a six stage process. The stages in this process are technology variables, site specific, data, local level intelligence, technology infrastructure, product service category, competitive landscape study.
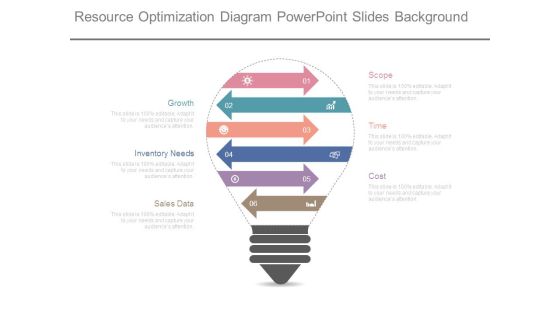
Resource Optimization Diagram Powerpoint Slides Background
This is a resource optimization diagram powerpoint slides background. This is a six stage process. The stages in this process are scope, time, cost, growth, inventory needs, sales data.
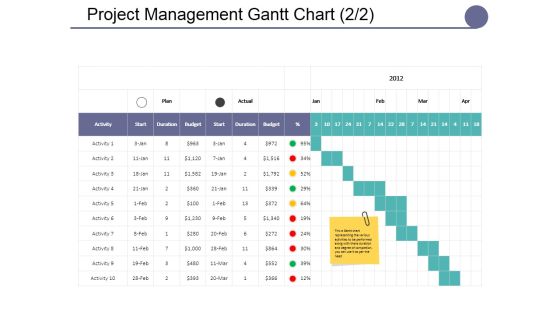
Project Management Gantt Chart Template Ppt PowerPoint Presentation Summary Master Slide
This is a project management gantt chart template ppt powerpoint presentation summary master slide. This is a seven stage process. The stages in this process are lists, table, data, management, marketing.

Cyber Security Response Sample Diagram Powerpoint Images
This is a cyber security response sample diagram powerpoint images. This is a eight stage process. The stages in this process are preparation, containment and remediation, malware analysis, campaigns, cyber security, log and event data, advertise, tools and tactics.
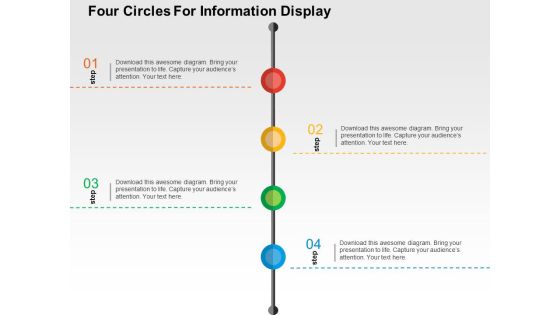
Four Circles For Information Display Powerpoint Templates
This PowerPoint slide contains graphics of four circles. This professional slide may be used for visual explanation of data. Adjust the above diagram in your business presentations to give professional impact.
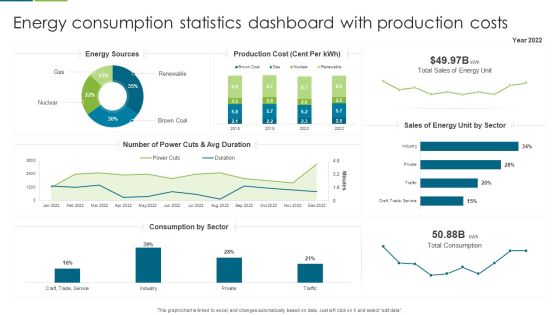
Energy Consumption Statistics Dashboard With Production Costs Slides PDF
This graph or chart is linked to excel, and changes automatically based on data. Just left click on it and select edit data. Showcasing this set of slides titled Energy Consumption Statistics Dashboard With Production Costs Slides PDF. The topics addressed in these templates are Production Cost, Sales Energy, Number Power. All the content presented in this PPT design is completely editable. Download it and make adjustments in color, background, font etc. as per your unique business setting.

Energy Consumption Statistics Dashboard With Yearly Savings Guidelines PDF
This graph or chart is linked to excel, and changes automatically based on data. Just left click on it and select edit data. Showcasing this set of slides titled Energy Consumption Statistics Dashboard With Yearly Savings Guidelines PDF. The topics addressed in these templates are Production Consumption, Energy Savings, Performance Ratio. All the content presented in this PPT design is completely editable. Download it and make adjustments in color, background, font etc. as per your unique business setting.

Business Administration Diagram Ppt Background Template
This is a business administration diagram ppt background template. This is a eight stage process. The stages in this process are business, consumer, knowledge, data, wisdom, information, administration, increased complexity.
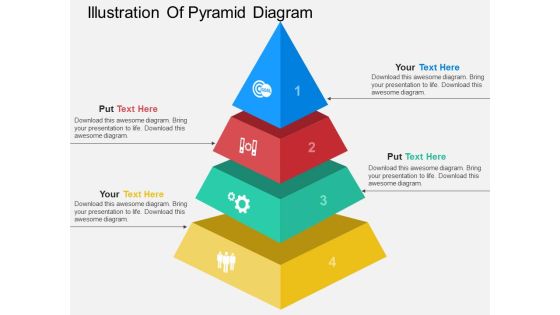
Illustration Of Pyramid Diagram Powerpoint Template
This PowerPoint slide contains illustration of pyramid diagram. This professional slide may be used for visual explanation of data. Adjust the above diagram in your business presentations to give professional impact.
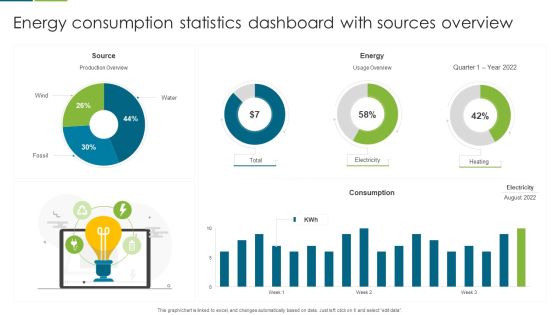
Energy Consumption Statistics Dashboard With Sources Overview Template PDF
This graph or chart is linked to excel, and changes automatically based on data. Just left click on it and select edit data. Pitch your topic with ease and precision using this Energy Consumption Statistics Dashboard With Sources Overview Template PDF. This layout presents information on Source, Energy, Consumption. It is also available for immediate download and adjustment. So, changes can be made in the color, design, graphics or any other component to create a unique layout.

Prevention Of Information Major Statistics Of Cyber Security Awareness Pictures PDF
This graph or chart is linked to excel, and changes automatically based on data. Just left click on it and select Edit Data. There are so many reasons you need a Prevention Of Information Major Statistics Of Cyber Security Awareness Pictures PDF. The first reason is you cant spend time making everything from scratch, Thus, Slidegeeks has made presentation templates for you too. You can easily download these templates from our website easily.
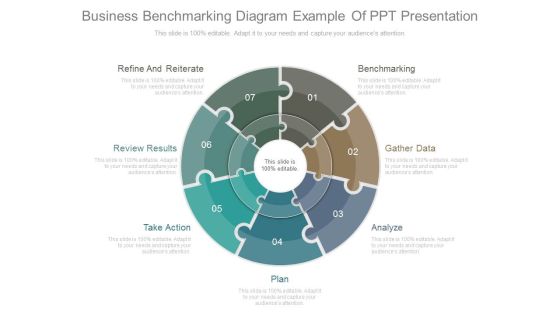
Business Benchmarking Diagram Example Of Ppt Presentation
This is a business benchmarking diagram example of ppt presentation. This is a seven stage process. The stages in this process are refine and reiterate, review results, take action, plan, analyze, gather data, benchmarking.
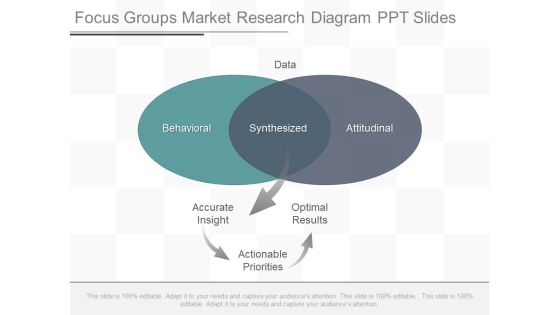
Focus Groups Market Research Diagram Ppt Slides
This is a focus groups market research diagram ppt slides. This is a two stage process. The stages in this process are data, behavioral, synthesized, attitudinal, accurate insight, optimal results, actionable priorities.
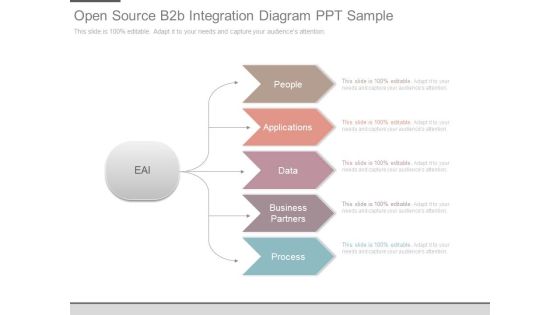
Open Source B2b Integration Diagram Ppt Sample
This is a open source b2b integration diagram ppt sample. This is a five stage process. The stages in this process are eai, people, applications, data, business partners, process.
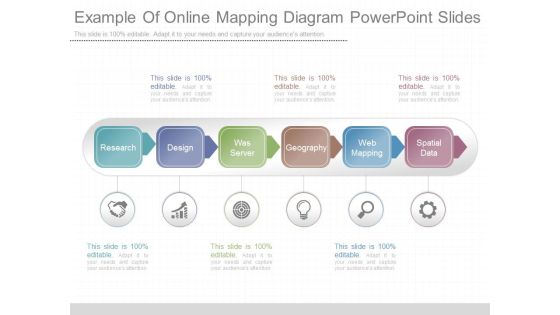
Example Of Online Mapping Diagram Powerpoint Slides
This is a example of online mapping diagram powerpoint slides. This is a six stage process. The stages in this process are research, design, was server, geography, web mapping, spatial data.
