Data Icon
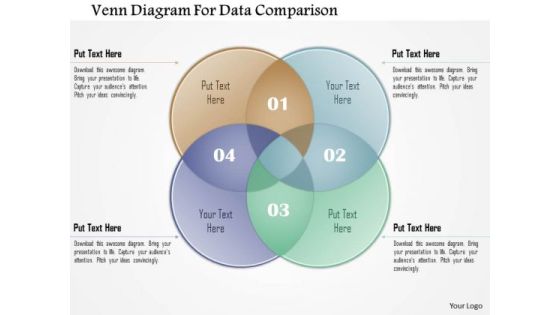
Business Diagram Venn Diagram For Data Comparison Presentation Template
Our above diagram displays venn diagrams that helps to display the interrelation of concepts by placing interrelated words in overlapping circles. This diagram helps you to communicate information visually.
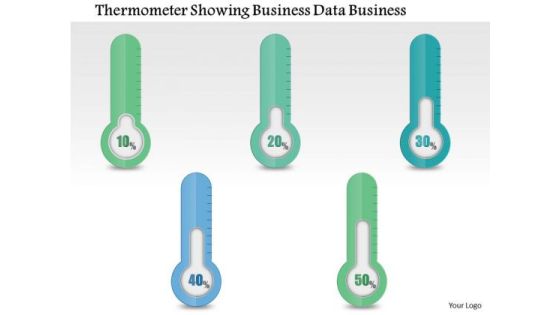
Consulting Slides Thermometer Showing Business Data Business Presentation
You can use this thermometer diagram to interpret business data. You can also use this professional diagram to model a timeline in PowerPoint. Illustrate specific project stages or development steps with the assistance of our integrated graphics.

Construction Data Symbol PowerPoint Themes And PowerPoint Slides 0211
Microsoft PowerPoint Theme and Slide with transparent three segment pie chart

Human Hand Tags For Business Data Verification PowerPoint Template
This Business diagram can be used to display data, business information etc. You can easily customize this PowerPoint template as per your need. Capture the attention of your audience.

Busines Diagram Light House Graphic For Data Representation Presentation Template
Use this diagram for visual communication. Present your opinions with our impressive diagram. This image contains light house graphics. This diagram slide makes your presentations more interactive.

Cloud Network Diagram With Percentage Data Powerpoint Slides
This PowerPoint template contains graphics of cloud network diagram with percentage values. You may download this PPT slide design to display cloud network and financial strategy. You can easily customize this template to make it more unique as per your need.
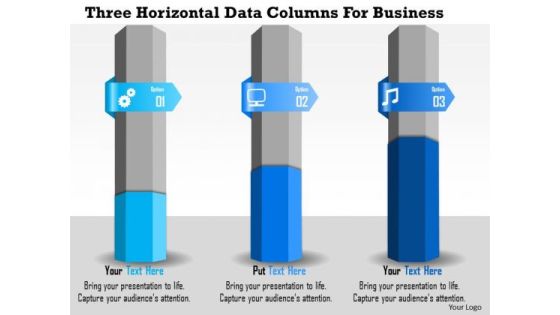
Business Diagram Three Horizontal Data Columns For Business Presentation Template
Three staged gear diagram has been used to craft this power point template. This PPT contains the concept of business process control. Use this PPT diagram for business and marketing related presentations.

Two Table Charts For Business Data Powerpoint Slides
This PowerPoint template contains two tables chart. You may download this PPT slide to display statistical analysis. You can easily customize this template to make it more unique as per your need.
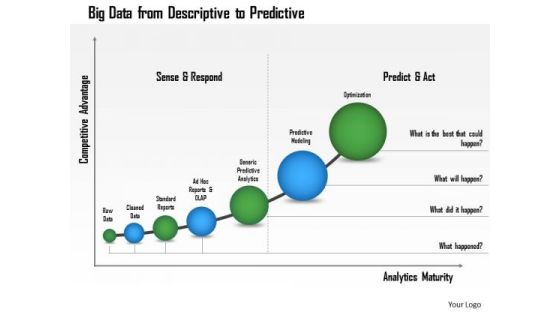
Business Framework Big Data From Descriptive To Predictive PowerPoint Presentation
Two funnel diagrams with text boxes are used to design this Power point template slide. This PPT slide contains the concept of AIDA marketing. Use this PPT for marketing and business presentations.
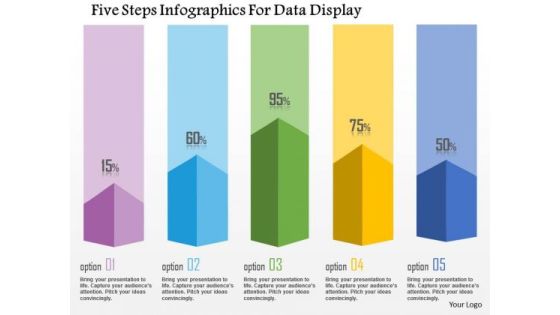
Business Diagram Five Steps Infographics For Data Display Presentation Template
This business diagram has been designed with graphic of five staged info graphics. This diagram can be used to display statistical information. Use this bar graph for your business and sales related presentations.

Data Network Lines Computer PowerPoint Themes And PowerPoint Slides 0211
Microsoft PowerPoint Theme and Slide with computer sitting in tangled mess of chrome/reflective cables

Global Data Communication PowerPoint Themes And PowerPoint Slides 0511
Microsoft PowerPoint Theme and Slide with glossy earth floating over a 2D world map

Business Diagram Four Staged Computer Tags Data Representation Presentation Template
This diagram has been designed with four staged computer tags. You can insert this diagram into your presentations to clarify information. Highlight your ideas broad based on strong fundamentals and illustrate how they step by step achieve the set growth factor.

Business Diagram Four Colorful Cutters For Data Representation Presentation Template
This diagram is designed with four colorful cutters style text boxes. Download this diagram to analyze the key points. This diagram offers a way for your audience to visually conceptualize the process.
Business Diagram Three Cups For Market Research Data Presentation Template
This business diagram has been designed with graphic of three cups. This diagram can be used to display information in visual manner. Use this diagram in your presentations to get good remarks from your viewers.

Business Diagram Seven Staged Reverse Pyramid For Data Presentation Template
This business slide is designed with seven staged pyramid diagram. Download this professional slide to depict sales and marketing analysis. This image slide is best to present your newer thoughts.
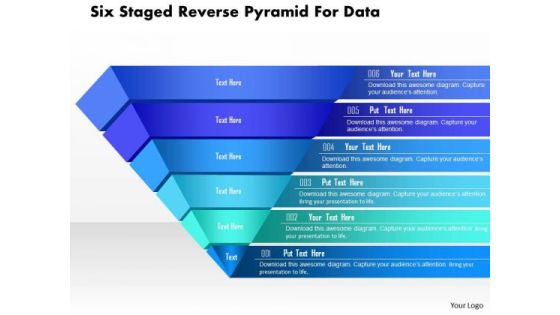
Business Diagram Six Staged Reverse Pyramid For Data Presentation Template
This business slide is designed with six staged pyramid diagram. Download this professional slide to depict sales and marketing analysis. This image slide is best to present your newer thoughts.
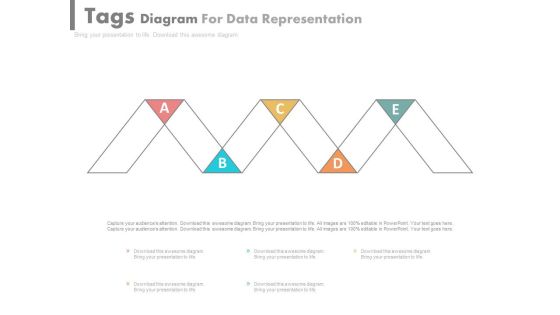
Five Steps Diagram For Data Display Powerpoint Template
Our above PPT slide contains diagram of five alphabetic steps. This diagram provides schematic representation of any information. Visual effect this slide helps in maintaining the flow of the discussion and provides more clarity to the subject.

Business Diagram Four Colored Signposts For Data Representation Presentation Template
This business diagram displays for signposts. It contains signposts with four options. This road sign diagram is best to represent four business options. Download this awesome diagram to pitch your ideas convincingly.
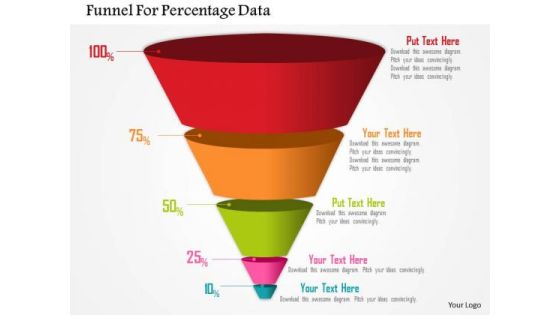
Business Diagram Funnel For Percentage Data Presentation Template
Four staged funnel diagram has been used to design this power point template. This diagram contains the concept of filtration. Present your views and ideas with this impressive image.

Triangular Text Boxes For Data Representation PowerPoint Template
Our above slide display graphics of triangular text boxes. Download this diagram slide to display text. Adjust the above diagram in your business presentations to visually support your content.

Construction Data Symbol PowerPoint Templates And PowerPoint Backgrounds 0211
Microsoft PowerPoint Template and Background with transparent three segment pie chart

E Book Data Business PowerPoint Templates And PowerPoint Backgrounds 0311
Microsoft PowerPoint Template and Background with a multi colored bar chart sitting on top of a silver digital book reader

Analyzing The Data Business PowerPoint Presentation Slides C
Microsoft PowerPoint Slides and Backgrounds with a magnifying glass hovering over a three dimensional multi colored bar chart
Analyzing The Data Business PowerPoint Presentation Slides Cc
Microsoft PowerPoint Slides and Backgrounds with a magnifying glass hovering over a three dimensional multi colored bar chart
Analyzing The Data Business PowerPoint Presentation Slides F
Microsoft PowerPoint Slides and Backgrounds with a magnifying glass hovering over a three dimensional multi colored bar chart
Analyzing The Data Business PowerPoint Presentation Slides R
Microsoft PowerPoint Slides and Backgrounds with a magnifying glass hovering over a three dimensional multi colored bar chart

Analyzing The Data Business PowerPoint Presentation Slides S
Microsoft PowerPoint Slides and Backgrounds with a magnifying glass hovering over a three dimensional multi colored bar chart

Online Stock Data Internet PowerPoint Templates And PowerPoint Backgrounds 0311
Microsoft PowerPoint Template and Background with a large magnifying glass top of touch screen computer with green stock chart show profit
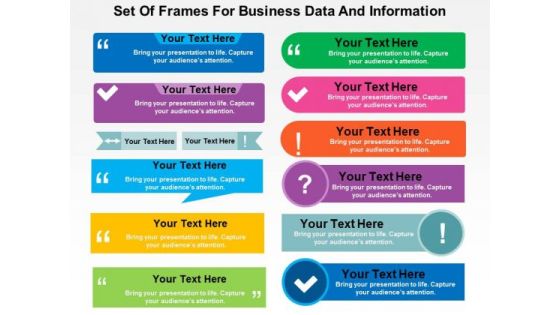
Set Of Frames For Business Data And Information PowerPoint Template
This business diagram can be used to make presentations to your team, customers and managers. You can easily customize this diagram as per your need. Capture the attention of your audience.
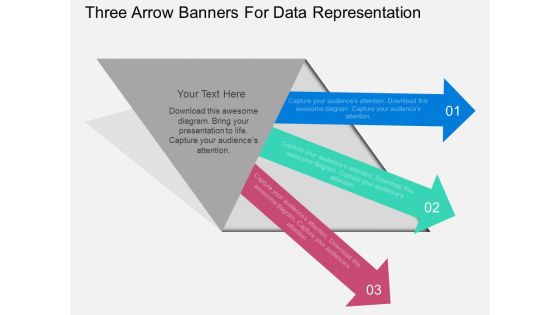
Three Arrow Banners For Data Representation Powerpoint Template
This business diagram contains graphics three arrow banners. Our professionally designed business diagram helps to portray business concepts in visual manner. Enlighten your audience with your breathtaking ideas.

Bar Graph Of Lego Blocks For Data Analysis Powerpoint Slides
This PowerPoint template contains bar graph made of Lego blocks. You may use this slide to display growth process. This diagram provides an effective way of displaying information you can edit text, color, shade and style as per you need.
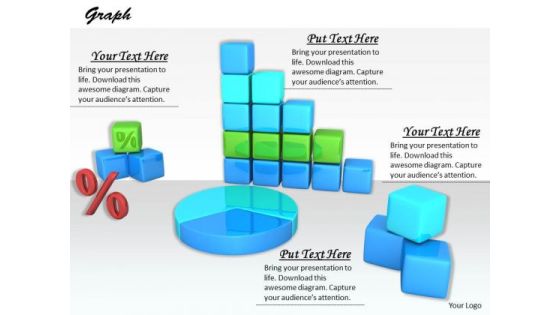
Stock Photo Design For Graphical Representations Of Data PowerPoint Slide
The above image contains a graphic of charts and graphs. Use this professional image in business or sales related presentations. It helps you to explain your plans in all earnest to your colleagues and raise the bar for all.

Finland Map With Economic Data Analysis Powerpoint Slides
This PowerPoint template has been designed with Finland Map and areas highlighted. You may use this slide to display financial strategy analysis. This diagram provides an effective way of displaying information you can edit text, color, shade and style as per you need.

Four Infographics Banners For Data Display Powerpoint Template
Our above business slide contains diagram of four infographic banners. This PowerPoint slide may be used to exhibit business planning steps. Capture the attention of your audience with this slide.
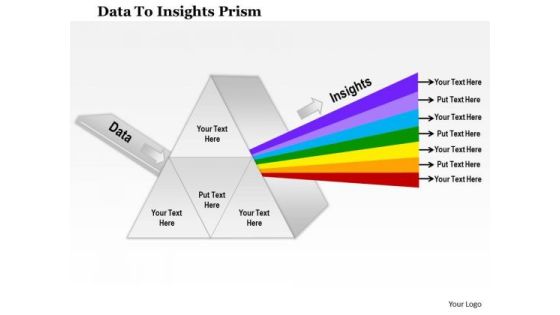
Business Framework Data To Insights Prism PowerPoint Presentation
Four staged cyclic text box diagram has been used to decorate this PPT slide. This PPT slide contain the concept of placement style strategy map which can be used to display various strategies. Use this PPT slide for business strategy related presentations.

Data Processing Services Delivery How AI And Machine Learning Can Revolutionize Sales Icons PDF
This template covers the benefits of AI for the Sales and Marketing team. AI and Machine Learning benefits in the area of lead quality, engagement, and better understanding of buyer intent. Deliver and pitch your topic in the best possible manner with this Data Processing Services Delivery How AI And Machine Learning Can Revolutionize Sales Icons PDF. Use them to share invaluable insights on Social Media Posts, Terms Favorability, Brand, Product and impress your audience. This template can be altered and modified as per your expectations. So, grab it now.
Using Data Science Technologies For Business Transformation Tasks And Skills Of Machine Learning Engineer Icons PDF
This slide represents the machine learning engineers tasks and skills, including a deep knowledge of machine learning, ML algorithms, and Python and C. Coming up with a presentation necessitates that the majority of the effort goes into the content and the message you intend to convey. The visuals of a PowerPoint presentation can only be effective if it supplements and supports the story that is being told. Keeping this in mind our experts created Using Data Science Technologies For Business Transformation Tasks And Skills Of Machine Learning Engineer Icons PDF to reduce the time that goes into designing the presentation. This way, you can concentrate on the message while our designers take care of providing you with the right template for the situation.

Data Analysis Reports Under Magnifying Glass Ppt Powerpoint Presentation Summary Slideshow
This is a data analysis reports under magnifying glass ppt powerpoint presentation summary slideshow. This is a three stage process. The stages in this process are data visualization icon, data management icon.

Pie Chart For Data Presentation Vector Ppt Powerpoint Presentation Summary Display
This is a pie chart for data presentation vector ppt powerpoint presentation summary display. This is a three stage process. The stages in this process are data visualization icon, data management icon.
Personal Data Visualization On Computer Screen Ppt Powerpoint Presentation Infographics Vector
This is a personal data visualization on computer screen ppt powerpoint presentation infographics vector. This is a three stage process. The stages in this process are data visualization icon, data management icon.

Data Interpretation And Analysis Playbook How To Overcome Analytics From All The Data At Scale Challenges Designs PDF
This template illustrates that the high-performance computation engine of the analytics software company, the data platform connects to various data sources, automates the data preparation workflow, and scales to big data scenarios. This is a data interpretation and analysis playbook how to overcome analytics from all the data at scale challenges designs pdf template with various stages. Focus and dispense information on three stages using this creative set, that comes with editable features. It contains large content boxes to add your information on topics like marketing, analysis, capabilities, service, databases, sources. You can also showcase facts, figures, and other relevant content using this PPT layout. Grab it now.

Using Data Science Technologies For Business Transformation Exploratory Data Analysis Eda In Model Planning Phase Template PDF
This slide depicts the exploratory data analysis in the model planning phase of data science and its various stages and reasons behind using it. Do you have an important presentation coming up Are you looking for something that will make your presentation stand out from the rest Look no further than Using Data Science Technologies For Business Transformation Exploratory Data Analysis Eda In Model Planning Phase Template PDF. With our professional designs, you can trust that your presentation will pop and make delivering it a smooth process. And with Slidegeeks, you can trust that your presentation will be unique and memorable. So why wait Grab Using Data Science Technologies For Business Transformation Exploratory Data Analysis Eda In Model Planning Phase Template PDF today and make your presentation stand out from the rest.

Cost Saving Benefits Of Implementing Data Center Data Center Relocation Process Step 6 Development Phase Infographics PDF
This slide shows the sixth step that is involved in data center relocation process which is to be implemented for minimizing data center costs and improving scalability i.e. development phase. Crafting an eye catching presentation has never been more straightforward. Let your presentation shine with this tasteful yet straightforward Cost Saving Benefits Of Implementing Data Center Data Center Relocation Process Step 6 Development Phase Infographics PDF template. It offers a minimalistic and classy look that is great for making a statement. The colors have been employed intelligently to add a bit of playfulness while still remaining professional. Construct the ideal Cost Saving Benefits Of Implementing Data Center Data Center Relocation Process Step 6 Development Phase Infographics PDF that effortlessly grabs the attention of your audience Begin now and be certain to wow your customers.

Cost Saving Benefits Of Implementing Data Center Data Center Relocation Process Step 8 Relocation Phase Background PDF
This slide shows the eighth step that is involved in data center relocation process which is to be implemented for minimizing data center costs and improving scalability i.e. relocation phase. Do you have to make sure that everyone on your team knows about any specific topic I yes, then you should give Cost Saving Benefits Of Implementing Data Center Data Center Relocation Process Step 8 Relocation Phase Background PDF a try. Our experts have put a lot of knowledge and effort into creating this impeccable Cost Saving Benefits Of Implementing Data Center Data Center Relocation Process Step 8 Relocation Phase Background PDF. You can use this template for your upcoming presentations, as the slides are perfect to represent even the tiniest detail. You can download these templates from the Slidegeeks website and these are easy to edit. So grab these today.

Using Data Science Technologies For Business Transformation Why Is Data Science Needed In The Organization Themes PDF
This slide defines the need of the data science in the organization, the amount of the total data, structured data, and unstructured data, which is not possible to manage by BI tool anymore. Do you know about Slidesgeeks Using Data Science Technologies For Business Transformation Why Is Data Science Needed In The Organization Themes PDF These are perfect for delivering any kind od presentation. Using it, create PowerPoint presentations that communicate your ideas and engage audiences. Save time and effort by using our pre designed presentation templates that are perfect for a wide range of topic. Our vast selection of designs covers a range of styles, from creative to business, and are all highly customizable and easy to edit. Download as a PowerPoint template or use them as Google Slides themes.

Modern Security Observation Plan To Eradicate Cybersecurity Risk And Data Breach Ways Through Which Security Data Themes PDF
This slide provides information about some of the major ways through which security data can be compromised which could have a negative impact on security monitoring along with some measures to deal with them. Deliver an awe inspiring pitch with this creative modern security observation plan to eradicate cybersecurity risk and data breach ways through which security data themes pdf bundle. Topics like ways through which security data can be compromised and measures to deal with them can be discussed with this completely editable template. It is available for immediate download depending on the needs and requirements of the user.
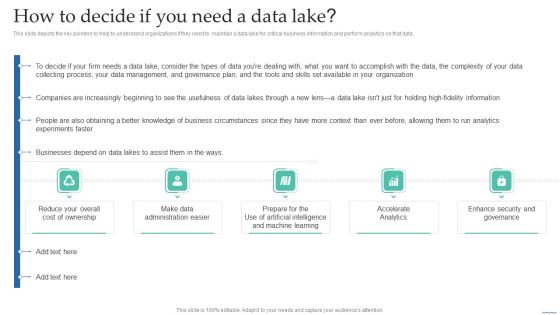
How To Decide If You Need A Data Lake Data Lake Creation With Hadoop Cluster Sample PDF
This slide depicts the key pointers to help to understand organizations if they need to maintain a data lake for critical business information and perform analytics on that data.If you are looking for a format to display your unique thoughts, then the professionally designed How To Decide If You Need A Data Lake Data Lake Creation With Hadoop Cluster Sample PDF is the one for you. You can use it as a Google Slides template or a PowerPoint template. Incorporate impressive visuals, symbols, images, and other charts. Modify or reorganize the text boxes as you desire. Experiment with shade schemes and font pairings. Alter, share or cooperate with other people on your work. Download How To Decide If You Need A Data Lake Data Lake Creation With Hadoop Cluster Sample PDF and find out how to give a successful presentation. Present a perfect display to your team and make your presentation unforgettable.
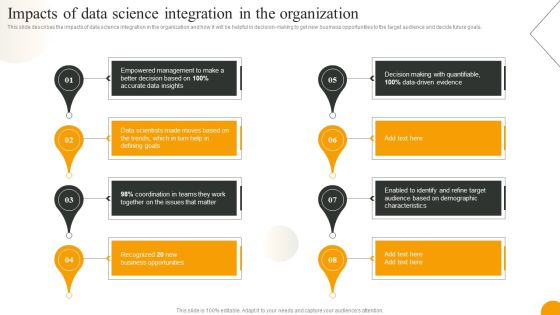
Using Data Science Technologies For Business Transformation Impacts Of Data Science Integration In The Organization Clipart PDF
This slide describes the impacts of data science integration in the organization and how it will be helpful in decision-making to get new business opportunities to the target audience and decide future goals. Whether you have daily or monthly meetings, a brilliant presentation is necessary. Using Data Science Technologies For Business Transformation Impacts Of Data Science Integration In The Organization Clipart PDF can be your best option for delivering a presentation. Represent everything in detail using Using Data Science Technologies For Business Transformation Impacts Of Data Science Integration In The Organization Clipart PDF and make yourself stand out in meetings. The template is versatile and follows a structure that will cater to your requirements. All the templates prepared by Slidegeeks are easy to download and edit. Our research experts have taken care of the corporate themes as well. So, give it a try and see the results.

Toolkit For Data Science And Analytics Transition RACI Matrix For Data Analyzing Project With Key Responsibilities Background PDF
The slide shows the roles and responsibilities of data analytics project by using responsible, accountable, consulted, and informed RACI Matrix. Whether you have daily or monthly meetings, a brilliant presentation is necessary. Toolkit For Data Science And Analytics Transition RACI Matrix For Data Analyzing Project With Key Responsibilities Background PDF can be your best option for delivering a presentation. Represent everything in detail using Toolkit For Data Science And Analytics Transition RACI Matrix For Data Analyzing Project With Key Responsibilities Background PDF and make yourself stand out in meetings. The template is versatile and follows a structure that will cater to your requirements. All the templates prepared by Slidegeeks are easy to download and edit. Our research experts have taken care of the corporate themes as well. So, give it a try and see the results.

Data Interpretation And Analysis Playbook How To Overcome Automated Data Analysis Powered By Ml Challenges Summary PDF
This template illustrates that automated discovery of insights utilizes machine learning algorithms to analyze billions of data points in seconds to perform complex segmentation, anomaly detection, and trend-based analysis without coding. Deliver and pitch your topic in the best possible manner with this data interpretation and analysis playbook how to overcome automated data analysis powered by ml challenges summary pdf. Use them to share invaluable insights on opportunity, service, analytics, industry and impress your audience. This template can be altered and modified as per your expectations. So, grab it now.

Data Monetization Approach To Drive Business Growth Assessing Role Of Data Monetising In Healthcare Sector Diagrams PDF
This slide provides details about analyzing the role of data monetizing in healthcare sector in context to benefits associated to it with the help of data optimize software. Do you know about Slidesgeeks Data Monetization Approach To Drive Business Growth Assessing Role Of Data Monetising In Healthcare Sector Diagrams PDF These are perfect for delivering any kind od presentation. Using it, create PowerPoint presentations that communicate your ideas and engage audiences. Save time and effort by using our pre designed presentation templates that are perfect for a wide range of topic. Our vast selection of designs covers a range of styles, from creative to business, and are all highly customizable and easy to edit. Download as a PowerPoint template or use them as Google Slides themes.
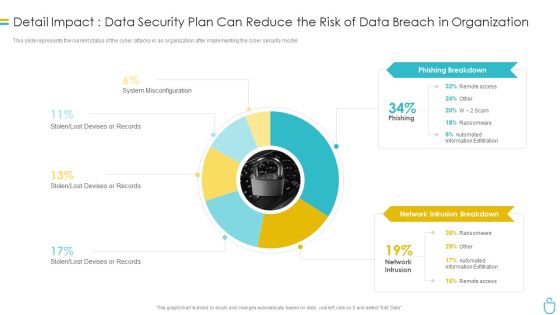
Information Security Detail Impact Data Security Plan Can Reduce The Risk Of Data Breach In Organization Ppt Slides Influencers PDF
This slide represents the current status of the cyber attacks in an organization after implementing the cyber security model. Deliver and pitch your topic in the best possible manner with this information security detail impact data security plan can reduce the risk of data breach in organization ppt slides influencers pdf. Use them to share invaluable insights on phishing breakdown, network intrusion breakdown and impress your audience. This template can be altered and modified as per your expectations. So, grab it now.
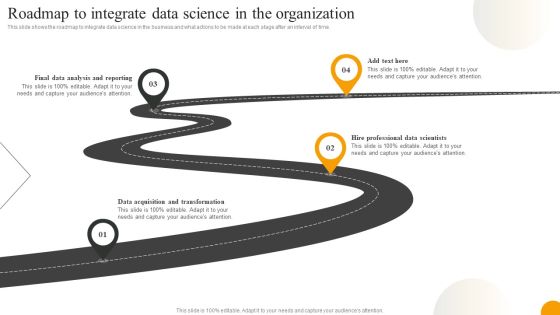
Using Data Science Technologies For Business Transformation Roadmap To Integrate Data Science In The Organization Topics PDF
This slide describes the operational phase of data science and what tasks are performed in this phase, such as deliver final reports, pilot project implementation, and how it will be helpful in monitoring performance. Slidegeeks is here to make your presentations a breeze with Using Data Science Technologies For Business Transformation Roadmap To Integrate Data Science In The Organization Topics PDF With our easy to use and customizable templates, you can focus on delivering your ideas rather than worrying about formatting. With a variety of designs to choose from, you are sure to find one that suits your needs. And with animations and unique photos, illustrations, and fonts, you can make your presentation pop. So whether you are giving a sales pitch or presenting to the board, make sure to check out Slidegeeks first.

Circular Diagram To Show Phases Of Big Data Analysis Ppt PowerPoint Presentation Infographic Template
This is a circular diagram to show phases of big data analysis ppt powerpoint presentation infographic template. This is a five stage process. The stages in this process are big data, icons, management, strategy, business.
Statistical Data Chart On Screen Monitor Ppt PowerPoint Presentation Outline Summary
Presenting this set of slides with name statistical data chart on screen monitor ppt powerpoint presentation outline summary. This is a one stage process. The stages in this process are data icon, status icon, status symbol icon. This is a completely editable PowerPoint presentation and is available for immediate download. Download now and impress your audience.
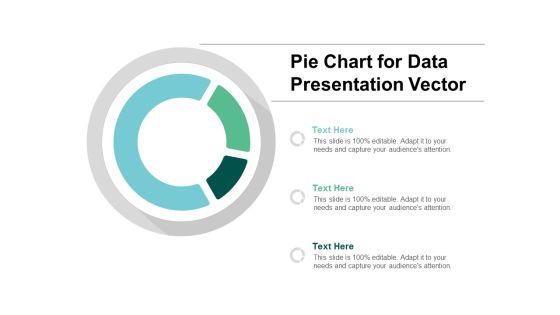
Pie Chart For Data Presentation Vector Ppt PowerPoint Presentation Summary Files
Presenting this set of slides with name pie chart for data presentation vector ppt powerpoint presentation summary files. The topics discussed in these slides are data visualization icon, research analysis, business focus. This is a completely editable PowerPoint presentation and is available for immediate download. Download now and impress your audience.

Personal Data Visualization On Computer Screen Ppt PowerPoint Presentation Show Layout Ideas
Presenting this set of slides with name personal data visualization on computer screen ppt powerpoint presentation show layout ideas. This is a one stage process. The stages in this process are data visualization icon, research analysis, business focus. This is a completely editable PowerPoint presentation and is available for immediate download. Download now and impress your audience.

Threat Assessment Icon With Magnifying Glass Ppt Icon Topics PDF
Presenting Threat Assessment Icon With Magnifying Glass Ppt Icon Topics PDF to dispense important information. This template comprises three stages. It also presents valuable insights into the topics including Threat Assessment Icon, Magnifying Glass. This is a completely customizable PowerPoint theme that can be put to use immediately. So, download it and address the topic impactfully.

Future Of Big Data Analytics Arrow Diagram Ppt PowerPoint Presentation Summary
This is a future of big data analytics arrow diagram ppt powerpoint presentation summary. This is a four stage process. The stages in this process are big data, process, business, marketing, icons.

 Home
Home