AI PPT Maker
Templates
PPT Bundles
Design Services
Business PPTs
Business Plan
Management
Strategy
Introduction PPT
Roadmap
Self Introduction
Timelines
Process
Marketing
Agenda
Technology
Medical
Startup Business Plan
Cyber Security
Dashboards
SWOT
Proposals
Education
Pitch Deck
Digital Marketing
KPIs
Project Management
Product Management
Artificial Intelligence
Target Market
Communication
Supply Chain
Google Slides
Research Services
 One Pagers
All Categories
-
Home
- Customer Favorites
- Data Icon
Data Icon

Three Strategies To Speed Up Integrating Iiot To Improve Operational Efficiency Brochure PDF
This slide cover phases to enhance industrial IOT developments. It includes steps such as easy and fast data acquisitions, data connectivity and efficient data logging applications. Presenting Three Strategies To Speed Up Integrating Iiot To Improve Operational Efficiency Brochure PDF to dispense important information. This template comprises three stages. It also presents valuable insights into the topics including Easy And Fast Data Acquisition, Easy And Secure Data Connectivity, Efficient Data Logging. This is a completely customizable PowerPoint theme that can be put to use immediately. So, download it and address the topic impactfully.
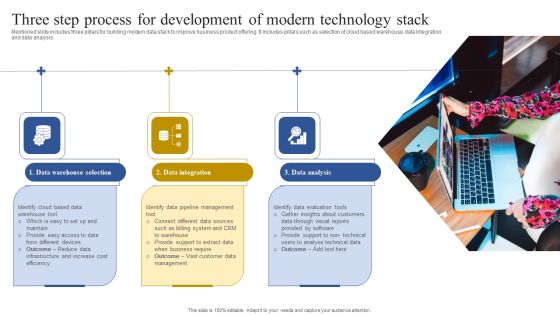
Three Step Process For Development Of Modern Technology Stack Structure PDF
Mentioned slide includes three pillars for building modern data stack to improve business product offering. It includes pillars such as selection of cloud based warehouse, data integration and data analysis. Presenting Three Step Process For Development Of Modern Technology Stack Structure PDF to dispense important information. This template comprises three stages. It also presents valuable insights into the topics including Data Warehouse Selection, Data Integration, Data Analysis. This is a completely customizable PowerPoint theme that can be put to use immediately. So, download it and address the topic impactfully.

Key Capabilities Of Customer Information Software Guidelines PDF
Following slide depicts customer data platform capabilities that can be used by organization to provide personalized experience to customers. Data integration, identity management, online event tracking, data aggregation, real-time data and reporting analytics are the capabilities mentioned in this slide. Presenting Key Capabilities Of Customer Information Software Guidelines PDF to dispense important information. This template comprises six stages. It also presents valuable insights into the topics including Data Integration, Identity Management, Data Aggregation. This is a completely customizable PowerPoint theme that can be put to use immediately. So, download it and address the topic impactfully.

Techniques To Overcome Issues In Cloud Service Xaas Implementation Guidelines PDF
Following slide presents major techniques to overcome complexities faced by businesses while implementing everything as a service model. Major issues relate to complex data sequencing, lack of precise data, handling a diverse set of data, etc. Presenting Techniques To Overcome Issues In Cloud Service Xaas Implementation Guidelines PDF to dispense important information. This template comprises four stages. It also presents valuable insights into the topics including Complex Data Sequencing, Lack Precise Data, Handling Diverse Set Data. This is a completely customizable PowerPoint theme that can be put to use immediately. So, download it and address the topic impactfully.

Business Diagram Responsive Design Over Several Hand Held Devices Ppt Slide
This image slide has been designed with graphic of phone and cloud icons. These icons are used to display the concept of networking and data storage. Use this slide to present network and technology related topics in any presentations.
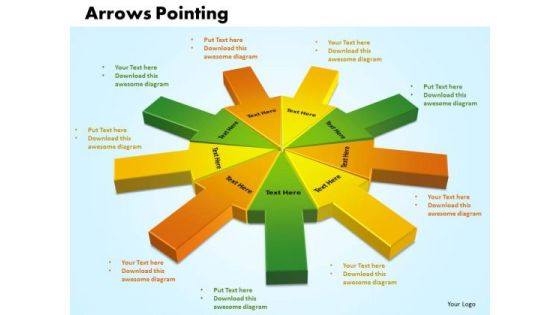
Business Success Business PowerPoint Templates Business Arrows Pointing Inwards Chart Ppt Slides
Business Success Business PowerPoint Templates Business arrows pointing inwards chart PPT Slides-Use this arrow pointing inward chart to determine your targets and sequence them as per your priorities. Unravel each one for your audience while setting key timelines as you go along. -Business Success Business PowerPoint Templates Business arrows pointing inwards chart PPT Slides-This ppt can be used for concepts relating to-3d, Accounting, Arrow, Blue, Button, Chart, Corporate, Data, Design, Diagram , Graphic, , Icon, Illustration etc.
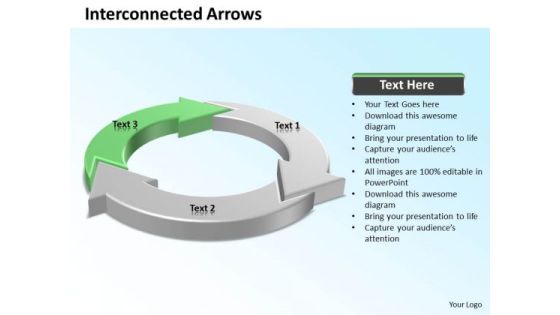
Ppt Go Green PowerPoint Presentation Arrow Pointing Inwards Circle Templates
PPT go green powerpoint presentation arrow Pointing inwards circle Templates-This 3D Circular Diagram in highlighted Green color can be helpful on explaining one different approach which is connected to other arrows for business process.-Can be used for presentations on arrow, business, clip-art, communication, computer, concept, connect, connection, data, design, earth, electronics, elements, global, icons, illustration, interconnect, internet, isolated, network, node, pc, satellite, sphere, symbol, system, technology, telephone, world, worldwide-PPT go green powerpoint presentation arrow Pointing inwards circle Templates
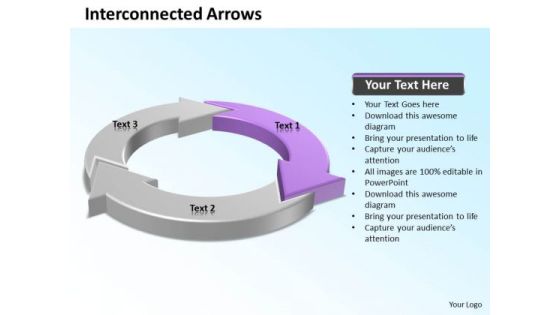
Ppt Pink Arrow Pointing Inwards Parts Of Circle PowerPoint For Kids Templates
PPT pink arrow Pointing inwards parts of circle powerpoint for kids Templates-This 3D Circular Diagram in highlighted Pink color can be helpful on explaining one different approach which is connected to other arrows for business process.-Can be used for presentations on arrow, business, clip-art, communication, computer, concept, connect, connection, data, design, earth, electronics, elements, global, icons, illustration, interconnect, internet, isolated, network, node, pc, satellite, sphere, symbol, system, technology, telephone, world, worldwide-PPT pink arrow Pointing inwards parts of circle powerpoint for kids Templates
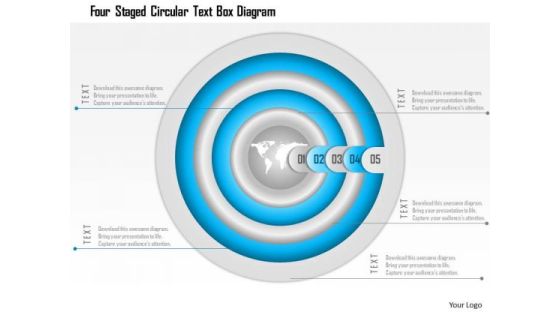
Business Diagram Four Staged Circular Text Box Diagram Presentation Template
This Power point template has been crafted with graphic of four staged circular text boxes. These text boxes can be used for data representation. Use this PPT slide for business data related presentation.

Business Diagram Eight Arrows Steps With Globe Presentation Template
Graphic of five staged film roll diagram has been used to craft this power point template diagram. This PPT contains the concept of data representation. Use this PPT for business and marketing data related presentations.

Money Growth Chart On Laptop With Mouse Powerpoint Template
This business slide displays money growth chart on laptop with mouse. This diagram is a data visualization tool that gives you a simple way to present statistical information. This slide helps your audience examine and interpret the data you present.

Business Diagram Film Roll Diagram With Three Steps Presentation Template
This power point template has been crafted with graphic of three film roll graphics. This PPT contains the concept of data flow. Use this PPT for your data related presentations.
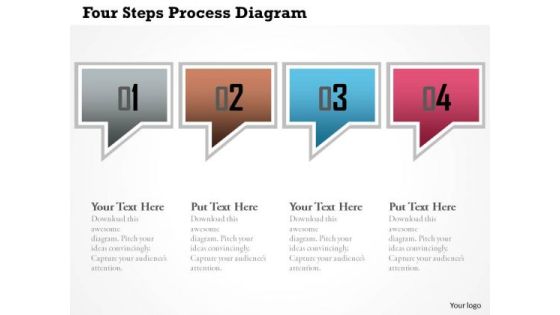
Business Diagram Four Steps Process Diagram Presentation Template
This power point template has been crafted with graphic of dialogue box. This PPT contains the concept of process and data flow. Use this PPT for your business and data related presentations.
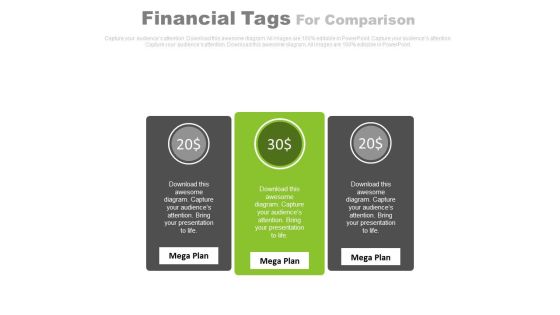
Three Text Tags Compare Chart Powerpoint Slides
This PowerPoint template has been designed with text tags and percentage data. You may download this PPT slide to display data comparison and analysis. Add this slide to your presentation and impress your superiors.
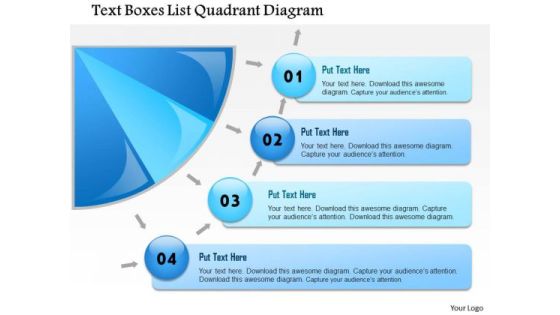
Business Framework Text Boxes List Quadrant Diagram PowerPoint Presentation
A semi circle diagram with text boxes are used to design this power point template slide. This PPT slide contains the concept of displaying business data. This PPT slide may be used for business data representations.
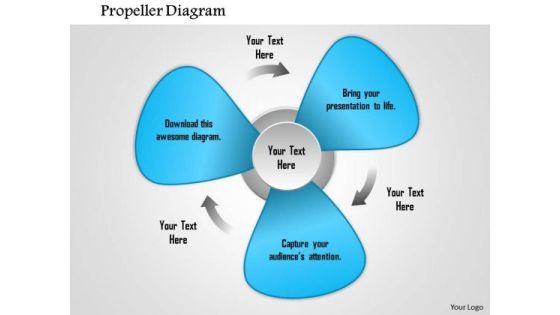
Business Framework Propeller Diagram For PowerPoint Presentation
A three staged text box diagram has been used to decorate this Power point template slide. This slide contains the propeller graphic diagram and display data. Use this PPT for data representation related topics.
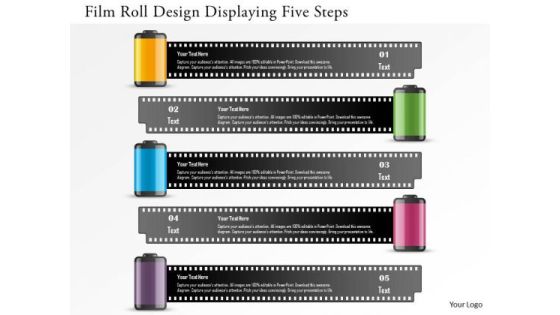
Business Diagram Film Roll Design Displaying Five Steps Presentation Template
Graphic of five staged film roll diagram has been used to craft this power point template diagram. This PPT contains the concept of data representation. Use this PPT for business and marketing data related presentations.
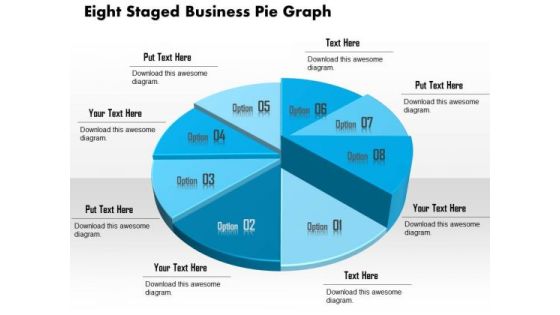
Business Diagram Eight Staged Business Pie Graph Presentation Template
This business slide displays eight staged pie chart. This diagram is a data visualization tool that gives you a simple way to present statistical information. This slide helps your audience examine and interpret the data you present.

Business Diagram Six Staged Vertical Text Box Diagram Presentation Template
Six staged vertical text box diagram has been used to design this Power Point template slide. This PPT slide contains the concept of business data representation. Use this PPT slide for business data related presentations.
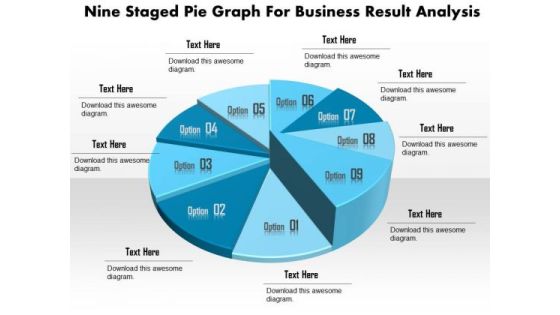
Business Diagram Nine Staged Pie Graph For Business Result Analysis Presentation Template
This business slide displays nine staged pie chart. This diagram is a data visualization tool that gives you a simple way to present statistical information. This slide helps your audience examine and interpret the data you present.

Business Diagram Seven Staged Pie Graph For Business Analysis Presentation Template
This business slide displays seven staged pie chart. This diagram is a data visualization tool that gives you a simple way to present statistical information. This slide helps your audience examine and interpret the data you present.

Business Diagram Six Staged 3d Pie Graph For Result Analysis Presentation Template
This business slide displays six staged pie chart. This diagram is a data visualization tool that gives you a simple way to present statistical information. This slide helps your audience examine and interpret the data you present.
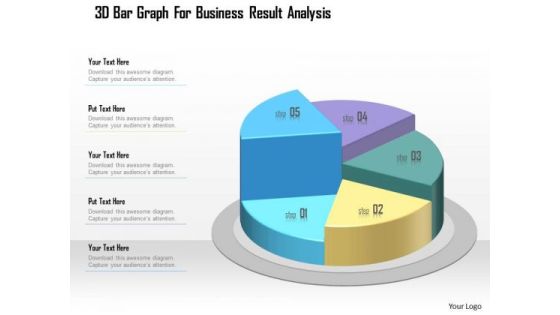
Business Diagram 3d Bar Graph For Business Result Analysis Presentation Template
This business slide displays five staged pie chart. This diagram is a data visualization tool that gives you a simple way to present statistical information. This slide helps your audience examine and interpret the data you present.
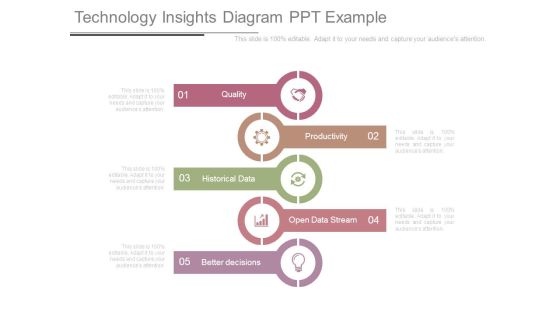
Technology Insights Diagram Ppt Example
This is a technology insights diagram ppt example. This is a five stage process. The stages in this process are quality, productivity, historical data, open data stream, better decisions.

Business Diagram Three Steps Process Diagram Presentation Template
Graphic of three colored pillars has been used to design this power point template diagram. This PPT contains the concept of text and data representation. Use this PPT diagram for your business data related topics.

Business Diagram Building Diagram With Three Steps Presentation Template
Three staged house graphic has been used to craft this power point template. This PPT diagram contains the concept of data representation. Use this PPT for your data and business related presentations.
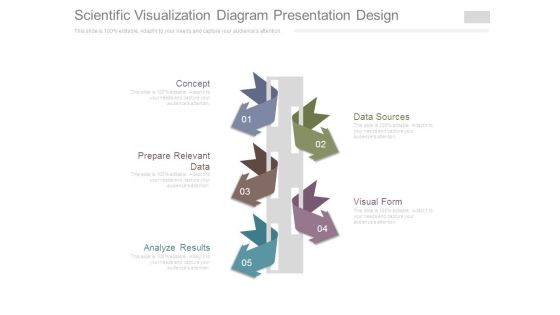
Scientific Visualization Diagram Presentation Design
This is a scientific visualization diagram presentation design. This is a five stage process. The stages in this process are concept, prepare relevant data, analyze results, data sources, visual form.

Business Diagram Timeline Diagram With Six Options Presentation Template
Graphic of designer circles has been used to design this power point template. This PPT contains the concept of data representation. Use this PPT for your business and data related presentation.

Cost Reduction Analysis Bar Chart Ppt Powerpoint Presentation File Graphics Design
This is a cost reduction analysis bar chart ppt powerpoint presentation file graphics design. This is a five stage process. The stages in this process are data analysis, data science, information science.

Business Diagram Three Interconnected Circles With Text Boxes Presentation Template
Three interconnected circles and text boxes are used to design this business diagram. This slide contains the concept of data and process flow. Use this amazing slide for your business and data related presentations.
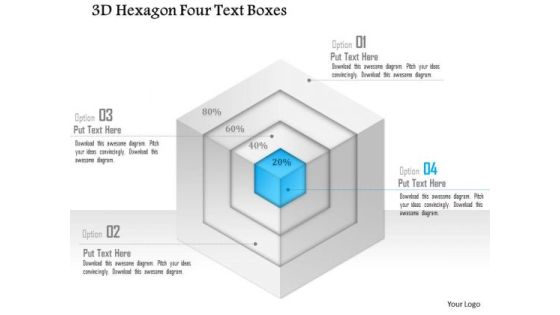
Business Diagram 3d Hexagon Four Text Boxes PowerPoint Template
Graphic of 3d hexagon diagram and text boxes are used to craft this power point template slide. This PPT slide contains the concept of data representation. Use this PPT for your business and marketing data flow related presentations.

Business Diagram Five Staged Torn Paper Text Boxes PowerPoint Template
Five staged torn paper design text box diagram has been used to craft this power point template slide. This PPT slide contains the concept of data representation. Use this PPT for your business and marketing data related presentations.

Business Diagram Five Staged Vertical Ribbon Text Boxes Presentation Template
Five staged vertical ribbon text boxes has been used to craft this power point template. This PPT contains the concept of data representation. Use this PPT for your data related topics in any business and marketing presentation.

Business Diagram Text Boxes Displaying Four Options Presentation Template
Four staged envelop style text boxes has been used to craft this power point template. This PPT contains the concept of data representation. This PPT can be used for your data related topics in any business and marketing presentation.
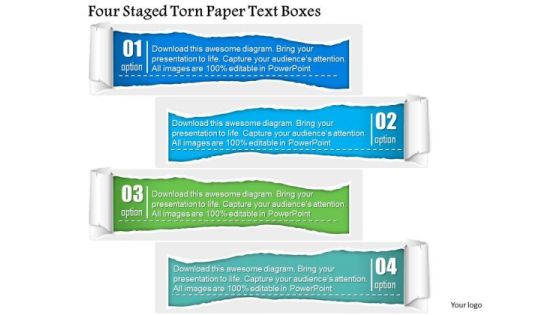
Business Diagram Four Staged Torn Paper Text Boxes PowerPoint Template
Four staged torn paper style text boxes are used to craft this power point template. This PPT contains the concept of data representation for business process. Use this PPT and build an innovative presentation for data based topics.
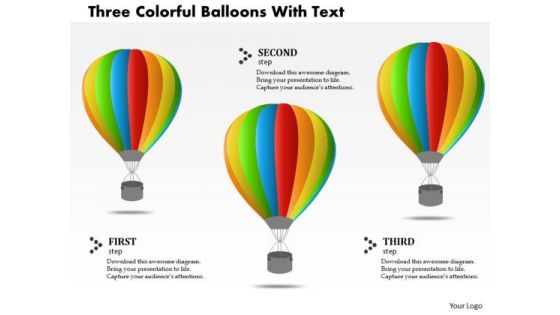
Business Diagram Three Colorful Balloons With Text PowerPoint Template
Three colorful balloons with text box has been used to craft this power point template slide. This PPt slide contains the concept of business data presentation. Use this PPT slide and build quality presentation on data related presentations.

Hr Business Intelligence Ppt Powerpoint Diagram
This is a hr business intelligence ppt powerpoint diagram. This is a one stage process. The stages in this process are back end data collection and integration tools, hr data mart, hr planning, recruitment, training skills, hr costing, knowledge management.
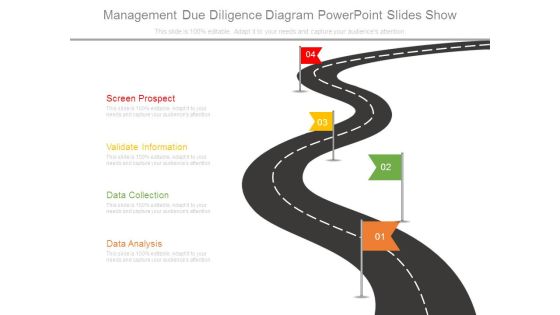
Management Due Diligence Diagram Powerpoint Slides Show
This is a management due diligence diagram powerpoint slides show. This is a four stage process. The stages in this process are screen prospect, validate information, data collection, data analysis.
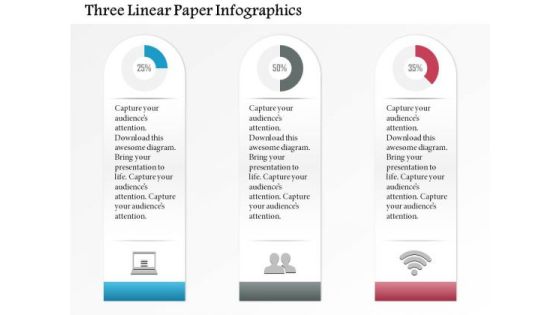
Business Diagram Three Linear Paper Infographics Presentation Template
Three linear paper info graphics has been used to design this power point template slide. This PPT slide contains the concept of data analysis and business data flow. Use this PPT slide for your business and marketing related presentations.
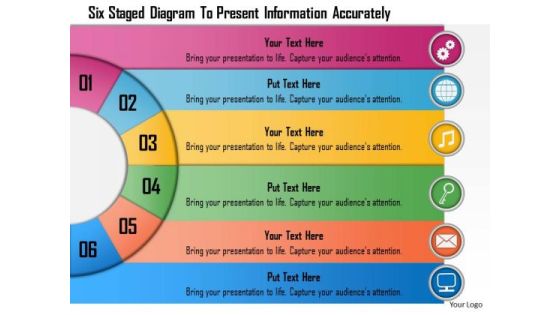
Business Diagram Six Staged Diagram To Present Information Accurately Presentation Template
Six staged semicircular text boxes are used to craft this power point template. This PPT contains the concept of data representation. Use this PPT for your business and sales related data representation in any presentation.

Business Diagram Six Staged Diagram To Present Relevant Information Presentation Template
Six staged colorful ribbon text boxes has been used to craft this power point template. This PPT contains the concept of data representation. This PPT is suitable for your data related topics in any business and marketing presentation.

Sample Of Visual Analytics Diagram Powerpoint Guide
This is a sample of visual analytics diagram powerpoint guide. This is a four stage process. The stages in this process are data analysis, business problem, find structure, data view.

Business Diagram Infographics Design With Six Options Presentation Template
Graphic of six staged info graphics has been used to design this power point template. This PPT diagram contains the concept of data flow and representation. Use this PPT for data technology related presentations.

Circular Diagram Of Agile Software Development Powerpoint Templates
This PowerPoint template has been designed with circular diagram This diagram is a data visualization tool that gives you a simple way to present statistical information. This slide helps your audience examine and interpret the data you present.
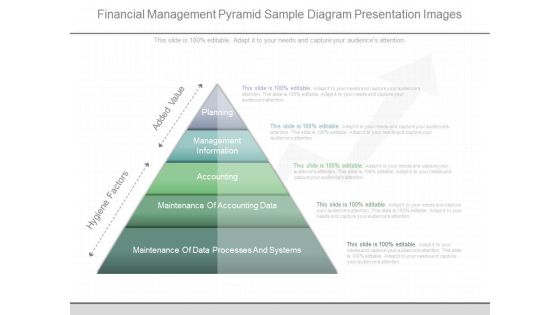
Financial Management Pyramid Sample Diagram Presentation Images
This is a financial management pyramid sample diagram presentation images. This is a five stage process. The stages in this process are planning, management information, accounting, maintenance of accounting data, maintenance of data processes and systems, hygiene factors, added value.

Business Diagram Six Staged Diagram With Trophy For Success Presentation Template
Six staged colorful ribbon text boxes has been used to craft this power point template. This PPT contains the concept of data representation. This PPT is suitable for your data related topics in any business and marketing presentation.

Marketing Intelligence Cycle Diagram Powerpoint Ideas
This is a marketing intelligence cycle diagram powerpoint ideas. This is a five stage process. The stages in this process are marketing strategy, marketing research, interactive marketing, data analytics, data management.
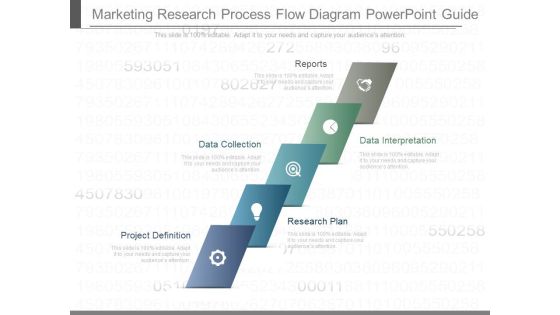
Marketing Research Process Flow Diagram Powerpoint Guide
This is a marketing research process flow diagram powerpoint guide. This is a five stage process. The stages in this process are reports, data interpretation, data collection, research plan, project definition.

Examination Planning Cycle Diagram Powerpoint Topics
This is a examination planning cycle diagram powerpoint topics. This is a five stage process. The stages in this process are network web and messaging, web security, endpoint and mobile devices, cloud and data center, data protection, end point security.

Business Diagram Infographics Design With Three Options Presentation Template
Three staged info graphics has been used to craft this power point template diagram. This PPT diagram contains the concept of data flow and storage. Use this PPT for business and data related presentations.
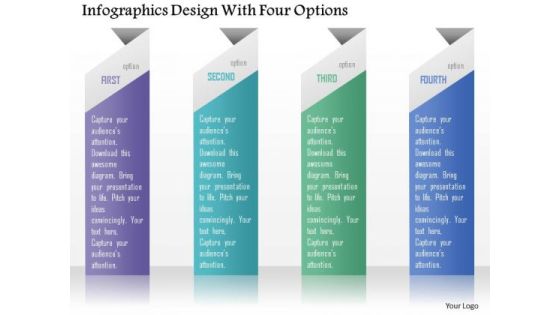
Business Diagram Infographics Design With Four Options Presentation Template
Four staged info graphics has been used to design this power point template. This PPT diagram contains the concept of data flow. Use this PPT for business and marketing data related topics in any presentation.

Business Diagram Three Staged Step Diagram For Process Flow Presentation Template
Three staged step diagram has been used to craft this power point template diagram. This PPT contains the concept of data and process flow representation. Use this PPT for business and marketing data related presentations.

Business Diagram Three Triangles To Present Business Information Presentation Template
Three interconnected triangles are used to design this business diagram. This slide contains the concept of data and process flow. Use this slide for your business and data related presentations.

Business Diagram Five Staged Infographics With Stand Design PowerPoint Template
Five staged info graphics with stand has been used to craft this power point template. This PPT contains the concept of data flow. Use this PPT slide for your sales and business data related presentations.

Advanced Email Metrics And Analysis Services Diagram Slide
This is a advanced email metrics and analysis services diagram slide. This is a four stage process. The stages in this process are analytics data warehouse, data mining, financial modeling.

Business Diagram Pillars Displaying Three Options Presentation Template
Graphic of three colored pillars has been used to design this power point template diagram. This PPT contains the concept of text and data representation. Use this PPT diagram for your business data related topics.

Business Diagram Design Of Five Pen Drives Presentation Template
Graphic of five colored pen drives has been used to craft this power point template. This PPT contains the concept of data storage. Use this PPT for data technology related presentations.
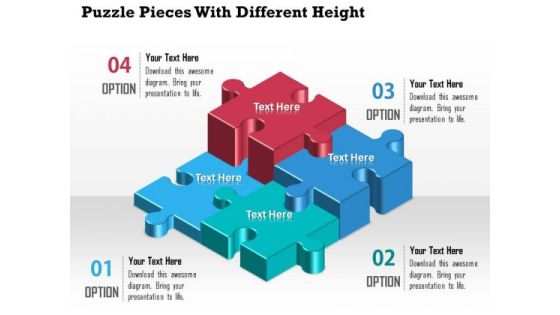
Business Diagram Puzzle Pieces With Different Height Presentation Template
A professional bar graph has been crafted with graphic of puzzles. All these puzzles are in different heights which shows the various levels of any data result representations. Use this diagram for your business result and data analysis related topics.

Business Diagram Five Business Steps In Numeric Order Presentation Template
Five colored linear text boxes are used to design this power point template. This PPT contains the concept of data flow updation. Display any data in your business presentation with this unique PPT.

Business Diagram Five Steps In Concentric Circle Presentation Template
Five staged colorful circular text boxes in linear flow has been used to design this power point template. This PPT contains the concept of data representation. Use this PPT for your data related topics in any business or sales presentation.
