Data Icon
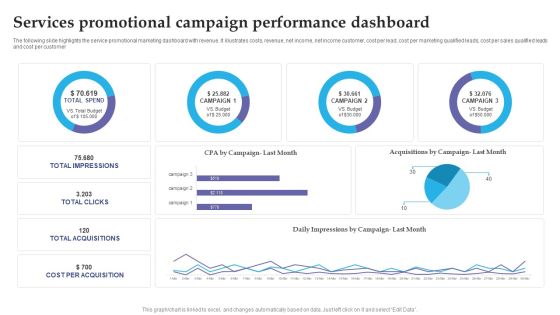
Services Promotional Campaign Performance Dashboard Slides PDF
The following slide highlights the service promotional marketing dashboard with revenue. It illustrates costs, revenue, net income, net income customer, cost per lead, cost per marketing qualified leads, cost per sales qualified leads and cost per customer. Pitch your topic with ease and precision using this Services Promotional Campaign Performance Dashboard Slides PDF. This layout presents information on Services Promotional, Campaign Performance Dashboard. It is also available for immediate download and adjustment. So, changes can be made in the color, design, graphics or any other component to create a unique layout.

Dashboard Showing Project Portfolio Metrics Microsoft PDF
This slide shows the dashboard that depicts the project portfolio management which covers the quarterly project delivery roadmap and health card with project funding, resource allocation, portfolio risks such as open change requests, open risks and issues, etc. Pitch your topic with ease and precision using this Dashboard Showing Project Portfolio Metrics Microsoft PDF. This layout presents information on Resource Allocation, Portfolio Risks, Project Funding. It is also available for immediate download and adjustment. So, changes can be made in the color, design, graphics or any other component to create a unique layout.

Multi Project Metrics Dashboard With Overall Status Pictures PDF
This slide covers the dashboard that shows the status of project such as status of schedule, resource, quality with projects which are on schedule, in which issues has been occurred, that are critical, etc. That helps the project managers to understand the progress accurately. Pitch your topic with ease and precision using this Multi Project Metrics Dashboard With Overall Status Pictures PDF. This layout presents information on Multi Project, Metrics Dashboard. It is also available for immediate download and adjustment. So, changes can be made in the color, design, graphics or any other component to create a unique layout.
Project Metrics Dashboard Depicting Tracking System Inspiration PDF
This slide focuses on project management dashboard which covers the four spirit teams, iteration defects by priority with quarterly roadmap with legends such as high attention, low, none, normal and resolved immediately with time in iteration, etc. Pitch your topic with ease and precision using this Project Metrics Dashboard Depicting Tracking System Inspiration PDF. This layout presents information on Project Metrics, Dashboard Depicting, Tracking System. It is also available for immediate download and adjustment. So, changes can be made in the color, design, graphics or any other component to create a unique layout.

Project Metrics Dashboard For Software Development Designs PDF
This slide shows the project management dashboard for developing software which focuses on health status such as time, cost, workload, risks, issues and changes with comparison of actual and planned expenses with budget. It also shows the risks, issues ad changes. Pitch your topic with ease and precision using this Project Metrics Dashboard For Software Development Designs PDF. This layout presents information on Risks, Budget, Cost. It is also available for immediate download and adjustment. So, changes can be made in the color, design, graphics or any other component to create a unique layout.

Project Metrics Dashboard With Active Issues Topics PDF
This slide focuses on the project management dashboard which shows the number of active emergency risks and issues, projects, current user count, splitting of project status by priority level, capacity percentage, top recent assignees with open, resolved and closed projects. Pitch your topic with ease and precision using this Project Metrics Dashboard With Active Issues Topics PDF. This layout presents information on Project Metrics, Dashboard With Active Issues. It is also available for immediate download and adjustment. So, changes can be made in the color, design, graphics or any other component to create a unique layout.
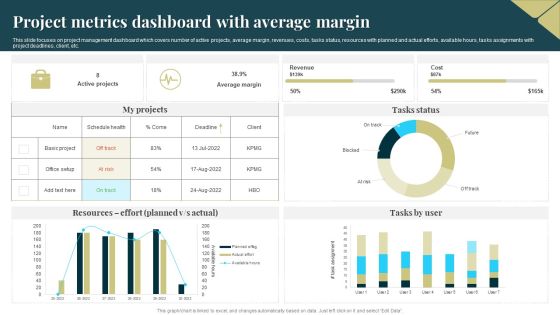
Project Metrics Dashboard With Average Margin Sample PDF
This slide focuses on project management dashboard which covers number of active projects, average margin, revenues, costs, tasks status, resources with planned and actual efforts, available hours, tasks assignments with project deadlines, client, etc. Pitch your topic with ease and precision using this Project Metrics Dashboard With Average Margin Sample PDF. This layout presents information on Average Margin, Revenue, Cost. It is also available for immediate download and adjustment. So, changes can be made in the color, design, graphics or any other component to create a unique layout.
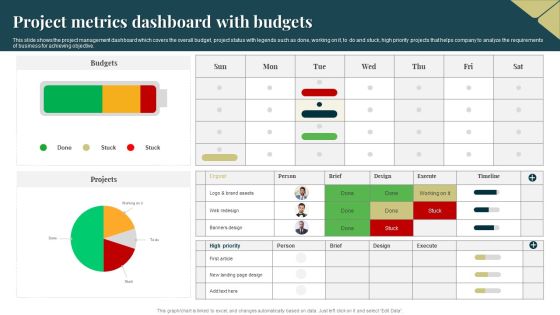
Project Metrics Dashboard With Budgets Topics PDF
This slide shows the project management dashboard which covers the overall budget, project status with legends such as done, working on it, to do and stuck, high priority projects that helps company to analyze the requirements of business for achieving objective. Pitch your topic with ease and precision using this Project Metrics Dashboard With Budgets Topics PDF. This layout presents information on Budgets, Projects, Banners Design. It is also available for immediate download and adjustment. So, changes can be made in the color, design, graphics or any other component to create a unique layout.

Project Metrics Dashboard With Due Tasks Microsoft PDF
This slide shows the project management dashboard which includes hours taken by client, account manager, service, actual working hours, description of services such as web programming, search engine optimization, graphic designing, etc. Pitch your topic with ease and precision using this Project Metrics Dashboard With Due Tasks Microsoft PDF. This layout presents information on Service, Optimization, Graphic Design. It is also available for immediate download and adjustment. So, changes can be made in the color, design, graphics or any other component to create a unique layout.
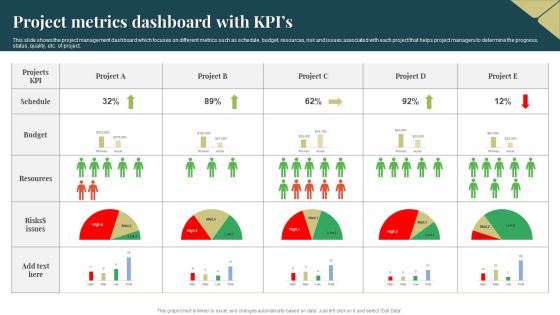
Project Metrics Dashboard With Kpis Ideas PDF
This slide shows the project management dashboard which focuses on different metrics such as schedule, budget, resources, risk and issues associated with each project that helps project managers to determine the progress, status, quality, etc. of project. Pitch your topic with ease and precision using this Project Metrics Dashboard With Kpis Ideas PDF. This layout presents information on Resources, Budget, Risks. It is also available for immediate download and adjustment. So, changes can be made in the color, design, graphics or any other component to create a unique layout.

Project Metrics Dashboard With Monthly Workload Topics PDF
This slide shows the project management dashboard which covers the number of tasks completed in last one week, return on investment on overall project, milestones covered, performance of employees, tasks created, competed, work in progress, started, etc. Pitch your topic with ease and precision using this Project Metrics Dashboard With Monthly Workload Topics PDF. This layout presents information on Investment, Employee Performance, Project Metrics Dashboard. It is also available for immediate download and adjustment. So, changes can be made in the color, design, graphics or any other component to create a unique layout.

Project Metrics Dashboard With Overall Progress Brochure PDF
This slide covers the project management dashboard which includes risks, overdue tasks, employees over budget, workloads, planning, designing, development and testing with current target amount, launch date, usage of targeted amount, etc. Pitch your topic with ease and precision using this Project Metrics Dashboard With Overall Progress Brochure PDF. This layout presents information on Design, Planning, Development. It is also available for immediate download and adjustment. So, changes can be made in the color, design, graphics or any other component to create a unique layout.
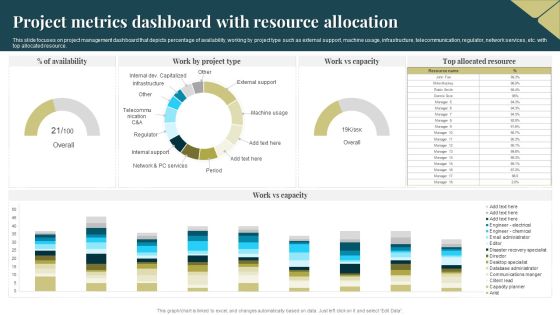
Project Metrics Dashboard With Resource Allocation Portrait PDF
This slide focuses on project management dashboard that depicts percentage of availability, working by project type such as external support, machine usage, infrastructure, telecommunication, regulator, network services, etc. with top allocated resource. Pitch your topic with ease and precision using this Project Metrics Dashboard With Resource Allocation Portrait PDF. This layout presents information on Project Metrics Dashboard, Resource Allocation. It is also available for immediate download and adjustment. So, changes can be made in the color, design, graphics or any other component to create a unique layout.
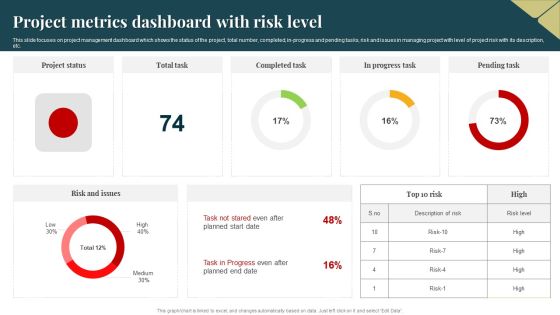
Project Metrics Dashboard With Risk Level Guidelines PDF
This slide focuses on project management dashboard which shows the status of the project, total number, completed, in progress and pending tasks, risk and issues in managing project with level of project risk with its description, etc. Pitch your topic with ease and precision using this Project Metrics Dashboard With Risk Level Guidelines PDF. This layout presents information on Project Metrics Dashboard, Risk Level. It is also available for immediate download and adjustment. So, changes can be made in the color, design, graphics or any other component to create a unique layout.

Project Metrics Dashboard With Stages Download PDF
This slide shows the project management dashboard which includes start and end date if project, its duration, status of the project, key project links and project stages with metrics such as proposal, kick off, discovery, actions, optimization , etc. Pitch your topic with ease and precision using this Project Metrics Dashboard With Stages Download PDF. This layout presents information on Economic, Project Plan, Execution. It is also available for immediate download and adjustment. So, changes can be made in the color, design, graphics or any other component to create a unique layout.
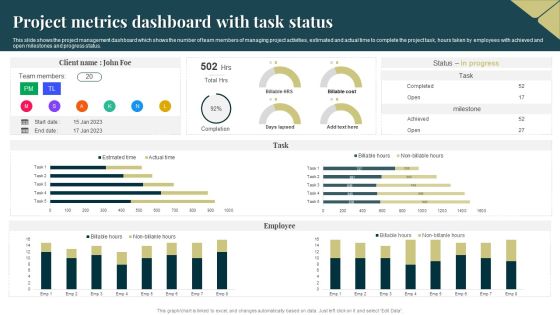
Project Metrics Dashboard With Task Status Rules PDF
This slide shows the project management dashboard which shows the number of team members of managing project activities, estimated and actual time to complete the project task, hours taken by employees with achieved and open milestones and progress status. Pitch your topic with ease and precision using this Project Metrics Dashboard With Task Status Rules PDF. This layout presents information on Team Members, Employee. It is also available for immediate download and adjustment. So, changes can be made in the color, design, graphics or any other component to create a unique layout.

Project Metrics Dashboard With Team Requests Background PDF
This slide focuses on the project management dashboard which shows the creation of monthly number of requests, requests made by departmental teams, average completion time in days with the number of requests created on week days, etc. Pitch your topic with ease and precision using this Project Metrics Dashboard With Team Requests Background PDF. This layout presents information on Project Metrics Dashboard, Team Requests. It is also available for immediate download and adjustment. So, changes can be made in the color, design, graphics or any other component to create a unique layout.
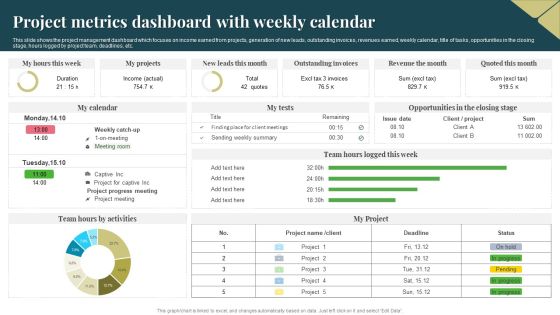
Project Metrics Dashboard With Weekly Calendar Download PDF
This slide shows the project management dashboard which focuses on income earned from projects, generation of new leads, outstanding invoices, revenues earned, weekly calendar, title of tasks, opportunities in the closing stage, hours logged by project team, deadlines, etc. Pitch your topic with ease and precision using this Project Metrics Dashboard With Weekly Calendar Download PDF. This layout presents information on Income, Revenue, Project. It is also available for immediate download and adjustment. So, changes can be made in the color, design, graphics or any other component to create a unique layout.

Project Portfolio Metrics Dashboard With Activity Plan Clipart PDF
This slide focuses on project portfolio management dashboard which includes completed projects, budget spent, number of team members, associated risks and issues, activity plan with duration, status percentage, budget allocation, critical issues, tasks, comments, etc. Pitch your topic with ease and precision using this Project Portfolio Metrics Dashboard With Activity Plan Clipart PDF. This layout presents information on Budgets, Team, Risks. It is also available for immediate download and adjustment. So, changes can be made in the color, design, graphics or any other component to create a unique layout.

Dashboard Tracking Essential Kpis For Ecommerce Performance Slides PDF
This slide provides information regarding essential KPIs for ecommerce performance dashboard tracking average bounce rate, new vs. old customers, channel revenue vs. channel acquisitions costs, channel revenue vs. sales, average conversion rate, etc. Deliver an awe inspiring pitch with this creative Dashboard Tracking Essential Kpis For Ecommerce Performance Slides PDF bundle. Topics like Average Bounce Rate, Channel Acquisition Costs, Channel Revenue can be discussed with this completely editable template. It is available for immediate download depending on the needs and requirements of the user.

Dashboard For Customer Satisfaction Survey Outcome Results Topics PDF
This slide showcases outcome of customer satisfaction survey that can help organization to gain insight about customer requirements and implement strategies to reduce customer churn rate in future. It also showcases product recommendation and improvement feedback from customers. Pitch your topic with ease and precision using this Dashboard For Customer Satisfaction Survey Outcome Results Topics PDF. This layout presents information on Dashboard, Customer Satisfaction, Survey Outcome Results. It is also available for immediate download and adjustment. So, changes can be made in the color, design, graphics or any other component to create a unique layout.

Customer Service Metrics Dashboard For Email And Chat Infographics PDF
This slide showcases dashboard for customer service metrics that can help to identify the customer satisfaction score plus implement strategies in case of decline. Its key KPIs are first response time, requester wait time, first response time and time to close. Pitch your topic with ease and precision using this Customer Service Metrics Dashboard For Email And Chat Infographics PDF. This layout presents information on Customer Service, Metrics Dashboard, Email And Chat. It is also available for immediate download and adjustment. So, changes can be made in the color, design, graphics or any other component to create a unique layout.

Customer Service Metrics Dashboard With Average First Response Time Background PDF
This slide showcases Dashboard for Customer Service metrics that can help organization to easily identify the key pain points of your customers, areas which need additional resources and support agents that can benefit from additional training. It also showcases performance of top and bottom 5 call support agents. Pitch your topic with ease and precision using this Customer Service Metrics Dashboard With Average First Response Time Background PDF. This layout presents information on Average, Abandon Rate, Contact Resolution. It is also available for immediate download and adjustment. So, changes can be made in the color, design, graphics or any other component to create a unique layout.

Customer Service Metrics Dashboard With Net Retention Rate Sample PDF
This slide showcases KPI dashboard for customer service that can help to compare the customer churn rate, revenue churn rate, net retention rate and MRR growth rate as compared to previous month. Its key elements are net promoter score, loyal customer rate, percentage of premium users and customer lifetime value. Pitch your topic with ease and precision using this Customer Service Metrics Dashboard With Net Retention Rate Sample PDF. This layout presents information on Loyal Customer Rate, Premium Users, Customer Lifetime Value. It is also available for immediate download and adjustment. So, changes can be made in the color, design, graphics or any other component to create a unique layout.

Net Cash Flow To Measure Monetary Financial Study Ppt Layouts Clipart Images PDF
This slide shows net cash flow measurement of financial feasibility to assess the practicality of project. It includes factors such as amount and cumulative net cash flow. Pitch your topic with ease and precision using this Net Cash Flow To Measure Monetary Financial Study Ppt Layouts Clipart Images PDF. This layout presents information on Cash Flow, Profit Generation, Quick Payment Terms. It is also available for immediate download and adjustment. So, changes can be made in the color, design, graphics or any other component to create a unique layout.

Marketing Strategy To Enhance Real Estate Sales Defining The Most Important Drivers And Traits For The Business Success Brochure PDF
Following slide portrays information about the important drivers and traits for business success. It shows that business vision and passionate about work are the most important driver and trait for business success. Deliver an awe inspiring pitch with this creative Marketing Strategy To Enhance Real Estate Sales Defining The Most Important Drivers And Traits For The Business Success Brochure PDF bundle. Topics like Market Positioning, Business Success, Business Model can be discussed with this completely editable template. It is available for immediate download depending on the needs and requirements of the user.

Cyber Security Key Performance Indicators Metrics Dashboard Mockup PDF
This slide covers cyber security health status dashboard . It also includes audit and compliance, controls health, project status, incident response process, vulnerability patching schedule, investigation process and training compliance. Pitch your topic with ease and precision using this Cyber Security Key Performance Indicators Metrics Dashboard Mockup PDF. This layout presents information on Cyber Security, Vulnerability Patching Schedule, Compliance Investigation Process. It is also available for immediate download and adjustment. So, changes can be made in the color, design, graphics or any other component to create a unique layout.

Cyber Security Program Management Dashboard With KPI Metrics Ideas PDF
The following slide shows dashboard of CPM cyber security program management which helps to access high value assets and check threats , risks and policies on one platform. It includes current threat postures, risks, policy, service breakdown, assets by category and their control issues. Pitch your topic with ease and precision using this Cyber Security Program Management Dashboard With KPI Metrics Ideas PDF. This layout presents information on Cyber Security, Program Management Dashboard, Kpi Metrics. It is also available for immediate download and adjustment. So, changes can be made in the color, design, graphics or any other component to create a unique layout.

Electronic Banking Dashboard With Bank Transfer And Users Background PDF
This slide showcases dashboard of online banking helps to know the status of funds or finances. It includes other bank transfer, users by OS, browser and country. Pitch your topic with ease and precision using this Electronic Banking Dashboard With Bank Transfer And Users Background PDF. This layout presents information on Electronic Banking Dashboard, Bank Transfer And Users. It is also available for immediate download and adjustment. So, changes can be made in the color, design, graphics or any other component to create a unique layout.

Project Management Revenue And Customer Progress Report Clipart PDF
This slide exhibits revenue and customer progress status report in the project. It includes revenue, the number of new customers, average revenue per customer, and customer acquisition cost. Pitch your topic with ease and precision using this Project Management Revenue And Customer Progress Report Clipart PDF. This layout presents information on Customer Acquisition Cost, Average Revenue, Per Customer. It is also available for immediate download and adjustment. So, changes can be made in the color, design, graphics or any other component to create a unique layout.

Integrating Social Media Tactics Auditing Companys Social Media Presence Clipart PDF
This slide shows social media presence audit for companys profiles. It provides information about social media site, followers, subscribers, new followers gained per week, last activity, verified page, engagement rate, primary age group, etc. Deliver and pitch your topic in the best possible manner with this Integrating Social Media Tactics Auditing Companys Social Media Presence Clipart PDF. Use them to share invaluable insights on Social Media Site, Facebook, Instagram and impress your audience. This template can be altered and modified as per your expectations. So, grab it now.
Tracking Channel Campaign Metrics To Measure Web Traffic Sample PDF
This slide covers measuring campaign key performance indicators through tracking channel web traffic which includes total visit, cost per click, engagement rate and total impressions. Pitch your topic with ease and precision using this Tracking Channel Campaign Metrics To Measure Web Traffic Sample PDF. This layout presents information on Revenue By Channel, Website Demographics, Product Sales Trend. It is also available for immediate download and adjustment. So, changes can be made in the color, design, graphics or any other component to create a unique layout.
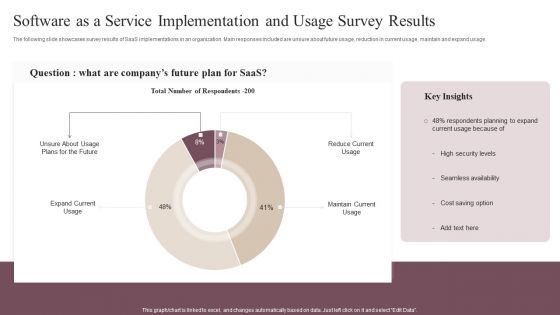
Software As A Service Implementation And Usage Survey Results Clipart PDF
The following slide showcases survey results of SaaS implementations in an organization. Main responses included are unsure about future usage, reduction in current usage, maintain and expand usage. Pitch your topic with ease and precision using this Software As A Service Implementation And Usage Survey Results Clipart PDF. This layout presents information on Reduce Current Usage, Maintain Current Usage, Expand Current Usage . It is also available for immediate download and adjustment. So, changes can be made in the color, design, graphics or any other component to create a unique layout.

Action Plan To Bridge Business Performance Gaps Merger And Integration Procedure Ideas PDF
Mentioned slide highlights the information about the action plan that company can use to bridge its business performance gaps. The slide also includes the details about the efforts required for a specific action. Deliver an awe inspiring pitch with this creative Action Plan To Bridge Business Performance Gaps Merger And Integration Procedure Ideas PDF bundle. Topics like Resources Nurturing, Communication Strategy, Customer Experience can be discussed with this completely editable template. It is available for immediate download depending on the needs and requirements of the user.
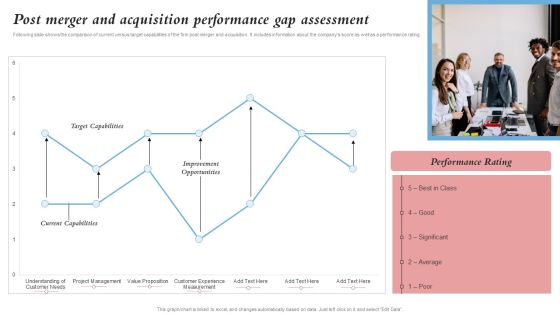
Post Merger And Acquisition Performance Gap Assessment Merger And Integration Procedure Topics PDF
Following slide shows the comparison of current versus target capabilities of the firm post merger and acquisition. It includes information about the companys score as well as a performance rating.Deliver and pitch your topic in the best possible manner with this Post Merger And Acquisition Performance Gap Assessment Merger And Integration Procedure Topics PDF. Use them to share invaluable insights on Target Capabilities, Current Capabilities, Improvement Opportunities and impress your audience. This template can be altered and modified as per your expectations. So, grab it now.

Retail Store Inventory Safety Stock Assessment Retail Outlet Operations Performance Evaluation Graphics PDF
This slide shows the current performance of inventory operations providing information regarding customer and predicted demand, excess and deficit values, desired and actual safety stocks in days along with the forecast accuracy.Deliver and pitch your topic in the best possible manner with this Retail Store Inventory Safety Stock Assessment Retail Outlet Operations Performance Evaluation Graphics PDF. Use them to share invaluable insights on Predicted Demand, Customer Demand, Beginning and impress your audience. This template can be altered and modified as per your expectations. So, grab it now.
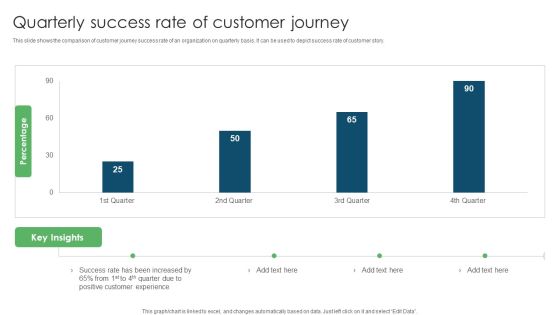
Quarterly Success Rate Of Customer Journey Ppt PowerPoint Presentation Outline Mockup PDF
This slide shows the comparison of customer journey success rate of an organization on quarterly basis. It can be used to depict success rate of customer story. Pitch your topic with ease and precision using this Quarterly Success Rate Of Customer Journey Ppt PowerPoint Presentation Outline Mockup PDF. This layout presents information on Success Rate, Increased Positive, Customer Experience. It is also available for immediate download and adjustment. So, changes can be made in the color, design, graphics or any other component to create a unique layout.

Profitability Comparison Of Business Investments In Securities Ppt PowerPoint Presentation Outline Deck PDF
This slide shows graphical report to analyze market timing and fluctuations in returns to gain maximum from the funds invested in share market. It includes details about most profitable ones, average and least growth. Pitch your topic with ease and precision using this Profitability Comparison Of Business Investments In Securities Ppt PowerPoint Presentation Outline Deck PDF. This layout presents information on Most Profitable, Least Profitable, Least Profitable. It is also available for immediate download and adjustment. So, changes can be made in the color, design, graphics or any other component to create a unique layout.
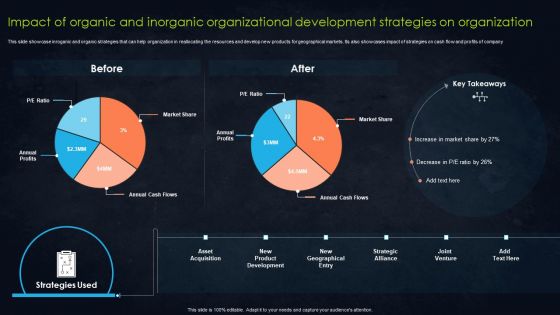
Impact Of Organic And Inorganic Organizational Development Strategies On Organization Demonstration PDF
This slide showcase inroganic and organic strategies that can help organization in reallocating the resources and develop new products for geographical markets. Its also showcases impact of strategies on cash flow and profits of company. Pitch your topic with ease and precision using this Impact Of Organic And Inorganic Organizational Development Strategies On Organization Demonstration PDF. This layout presents information on Annual Profits, Market Share, Strategies. It is also available for immediate download and adjustment. So, changes can be made in the color, design, graphics or any other component to create a unique layout.

Consumer Acquisition And Retention Monthly Graph Background PDF
This slide displays monthly retention rate and number of acquired customers within a business for building a strong customer base and strategy formulation. It also includes graphs showing the customer acquisition and retention with key insights. Pitch your topic with ease and precision using this Consumer Acquisition And Retention Monthly Graph Background PDF. This layout presents information on Consumer Acquisition, Retention Monthly Graph. It is also available for immediate download and adjustment. So, changes can be made in the color, design, graphics or any other component to create a unique layout.
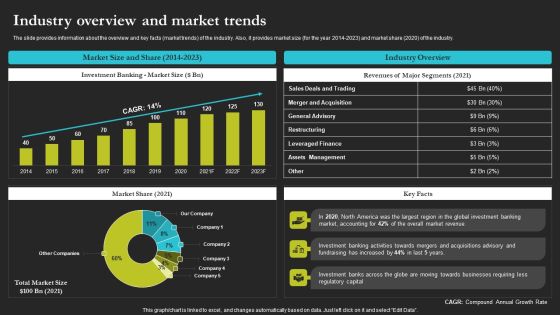
Sell Side Merger And Acquisition Industry Overview And Market Trends Introduction PDF
The slide provides information about the overview and key facts market trends of the industry. Also, it provides market size for the year 2014 to 2023 and market share 2020 of the industry. Deliver an awe inspiring pitch with this creative Sell Side Merger And Acquisition Industry Overview And Market Trends Introduction PDF bundle. Topics like Industry Overview, Market Size, 2014 To 2023 can be discussed with this completely editable template. It is available for immediate download depending on the needs and requirements of the user.

Addressing Present Challenges Faced By IT Department Download PDF
This slide provides information regarding various challenges faced by IT department in terms of rise in IT infrastructure cost, reasons for rise in IT spending and reported financial losses due to increase in security threats. Deliver and pitch your topic in the best possible manner with this Addressing Present Challenges Faced By IT Department Download PDF. Use them to share invaluable insights on Management Tools, Financial, Security and impress your audience. This template can be altered and modified as per your expectations. So, grab it now.

Cios Initiative 8 Outsourcing Managed Service Providers To Reduce Overall Costs Download PDF
This slide provides information regarding outsourcing of managed service providers in order to limit overall costs such as reducing hardware costs, software costs, employee productivity costs and reputation costs. Deliver and pitch your topic in the best possible manner with this Cios Initiative 8 Outsourcing Managed Service Providers To Reduce Overall Costs Download PDF. Use them to share invaluable insights on Network Costs, Reducing Employee Productivity Costs, Reducing Reputation Costs and impress your audience. This template can be altered and modified as per your expectations. So, grab it now.

Retail Outlet Operational Efficiency Analytics Overview Of Retail Stores Rules PDF
This slide provides information regarding retail company in terms of headquarters, revenues, total number of employees, number of stores across USA. It also covers details of common operational challenges faced by stores. Deliver an awe inspiring pitch with this creative Retail Outlet Operational Efficiency Analytics Overview Of Retail Stores Rules PDF bundle. Topics like Retail Stores, Across USA, Common Operational Challenges can be discussed with this completely editable template. It is available for immediate download depending on the needs and requirements of the user.
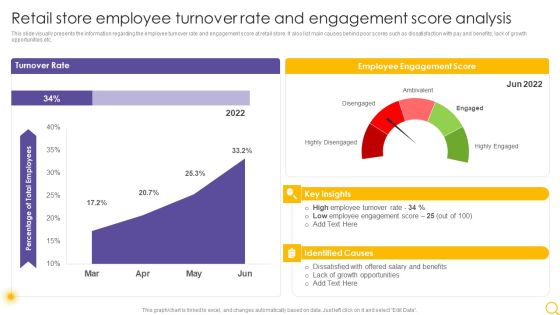
Retail Outlet Operational Efficiency Analytics Retail Store Employee Turnover Rate And Engagement Infographics PDF
This slide visually presents the information regarding the employee turnover rate and engagement score at retail store. It also list main causes behind poor scores such as dissatisfaction with pay and benefits, lack of growth opportunities etc. Deliver an awe inspiring pitch with this creative Retail Outlet Operational Efficiency Analytics Retail Store Employee Turnover Rate And Engagement Infographics PDF bundle. Topics like Turnover Rate, Employee Engagement Score, Identified Causes can be discussed with this completely editable template. It is available for immediate download depending on the needs and requirements of the user.
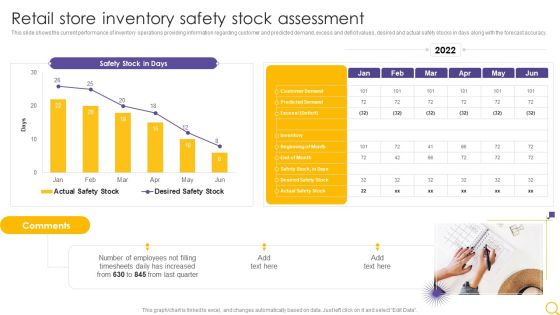
Retail Outlet Operational Efficiency Analytics Retail Store Inventory Safety Stock Assessment Template PDF
This slide shows the current performance of inventory operations providing information regarding customer and predicted demand, excess and deficit values, desired and actual safety stocks in days along with the forecast accuracy. Deliver an awe inspiring pitch with this creative Retail Outlet Operational Efficiency Analytics Retail Store Inventory Safety Stock Assessment Template PDF bundle. Topics like Safety Stock Days, Employees, Timesheets Daily can be discussed with this completely editable template. It is available for immediate download depending on the needs and requirements of the user.
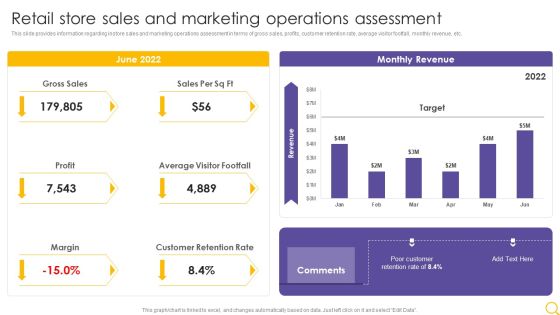
Retail Outlet Operational Efficiency Analytics Retail Store Sales And Marketing Operations Assessment Designs PDF
This slide provides information regarding instore sales and marketing operations assessment in terms of gross sales, profits, customer retention rate, average visitor footfall, monthly revenue, etc. Deliver and pitch your topic in the best possible manner with this Retail Outlet Operational Efficiency Analytics Retail Store Sales And Marketing Operations Assessment Designs PDF. Use them to share invaluable insights on Gross Sales, Profit, Average Visitor Footfall and impress your audience. This template can be altered and modified as per your expectations. So, grab it now.

Retail Outlet Operational Efficiency Analytics Sales Dashboards For Retail Store Inspiration PDF
This slide illustrates the dashboard retail store sales forecasting providing information regarding sales per employee, price unit every transaction, total number of customers and average value of customer transaction. Deliver and pitch your topic in the best possible manner with this Retail Outlet Operational Efficiency Analytics Sales Dashboards For Retail Store Inspiration PDF. Use them to share invaluable insights on Gross Sales, Total No Customers, Value Customer and impress your audience. This template can be altered and modified as per your expectations. So, grab it now.
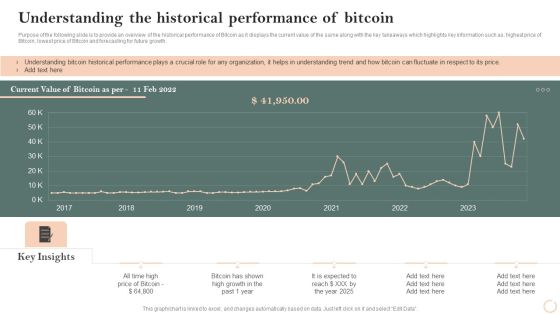
Virtual Assets Investment Guide Understanding The Historical Performance Of Bitcoin Pictures PDF
Purpose of the following slide is to provide an overview of the historical performance of Bitcoin as it displays the current value of the same along with the key takeaways which highlights key information such as highest price of Bitcoin, lowest price of Bitcoin and forecasting for future growth. Deliver and pitch your topic in the best possible manner with this Virtual Assets Investment Guide Understanding The Historical Performance Of Bitcoin Pictures PDF. Use them to share invaluable insights on Current Value, 2017 To 2023, High Price and impress your audience. This template can be altered and modified as per your expectations. So, grab it now.

Virtual Currency Investment Guide For Companies Understanding The Historical Performance Of Bitcoin Formats PDF
Purpose of the following slide is to provide an overview of the historical performance of Bitcoin as it displays the current value of the same along with the key takeaways which highlights key information such as highest price of Bitcoin, lowest price of Bitcoin and forecasting for future growth. Deliver an awe inspiring pitch with this creative Virtual Currency Investment Guide For Companies Understanding The Historical Performance Of Bitcoin Formats PDF bundle. Topics like Current Value, Bitcoin As Per, 2016 To 2022 can be discussed with this completely editable template. It is available for immediate download depending on the needs and requirements of the user.
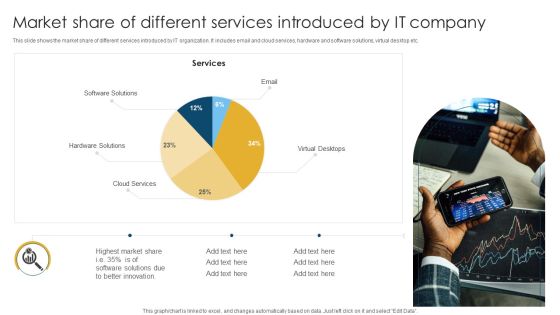
Market Share Of Different Services Introduced By IT Company Download PDF
This slide shows the market share of different services introduced by IT organization. It includes email and cloud services, hardware and software solutions, virtual desktop etc. Pitch your topic with ease and precision using this Market Share Of Different Services Introduced By IT Company Download PDF. This layout presents information on Software Solutions, Hardware Solutions, Highest Market. It is also available for immediate download and adjustment. So, changes can be made in the color, design, graphics or any other component to create a unique layout.
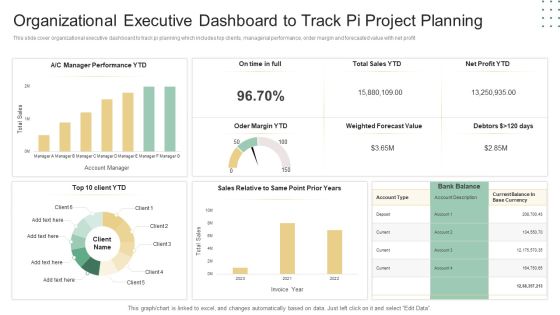
Organizational Executive Dashboard To Track Pi Project Planning Ppt Professional Background PDF
This slide cover organizational executive dashboard to track pi planning which includes top clients, managerial performance, order margin and forecasted value with net profit. Pitch your topic with ease and precision using this Organizational Executive Dashboard To Track Pi Project Planning Ppt Professional Background PDF. This layout presents information on Weighted Forecast Value, Top 10, Client YTD. It is also available for immediate download and adjustment. So, changes can be made in the color, design, graphics or any other component to create a unique layout.

Customer Behavior Analytics Dashboard To Improve Satisfaction Ppt File Infographics PDF
The following slide provides an insight of websites performance that includes date parameters. The dashboard includes sessions, users, pageviews, bounce rate and percentage of new sessions. Pitch your topic with ease and precision using this Customer Behavior Analytics Dashboard To Improve Satisfaction Ppt File Infographics PDF. This layout presents information on Session, Avg Session Duration, Bounce Rate. It is also available for immediate download and adjustment. So, changes can be made in the color, design, graphics or any other component to create a unique layout.

Customer Buying Behavior Analytics Report Ppt Inspiration Elements PDF
The following slide showcases analytic report of consumer behavior that provides an insight on consumers purchasing or buying behavior. key findings covered are customers compare prices, prefer online shopping, cut on unnecessary expenses etc. Pitch your topic with ease and precision using this Customer Buying Behavior Analytics Report Ppt Inspiration Elements PDF. This layout presents information on Customer Will, Continue Shopping, Stores Reopen, Customers Compare Prices. It is also available for immediate download and adjustment. So, changes can be made in the color, design, graphics or any other component to create a unique layout.
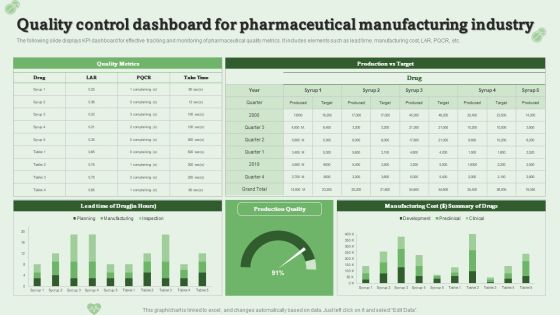
Quality Control Dashboard For Pharmaceutical Manufacturing Industry Ppt PowerPoint Presentation Model Layouts PDF
The following slide displays KPI dashboard for effective tracking and monitoring of pharmaceutical quality metrics. It includes elements such as lead time, manufacturing cost, LAR, PQCR, etc.Pitch your topic with ease and precision using this Quality Control Dashboard For Pharmaceutical Manufacturing Industry Ppt PowerPoint Presentation Model Layouts PDF. This layout presents information on Manufacturing Cost, Summary Drugs, Quality Metrics. It is also available for immediate download and adjustment. So, changes can be made in the color, design, graphics or any other component to create a unique layout.

Annual Staff Productivity Enhancement Graph Ppt PowerPoint Presentation Styles Aids PDF
This slide can be used to show improvement in employee productivity over past four years. The main reason for productivity improvement is the managerial and organizational support provided to employees. Pitch your topic with ease and precision using this Annual Staff Productivity Enhancement Graph Ppt PowerPoint Presentation Styles Aids PDF. This layout presents information on Employee Productivity, Improved Last, Due Continuous. It is also available for immediate download and adjustment. So, changes can be made in the color, design, graphics or any other component to create a unique layout.

Deploying Iot In Logistics And Supply Chain Iot Dashboard For Managing Fleet Units Download PDF
This slide showcases Internet of Things IoT integrated dashboard which can assist logistics managers in fleet management. It provides information about employees, fleet status, truck, car, container, moving units, engine hours, etc. Deliver and pitch your topic in the best possible manner with this Deploying Iot In Logistics And Supply Chain Iot Dashboard For Managing Fleet Units Download PDF. Use them to share invaluable insights on Fleet Status, Employees, Unit Types and impress your audience. This template can be altered and modified as per your expectations. So, grab it now.

Assessment Of Theft Incidents At Retail Store Retail Outlet Performance Assessment Mockup PDF
This slide provides information regarding the percentage of theft incidents that occurred at the retail store in a given quarter such as shoplifting, employee theft, card fraud, etc. Deliver and pitch your topic in the best possible manner with this Assessment Of Theft Incidents At Retail Store Retail Outlet Performance Assessment Mockup PDF. Use them to share invaluable insights on Assessment Theft, Incidents, Retail Store and impress your audience. This template can be altered and modified as per your expectations. So, grab it now.
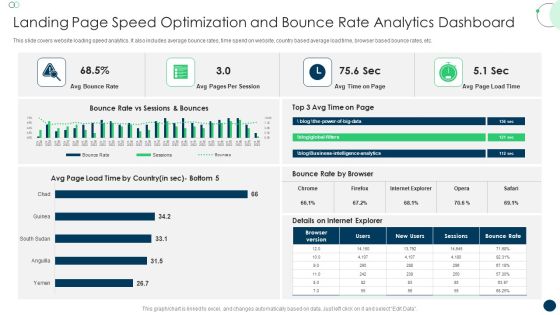
Landing Page Speed Optimization And Bounce Rate Analytics Dashboard Topics PDF
This slide covers website loading speed analytics. It also includes average bounce rates, time spend on website, country based average load time, browser based bounce rates, etc. Pitch your topic with ease and precision using this Landing Page Speed Optimization And Bounce Rate Analytics Dashboard Topics PDF. This layout presents information on Avg Bounce Rate, Avg Pages, Per Session. It is also available for immediate download and adjustment. So, changes can be made in the color, design, graphics or any other component to create a unique layout.

Customer Client Referral Program Performance Dashboard Ppt File Visual Aids PDF
This slide covers customer referral program performance evaluating dashboard. It involves participation rate by referrals, number of referred customers, conversion rate and total revenue generated. Pitch your topic with ease and precision using this Customer Client Referral Program Performance Dashboard Ppt File Visual Aids PDF. This layout presents information on Participation Rate Referrals, Number Referred Customers, Referral Conversion Rate. It is also available for immediate download and adjustment. So, changes can be made in the color, design, graphics or any other component to create a unique layout.
 Home
Home