Data Governance

Four Steps For Financial Data Analysis Powerpoint Slides
This PowerPoint contains four circles with percentage values. Download this diagram slide to display financial data analysis. This template is editable, You can edit text, color, shade and style of this diagram as per you need.

Data Management Maturity Levels For Stakeholder Engagement Pictures PDF
The purpose of this slide is to showcase a concise model that enables stakeholder engagement professionals to benchmark their organizations stakeholder data management processes. The levels include ground level, ADHOC level, operational and organizational level. Presenting Data Management Maturity Levels For Stakeholder Engagement Pictures PDF to dispense important information. This template comprises four stages. It also presents valuable insights into the topics including Operational Level, Organizational Level, Ground Level. This is a completely customizable PowerPoint theme that can be put to use immediately. So, download it and address the topic impactfully.
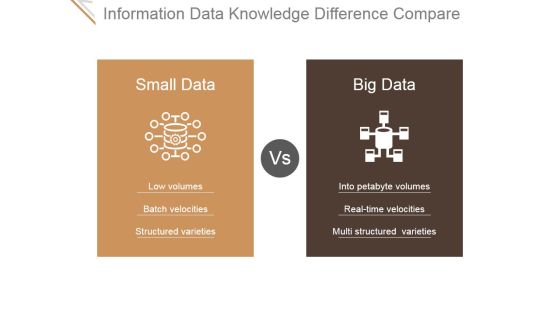
Information Data Knowledge Difference Compare Ppt PowerPoint Presentation Samples
This is a information data knowledge difference compare ppt powerpoint presentation samples. This is a two stage process. The stages in this process are low volumes, batch velocities, structured varieties, into petabyte volumes, real time velocities, multi structured varieties.

Data Product Launch Project Management Plan Pictures PDF
In this slide we have showcased major initiatives which are required to successfully launch a data product. It includes major initiatives like- product initiatives, email tasks, conduct surveys, collaterals etc. Presenting Data Product Launch Project Management Plan Pictures PDF to dispense important information. This template comprises four stages. It also presents valuable insights into the topics including Product Initiatives, Conduct Surveys, Budget Allocated. This is a completely customizable PowerPoint theme that can be put to use immediately. So, download it and address the topic impactfully.

Transaction Data Overview Company Payout Dashboard Guidelines PDF
The slide highlights the payment dashboard to overview the transaction data for effectively managing finances. Various elements included are activities, statistics, card information, transaction history, and budget. Pitch your topic with ease and precision using this Transaction Data Overview Company Payout Dashboard Guidelines PDF. This layout presents information on Transaction History, Budget, Card Information, Statistics. It is also available for immediate download and adjustment. So, changes can be made in the color, design, graphics or any other component to create a unique layout.

Infrastructure Supervision IT Infrastructure And Data Center Interaction Professional PDF
This slide covers the 30 60 90-day plan for IT infrastructure interaction which will assist the company in planning, designing, and implementation of desktop virtualization, server virtualization, passive network infrastructure, wireless solutions, etc. This is a Infrastructure Supervision IT Infrastructure And Data Center Interaction Professional PDF template with various stages. Focus and dispense information on four stages using this creative set, that comes with editable features. It contains large content boxes to add your information on topics like Desktop Virtualization, Server Virtualization, Passive Network Infrastructure, Wireless Solutions. You can also showcase facts, figures, and other relevant content using this PPT layout. Grab it now.
Business Diagram Three Colored Banners For Data Representation Presentation Template
Three colored banners are used to craft this power point template slide. This PPT slide contains the concept of data representation. Use this PPT slide for your business and management related presentations.
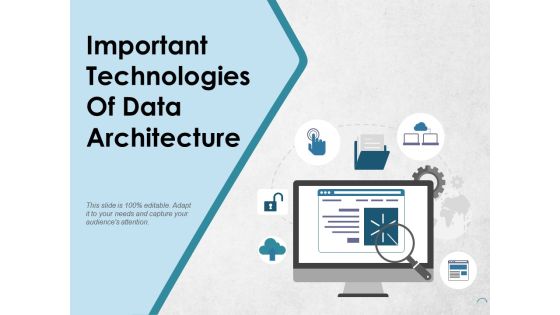
Important Technologies Of Data Architecture Ppt PowerPoint Presentation Show Inspiration
This is a important technologies of data architecture ppt powerpoint presentation show inspiration. This is a one stage process. The stages in this process are business, marketing, technology, computer, internet.

Executing Advance Data Analytics At Workspace Comprehensive Network Diagrams PDF
This slide helps in analyzing the performance of different executives representatives. It will help in tracking metrics such as cost per contact, percentage of tickets opened, etc. The staff performance will be assessed on various parameters such as cost, quality, productivity and service level. Deliver and pitch your topic in the best possible manner with this executing advance data analytics at workspace comprehensive network diagrams pdf. Use them to share invaluable insights on assessing staff performance on various parameters and impress your audience. This template can be altered and modified as per your expectations. So, grab it now.

Five Steps For Data Compare And Analysis Powerpoint Template
Our above slide contains graphics of five steps chart. This PowerPoint template is useful for data compare and analysis. Use this diagram to impart more clarity to subject and to create more sound impact on viewers.

Bar Graph For Data Distribution And Analysis Powerpoint Slides
This PowerPoint template has been designed with bar graph. This PowerPoint diagram is useful for data distribution and analysis This diagram slide can be used to make impressive presentations.

Bi With Big Data Technology Ppt Presentation Graphics
This is a bi with big data technology ppt presentation graphics. This is a six stage process. The stages in this process are listen, learn, correct, look, correct, predict.

Data Collection And Analysis Ppt Powerpoint Presentation Icon Example Topics
This is a data collection and analysis ppt powerpoint presentation icon example topics. This is a four stage process. The stages in this process are productivity improvement, output improvement, productivity enhancement.

New Information Sources For Big Data Ppt Presentation Slides
This is a new information sources for big data ppt presentation slides. This is a four stage process. The stages in this process are mix information, transactional, machine, social, enterprise, volume, structured, velocity, semi structured, variety, unstructured, valued, mixed.

Predictive Data Model Working Of Predictive Analytics Models Pictures PDF
This slide depicts the working of predictive analytics models that operates iteratively. The main phases in working include business understanding, data understanding, data preparation, modeling, evaluation, and deployment. Formulating a presentation can take up a lot of effort and time, so the content and message should always be the primary focus. The visuals of the PowerPoint can enhance the presenters message, so our Predictive Data Model Working Of Predictive Analytics Models Pictures PDF was created to help save time. Instead of worrying about the design, the presenter can concentrate on the message while our designers work on creating the ideal templates for whatever situation is needed. Slidegeeks has experts for everything from amazing designs to valuable content, we have put everything into Predictive Data Model Working Of Predictive Analytics Models Pictures PDF

data collection and analysis control chart ppt powerpoint presentation styles
This is a data collection and analysis control chart ppt powerpoint presentation styles. This is a one stage process. The stages in this process are upper limit, centerline, plotted points, lower limit, point labels.

Data And Analysis Ppt PowerPoint Presentation File Topics
This is a data and analysis ppt powerpoint presentation file topics. This is a six stage process. The stages in this process are root cause analysis, opportunity analysis, timeline analysis, force field analysis.

Data And Analysis Ppt PowerPoint Presentation Icon Diagrams
This is a Data And Analysis Ppt PowerPoint Presentation Icon Diagrams. This is a six stage process. The stages in this process are root cause analysis, opportunity analysis, timeline analysis, force field analysis.

Data Mining Segmentation And Analysis Ppt PowerPoint Presentation Slides
This is a data mining segmentation and analysis ppt powerpoint presentation slides. This is a four stage process. The stages in this process are cluster analysis, cluster examination, cluster investigation.

Table Of Contents For Retailer Instructions Playbook Data Ideas PDF
This is a Table Of Contents For Retailer Instructions Playbook Data Ideas PDF template with various stages. Focus and dispense information on one stages using this creative set, that comes with editable features. It contains large content boxes to add your information on topics like Retail Transformation, Innovation, Data Driven Retail. You can also showcase facts, figures, and other relevant content using this PPT layout. Grab it now.

Forms Type Of Big Data Ppt PowerPoint Presentation Infographic Template
This is a forms type of big data ppt powerpoint presentation infographic template. This is a three stage process. The stages in this process are unstructured, structured, semi structured.
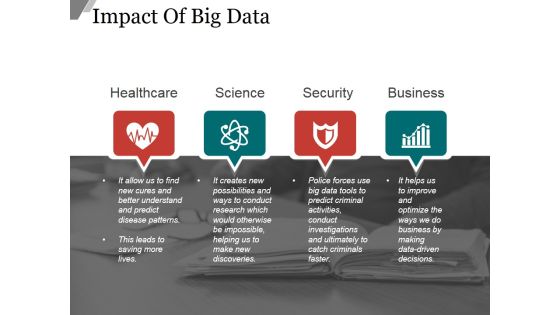
Impact Of Big Data Template Ppt PowerPoint Presentation Tips
This is a impact of big data template ppt powerpoint presentation tips. This is a six stage process. The stages in this process are sports predictions, easier commutes, smartphones, personalized advertising, presidential campaigns, advanced healthcare.

Example Of Data Journalism For Communication Ppt Powerpoint Layout
This is a example of data journalism for communication ppt powerpoint layout. This is a six stage process. The stages in this process are visualizer, narrate, socialise, humanise, personalise, utilise, communicate.

Big Data Market Forecast Ppt PowerPoint Presentation Information
This is a big data market forecast ppt powerpoint presentation information. This is a five stage process. The stages in this process are business, growth, strategy, timeline, planning, success.
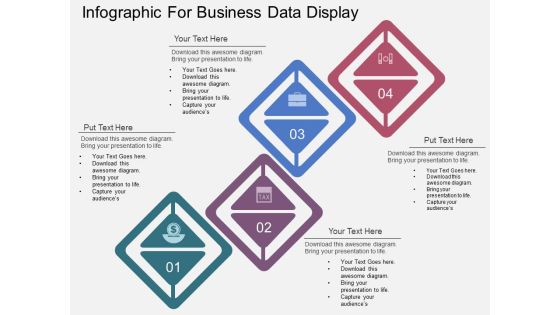
Four Steps Infographic For Business Data Display Powerpoint Template
This PowerPoint template has been designed with four steps infographic layout. This diagram can be used to display business data in visual manner. Capture the attention of your audience with this slide.

Data Migration Steps Ppt PowerPoint Presentation Slides Inspiration
This is a data migration steps ppt powerpoint presentation slides inspiration. This is a three stage process. The stages in this process are analysis stage, development stage, go live support stage, marketing, technology.

Data Science Capability And Interpretation Maturity Evaluation Model Download PDF
Presenting Data Science Capability And Interpretation Maturity Evaluation Model Download PDF to dispense important information. This template comprises five stages. It also presents valuable insights into the topics including Organization And Culture, Data And Technology, Ability To Ask Question. This is a completely customizable PowerPoint theme that can be put to use immediately. So, download it and address the topic impactfully. Presenting Data Science Capability And Interpretation Maturity Evaluation Model Download PDF to dispense important information. This template comprises five stages. It also presents valuable insights into the topics including Organization And Culture, Data And Technology, Ability To Ask Question. This is a completely customizable PowerPoint theme that can be put to use immediately. So, download it and address the topic impactfully.

Table Of Contents IT Professional Data Certification Program Microsoft PDF
This is a Table Of Contents IT Professional Data Certification Program Microsoft PDF template with various stages. Focus and dispense information on fifteen stages using this creative set, that comes with editable features. It contains large content boxes to add your information on topics like Certified Data Professional, Certified Information Systems, Microsoft Technology Associate. You can also showcase facts, figures, and other relevant content using this PPT layout. Grab it now.

Data Collection And Analysis Flow Chart Ppt PowerPoint Presentation Sample
This is a data collection and analysis flow chart ppt powerpoint presentation sample. This is a five stage process. The stages in this process are business, strategy, marketing, process, growth strategy, finance.
Busines Diagram Five Staged Dominoes For Data Representation Presentation Template
This business diagram displays graphics of five staged dominoes. Use this slide to represent your data in visual manner. This slide offers an excellent background to build professional presentations.
Busines Diagram Four Dominoes For Data Representation Presentation Template
This business diagram displays graphics of four staged dominoes. Use this slide to represent your data in visual manner. This slide offers an excellent background to build professional presentations.
Busines Diagram Six Staged Dominoes For Data Representation Presentation Template
This business diagram displays graphics of six staged dominoes. Use this slide to represent your data in visual manner. This slide offers an excellent background to build professional presentations.
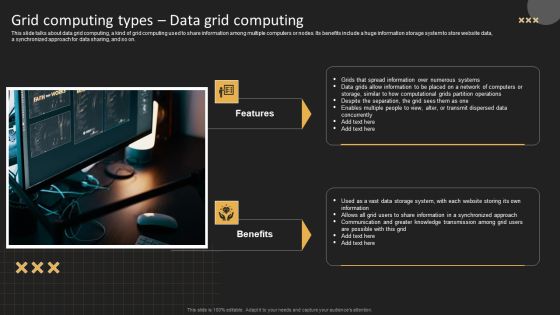
Grid Computing Types Data Grid Computing Clipart PDF
This slide talks about data grid computing, a kind of grid computing used to share information among multiple computers or nodes. Its benefits include a huge information storage system to store website data, a synchronized approach for data sharing, and so on. Slidegeeks is here to make your presentations a breeze with Grid Computing Types Data Grid Computing Clipart PDF With our easy to use and customizable templates, you can focus on delivering your ideas rather than worrying about formatting. With a variety of designs to choose from, you are sure to find one that suits your needs. And with animations and unique photos, illustrations, and fonts, you can make your presentation pop. So whether you are giving a sales pitch or presenting to the board, make sure to check out Slidegeeks first.
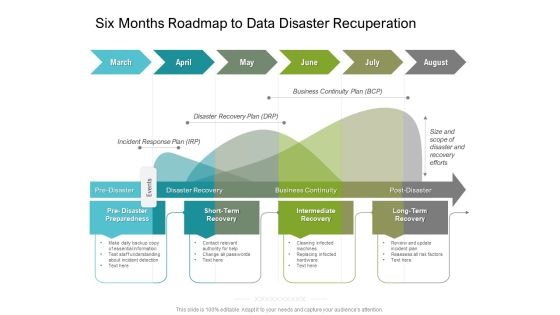
Six Months Roadmap To Data Disaster Recuperation Designs
We present our six months roadmap to data disaster recuperation designs. This PowerPoint layout is easy-to-edit so you can change the font size, font type, color, and shape conveniently. In addition to this, the PowerPoint layout is Google Slides compatible, so you can share it with your audience and give them access to edit it. Therefore, download and save this well-researched six months roadmap to data disaster recuperation designs in different formats like PDF, PNG, and JPG to smoothly execute your business plan.

Principles Of Data Architecture Ppt PowerPoint Presentation Outline Templates
This is a principles of data architecture ppt powerpoint presentation outline templates. This is a one stage process. The stages in this process are business, marketing, technology, computer, internet.

Collecting Consumer Qualitative Data For Personalized Marketing Template PDF
This slide showcases consumer qualitative data that can be collected to formulate personalized marketing campaign. It also shows ways to collect data from different sources Are you searching for a Collecting Consumer Qualitative Data For Personalized Marketing Template PDF that is uncluttered, straightforward, and original Its easy to edit, and you can change the colors to suit your personal or business branding. For a presentation that expresses how much effort you have put in, this template is ideal With all of its features, including tables, diagrams, statistics, and lists, its perfect for a business plan presentation. Make your ideas more appealing with these professional slides. Download Collecting Consumer Qualitative Data For Personalized Marketing Template PDF from Slidegeeks today.

ERP Implementation Process In Detail Data Ppt Pictures Maker PDF
The slide provides information about the ninth and tenth step migrate business data and prepare for the change that is involved in the ERP Implementation process that must be followed by the company in order to achieve the objectives of ERP Enterprise Resource Planning and in order to keep business up-to-date, streamline business processes, establish SOPs etc. This is a erp implementation process in detail data ppt pictures maker pdf template with various stages. Focus and dispense information on two stages using this creative set, that comes with editable features. It contains large content boxes to add your information on topics like product data, supplier data, customer, development. You can also showcase facts, figures, and other relevant content using this PPT layout. Grab it now.

Bar Graph For Marketing Research Data Powerpoint Slides
This PowerPoint template has been designed with diagram of bar graph. This PPT slide can be used to prepare presentations for profit growth report and also for financial data analysis. You can download finance PowerPoint template to prepare awesome presentations.

Data Science Process Model For Business Intelligence Infographics PDF
This slide highlights a framework of data science analysis to find patterns and using statistical techniques. It includes key components such as ideate, explore, model, validate, deploy and operate. Presenting Data Science Process Model For Business Intelligence Infographics PDF to dispense important information. This template comprises six stages. It also presents valuable insights into the topics including Operate, Deploy, Validate. This is a completely customizable PowerPoint theme that can be put to use immediately. So, download it and address the topic impactfully.
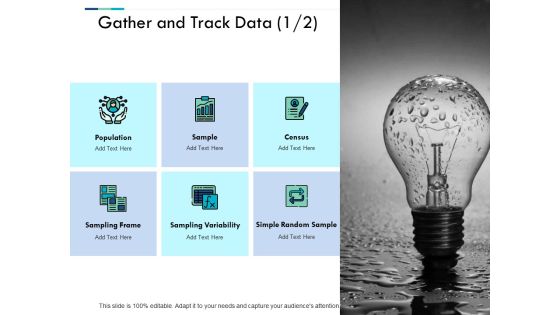
Gather And Track Data Ppt PowerPoint Presentation Layouts Graphics
This is a gather and track data ppt powerpoint presentation layouts graphics. This is a one stage process. The stages in this process are bulb, idea, technology, marketing, planning.

Best Practices For Effective Data Driven Marketing Microsoft PDF
This slide illustrates the best tactics to be adopted by marketers for effectively using customer data to make better and informed decisions to enhance customer experience. It includes data driven marketing best practices such as define marketing goals etc. Crafting an eye-catching presentation has never been more straightforward. Let your presentation shine with this tasteful yet straightforward Best Practices For Effective Data Driven Marketing Microsoft PDF template. It offers a minimalistic and classy look that is great for making a statement. The colors have been employed intelligently to add a bit of playfulness while still remaining professional. Construct the ideal Best Practices For Effective Data Driven Marketing Microsoft PDF that effortlessly grabs the attention of your audience Begin now and be certain to wow your customers

Big Data Analytics Comparison Technology Ppt Summary Rules PDF
This is a big data analytics comparison technology ppt summary rules pdf template with various stages. Focus and dispense information on two stages using this creative set, that comes with editable features. It contains large content boxes to add your information on topics like people user, comparison, audiences attention. You can also showcase facts, figures, and other relevant content using this PPT layout. Grab it now.

Agenda For Advanced Service Data Analysis Introduction PDF
This is a agenda for advanced service data analysis introduction pdf template with various stages. Focus and dispense information on five stages using this creative set, that comes with editable features. It contains large content boxes to add your information on topics like agenda for advanced service data analysis. You can also showcase facts, figures, and other relevant content using this PPT layout. Grab it now.

Hierarchy Of Data Models Sample Diagram Powerpoint Themes
This is a hierarchy of data models sample diagram powerpoint themes. This is a seven stage process. The stages in this process are company, department1, department2, department3, suppliers, employee, projects.
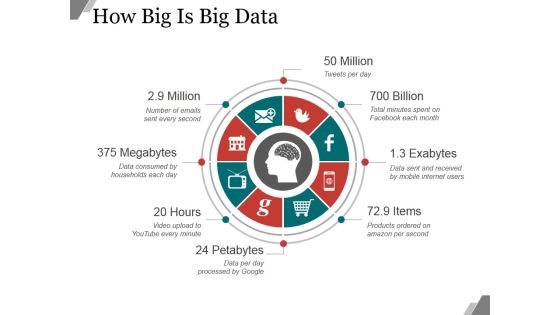
How Big Is Big Data Ppt PowerPoint Presentation Show
This is a how big is big data ppt powerpoint presentation show. This is a eight stage process. The stages in this process are million, billion, exabytes, items, petabytes.

data collection scatter diagram ppt powerpoint presentation inspiration
This is a data collection scatter diagram ppt powerpoint presentation inspiration. This is a three stage process. The stages in this process are business, planning, marketing, scatter diagram, finance.

Data Collection Preparation And Preprocessing Through Machine Learning Icons PDF
Once the insights are identified, data collection sources are selected for further predictive modeling. After that, dataset is prepared with a set of attributes representing behavior patterns related to customer engagement level for specific product or service. Presenting this PowerPoint presentation, titled Data Collection Preparation And Preprocessing Through Machine Learning Icons PDF, with topics curated by our researchers after extensive research. This editable presentation is available for immediate download and provides attractive features when used. Download now and captivate your audience. Presenting this Data Collection Preparation And Preprocessing Through Machine Learning Icons PDF. Our researchers have carefully researched and created these slides with all aspects taken into consideration. This is a completely customizable Data Collection Preparation And Preprocessing Through Machine Learning Icons PDF that is available for immediate downloading. Download now and make an impact on your audience. Highlight the attractive features available with our PPTs.

Roles And Responsibilities Of Data Driven Marketing Team Infographics PDF
This slide represents the roles and responsibilities performed by individuals in order to provide personalized and unique experience to customers and enhance enterprises ROI. It includes details related to roles and responsibilities of marketing data analyst, data scientist etc. Get a simple yet stunning designed Roles And Responsibilities Of Data Driven Marketing Team Infographics PDF. It is the best one to establish the tone in your meetings. It is an excellent way to make your presentations highly effective. So, download this PPT today from Slidegeeks and see the positive impacts. Our easy-to-edit Roles And Responsibilities Of Data Driven Marketing Team Infographics PDF can be your go-to option for all upcoming conferences and meetings. So, what are you waiting for Grab this template today.

Quarterly Hiring Process Flow Data Trends Infographics PDF
This slide illustrates funnel diagram and key data statistics regarding recruitment process. It includes visitors and prospects, applicants, shortlisted candidates etc. Persuade your audience using this Quarterly Hiring Process Flow Data Trends Infographics PDF. This PPT design covers five stages, thus making it a great tool to use. It also caters to a variety of topics including Applicants, Average, Key Statistics. Download this PPT design now to present a convincing pitch that not only emphasizes the topic but also showcases your presentation skills.

Competitive Advantage Of Big Data Sample Ppt Slides
This is a competitive advantage of big data sample ppt slides. This is a five stage process. The stages in this process are possible cost savings, continual innovation, visibility into causal relationship, potential revenue, more informed decision making, competitive advantage.
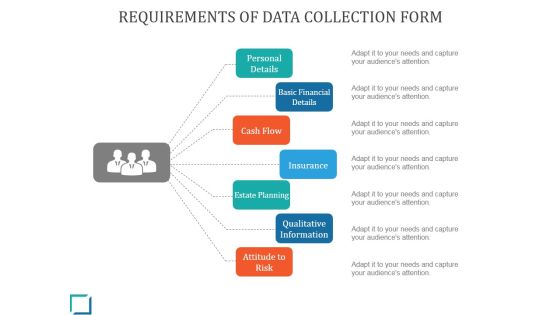
Requirements Of Data Collection Form Ppt PowerPoint Presentation Examples
This is a requirements of data collection form ppt powerpoint presentation examples. This is a seven stage process. The stages in this process are personal details, cash flow, insurance, estate planning, qualitative information.

Consultant Preparing Sales Customer Data Analysis Report Designs PDF
Persuade your audience using this consultant preparing sales customer data analysis report designs pdf. This PPT design covers four stages, thus making it a great tool to use. It also caters to a variety of topics including consultant preparing sales customer data analysis report. Download this PPT design now to present a convincing pitch that not only emphasizes the topic but also showcases your presentation skills.
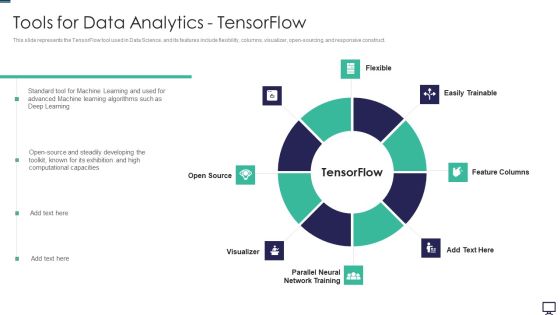
Tools For Data Analytics Tensorflow Ppt Model Rules PDF
This slide represents the TensorFlow tool used in Data Science, and its features include flexibility, columns, visualizer, open-sourcing, and responsive construct. Presenting tools for data analytics tensorflow ppt model rules pdf to provide visual cues and insights. Share and navigate important information on eight stages that need your due attention. This template can be used to pitch topics like developing, source. In addtion, this PPT design contains high resolution images, graphics, etc, that are easily editable and available for immediate download.

Big Data Market Forecast Ppt PowerPoint Presentation Portfolio Inspiration
This is a big data market forecast ppt powerpoint presentation portfolio inspiration. This is a five stage process. The stages in this process are business, growth, analysis, strategy, success.

Data Mining And Clustering Infographics Ppt PowerPoint Presentation Portfolio Elements
This is a data mining and clustering infographics ppt powerpoint presentation portfolio elements. This is a seven stage process. The stages in this process are cluster analysis, cluster examination, cluster investigation.

Benefits Of Big Data Ppt PowerPoint Presentation Example 2015
This is a benefits of big data ppt powerpoint presentation example 2015. This is a four stage process. The stages in this process are business, marketing, success, finance, analysis.

Pharmacy Information System Icon To Store Data Mockup PDF
Persuade your audience using this Pharmacy Information System Icon To Store Data Mockup PDF. This PPT design covers Three stages, thus making it a great tool to use. It also caters to a variety of topics including Pharmacy Information System, Icon To Store Data. Download this PPT design now to present a convincing pitch that not only emphasizes the topic but also showcases your presentation skills.

Consumer Marketing Data Template Powerpoint Slide Presentation Examples
This is a consumer marketing data template powerpoint slide presentation examples. This is a five stage process. The stages in this process are customer communications, promotional information, customer experiences, transactional information, marketing database.
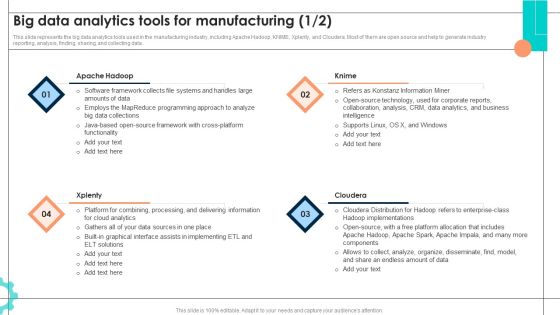
Intelligent Manufacturing Big Data Analytics Tools For Manufacturing Slides PDF
This slide represents the big data analytics tools used in the manufacturing industry, including Apache Hadoop, KNIME, Xplenty, and Cloudera. Most of them are open source and help to generate industry reporting, analysis, finding, sharing, and collecting data. Do you have to make sure that everyone on your team knows about any specific topic I yes, then you should give Intelligent Manufacturing Big Data Analytics Tools For Manufacturing Slides PDF a try. Our experts have put a lot of knowledge and effort into creating this impeccable Intelligent Manufacturing Big Data Analytics Tools For Manufacturing Slides PDF. You can use this template for your upcoming presentations, as the slides are perfect to represent even the tiniest detail. You can download these templates from the Slidegeeks website and these are easy to edit. So grab these today.

Information Studies Different Types Of Data Scientists Introduction PDF
This slide represents the different types of data scientists, including vertical experts, stat DS managers, generalists, legends, statisticians, ML engineers, and dabblers. Presenting Information Studies Different Types Of Data Scientists Introduction PDF to provide visual cues and insights. Share and navigate important information on seven stages that need your due attention. This template can be used to pitch topics like Vertical Experts, Star DS Manager, Generalists. In addtion, this PPT design contains high resolution images, graphics, etc, that are easily editable and available for immediate download.

 Home
Home