Data Governance

Four Steps Circular Infographic Powerpoint Templates
Our above slide contains diagram of three stage circular infographic. It helps to display global business analysis. Use this diagram to impart more clarity to data and to create more sound impact on viewers.
Four Circles Venn Diagram With Icons Powerpoint Slides
Four circles Venn diagram has been used to design this power point template. This PPT helps to portray the concept of business data analysis. Use this PPT for your business and marketing related presentations.
Two Circles Venn Diagram With Icons Powerpoint Slides
Venn diagram of two circles has been used to design this power point template. This PPT helps to portray the concept of business data analysis. Use this PPT for your business and marketing related presentations.

Curve Line Diagram With Icons Powerpoint Template
Our above slide contains diagram of curve line infographic. This infographic slide helps to exhibit business analysis. Use this diagram to impart more clarity to data and to create more sound impact on viewers.
Parts Of Marketing Plan Ppt Presentation
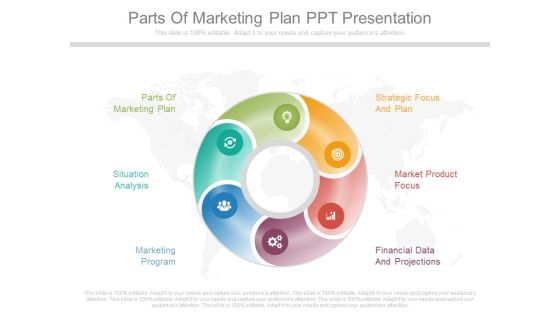
This is a parts of marketing plan ppt presentation. This is a six stage process. The stages in this process are parts of marketing plan, strategic focus and plan, situation analysis, market product focus, marketing program, financial data and projections.

Business Research Process Diagram Ppt Example
This is a business research process diagram ppt example. This is a five stage process. The stages in this process are business issues decision, analysis and reporting, data collection, questionnaire development, research objectives methodology.

Channel Strategy And Route To Market Ppt Powerpoint Guide
This is a channel strategy and route to market ppt powerpoint guide. This is a five stage process. The stages in this process are market and data analysis, trade interviews, channel identification, field audits, strategy development.

Organizational Effectiveness Model Powerpoint Slide Presentation
This is a organizational effectiveness model powerpoint slide presentation. This is a six stage process. The stages in this process are leadership, strategic planning, structure, human resources, business processes, data analysis, customer service and performance results.

Strategic Sourcing Implementation Ppt Presentation Pictures
This is a strategic sourcing implementation ppt presentation pictures. This is a seven stage process. The stages in this process are data collection and analysis, sensor supplier, resister supplier, connectors supplier, switches supplier, cable supplier, costumer.

Channel Strategy And Route To Market Ppt Presentation Deck
This is a channel strategy and route to market ppt presentation deck. This is a five stage process. The stages in this process are channel identification, market and data analysis, field audits, trade interviews, strategy development.

Colorful Bulb With Three Icons Powerpoint Templates
This PowerPoint slide contains graphics of bulb diagram with icons. It helps to exhibit concepts of sales planning. Use this diagram to impart more clarity to data and to create more sound impact on viewers.
Six Stage Bulb Infographic Diagram Powerpoint Templates
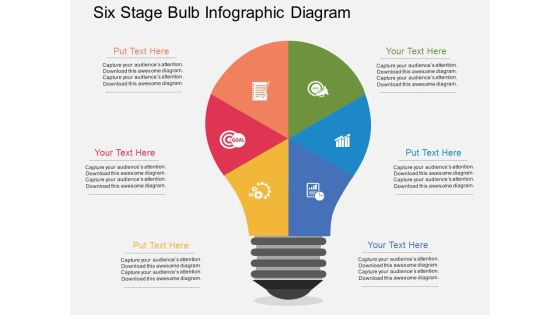
This PowerPoint slide contains graphics of bulb diagram with icons. It helps to exhibit concepts of marketing strategy. Use this diagram to impart more clarity to data and to create more sound impact on viewers.

Business Men On Gears Towards Success Trophy Powerpoint Templates
Our above slide contains diagram of business men on gears towards success trophy. It helps to exhibit strategy process and competition. Use this diagram to impart more clarity to data and to create more sound impact on viewers.

Arrow In Labyrinth Moving Towards Year 2016 Powerpoint Templates
Our above slide contains graphics of labyrinth with arrow on 2016 and globe. It helps to display concept of global business strategy. Use this diagram to impart more clarity to data and to create more sound impact on viewers.
Five Arrows Around Globe With Icons Powerpoint Templates
This PowerPoint slide contains graphics of five arrows around globe. It helps to exhibit concepts of global finance and business economics. Use this diagram to impart more clarity to data and to create more sound impact on viewers.
Infographic Banners With Bulb Target And Globe Icons Powerpoint Templates
Our above slide contains diagram of three banners. It also contains icons of bulb, target and globe. Use this diagram to impart more clarity to data and to create more sound impact on viewers.
Three Gears Steps For Innovative Process Powerpoint Template
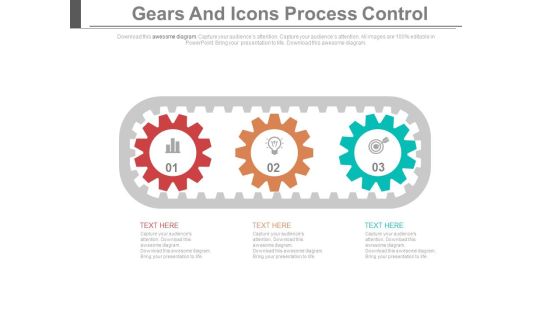
This PowerPoint slide contains graphics of three gears steps. It helps to exhibit innovative process steps. Use this diagram to impart more clarity to data and to create more sound impact on viewers.
Team Strategy And Gears Illustration Powerpoint Template
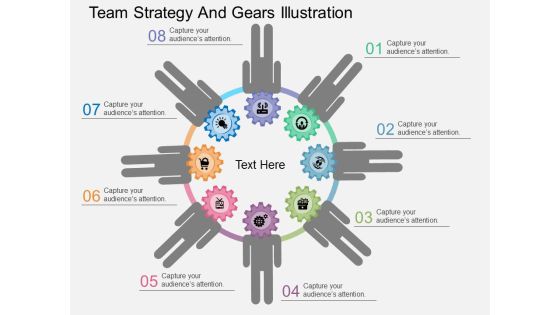
Our above PPT slide contains graphics of team gear icons in circular flow. This PowerPoint template may be used to depict team strategy. Use this diagram to impart more clarity to data and to create more sound impact on viewers.

Cylinder With Four Corporate Marketing Steps Powerpoint Template
Our above slide contains graphics of cylinder with four text tags. It may be used to display marketing steps. Use this diagram to impart more clarity to data and to create more sound impact on viewers.

Circles With Percentage Values Powerpoint Templates
This PowerPoint template displays circles with percentage values. This business diagram is suitable for financial data analysis. Use this business diagram slide to highlight the key issues of your presentation.
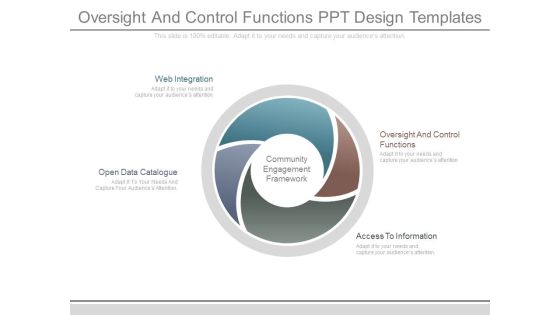
Oversight And Control Functions Ppt Design Templates
This is a oversight and control functions ppt design templates. This is a four stage process. The stages in this process are web integration, oversight and control functions, access to information, open data catalogue, community engagement framework.
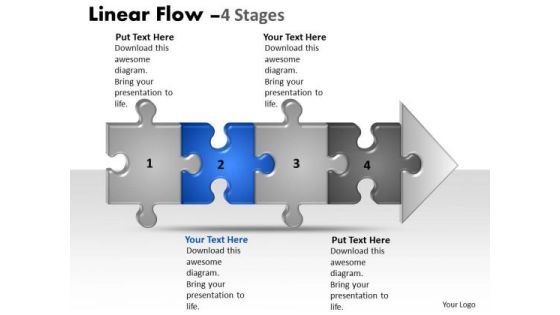
Usa Ppt Background Linear Flow 4 State Diagram Style1 Time Management PowerPoint 3 Design
USA PPT Background linear flow 4 state diagram style1 time management powerpoint 3 design-Linear flow diagram is a visual representation of the flow of data in an information system. Data flows are an important visualization tool to model processes.-USA PPT Background linear flow 4 state diagram style1 time management powerpoint 3 design-Arrow, Attached, Background, Business, Chain, Chart, Competition, Concepts, Connection, Diagram, Finance, Future, Graph, Growth, Ideas, Improvement, Investment, Isolated, Jigsaw, Making, Market, Money, Order, Partnership, Piece, Planning, Puzzle, Shape
Hands With Bulbs And Two Icons Powerpoint Template
Our above PPT slide contains graphics of hands holding idea bulbs. This business diagram helps to exhibit innovative ideas. Use this diagram to impart more clarity to data and to create more sound impact on viewers.

Arrows With Circles And Idea Bulb Powerpoint Template
Our above slide contains graphics of arrows with circles and idea bulb. It helps to display innovative ideas. Use this diagram to impart more clarity to data and to create more sound impact on viewers.

Profit Growth Graph With Gears Powerpoint Template
This business slide contains profit growth graph with gears. This PowerPoint template helps to display outline of business plan. Use this diagram to impart more clarity to data and to create more sound impact on viewers.

Abc Steps For Corporate Entrepreneurship Powerpoint Template
Our above PPT slide contains graphics of ABC steps chart. This business diagram helps to depict concept of corporate entrepreneurship. Use this diagram to impart more clarity to data and to create more sound impact on viewers.
Suitcase Infographic With Business Strategy Icons Powerpoint Template
This PowerPoint slide contains suitcase infographic with business strategy icons. It helps to exhibit concepts of business travel and meetings. Use this diagram to impart more clarity to data and to create more sound impact on viewers.
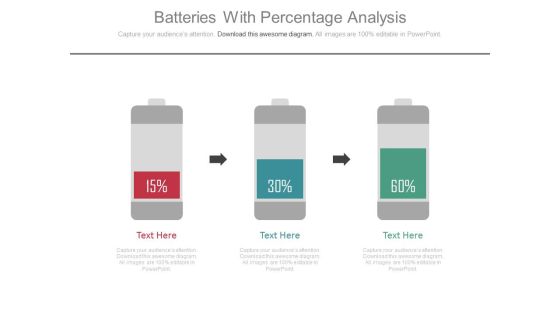
Three Batteries As Growth Steps Powerpoint Slides
This PowerPoint template has been designed with graphics of three batteries. Download this PPT slide for data comparisons or it may be used to display growth steps. Add this slide to your presentation and impress your superiors.
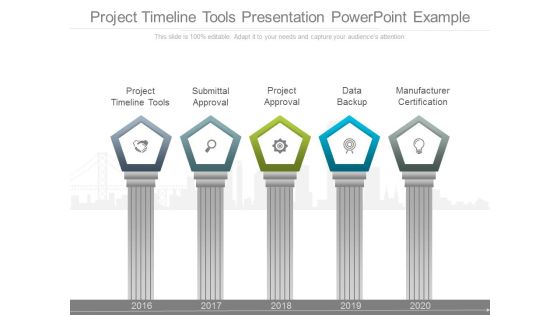
Project Timeline Tools Presentation Powerpoint Example
This is a project timeline tools presentation powerpoint example. This is a five stage process. The stages in this process are project timeline tools, submittal approval, project approval, data backup, manufacturer certification.

Choosing An Area Of Research Powerpoint Show
This is a choosing an area of research powerpoint show. This is a five stage process. The stages in this process are choosing an area of research, review of studies, sources of feedback, complete proposal, choosing method of data collection.
Coalescer Section Powerpoint Slides Design
This is a coalescer section powerpoint slides design. This is a six stage process. The stages in this process are data flow diagram, compressed air, coalescer section, fresh caustic prewash, jet fuel feed, spent caustic drain.

Jet Fuel Feed Powerpoint Slide Background Picture
This is a jet fuel feed powerpoint slide background picture. This is a six stage process. The stages in this process are data flow diagram, compressed air, coalesce section, fresh caustic prewash, jet fuel feed, spent caustic drain.

Sample Organizational Change Template Presentation Slides
This is a sample organizational change template presentation slides. This is a five stage process. The stages in this process are scope the change, create the vision, data commitment, establish change infra, sustain the change.

Future Of Ecommerce Diagram Ppt Example File
This is a future of ecommerce diagram ppt example file. This is a six stage process. The stages in this process are responsive design, rich functionalities, social media, omni channel, mobile, data segmentation.

Outputs And Methodology Example Of Ppt
This is a outputs and methodology example of ppt. This is a six stage process. The stages in this process are outputs and methodology, cautions and anomalies, jump starts, data checks and suggestions, learning moments, preliminary insights.
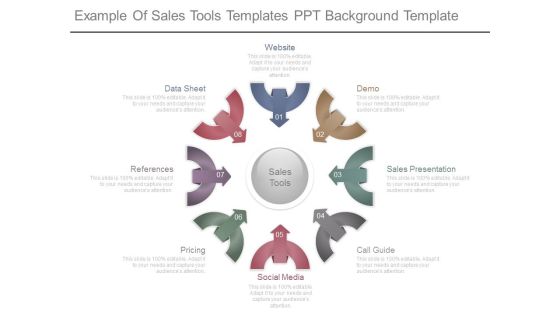
Example Of Sales Tools Templates Ppt Background Template
This is a example of sales tools templates ppt background template. This is a eight stage process. The stages in this process are sales tools, data sheet, references, pricing, social media, call guide, sales presentation, demo, website.

Investment Research Example Diagram Ppt Example File
This is a investment research example diagram ppt example file. This is a four stage process. The stages in this process are research reports, data and pricing, education, investment tools.
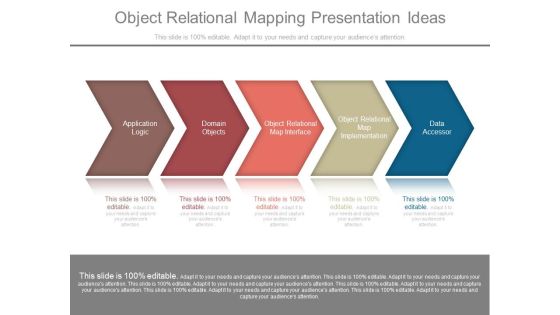
Object Relational Mapping Presentation Ideas
This is a object relational mapping presentation ideas. This is a five stage process. The stages in this process are application logic, domain objects, object relational map interface, object relational map implementation, data accessor.

Voicemail Phone Interaction Slide Background Picture
This is a voicemail phone interaction slide background picture. This is a four stage process. The stages in this process are online data sources, fax interaction, phone interaction, voicemail.
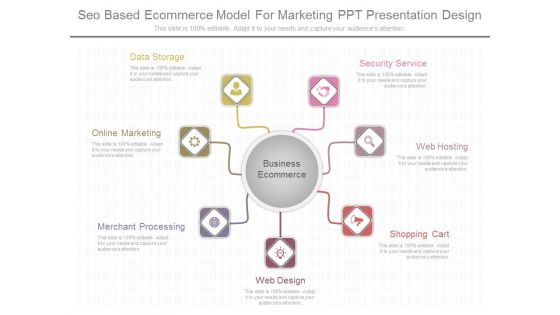
Seo Based Ecommerce Model For Marketing Ppt Presentation Design
This is a seo based ecommerce model for marketing ppt presentation design. This is a seven stage process. The stages in this process are security service, web hosting, shopping cart, web design, merchant processing, online marketing, data storage.

Digital Marketing Services Sample Diagram Ppt Images
This is a digital marketing services sample diagram ppt images. This is a eight stage process. The stages in this process are data science, display ppc, cro, email, social media, online articles, seo, mobile apps.

Customizable Dashboard Enhanced Analytics Powerpoint Slides
This is a customizable dashboard enhanced analytics powerpoint slides. This is a six stage process. The stages in this process are customizable dashboard, reports, real time updates, natural query, data warehouse, enhanced analytics.
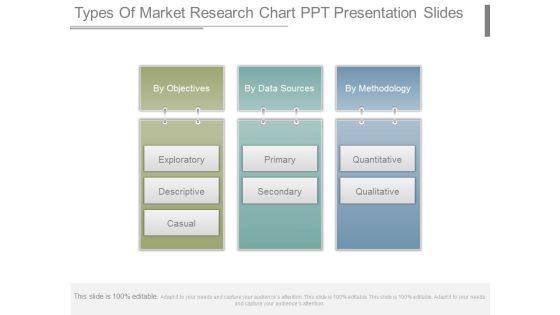
Types Of Market Research Chart Ppt Presentation Slides
This is a types of market research chart ppt presentation slides. This is a three stage process. The stages in this process are by objectives, exploratory, descriptive, causal, by data sources, primary, secondary, by methodology, quantitative, qualitative.

Architect Design And Solutions Diagram Powerpoint Slides
This is a architect design and solutions diagram powerpoint slides. This is a six stage process. The stages in this process are data safety, efficiently, speed, reliability, convenience, security.
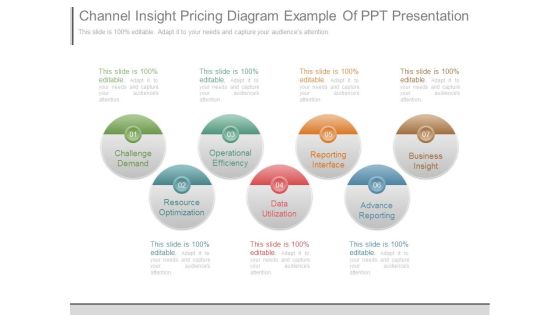
Channel Insight Pricing Diagram Example Of Ppt Presentation
This is a channel insight pricing diagram example of ppt presentation. This is a seven stage process. The stages in this process are challenge demand, operational efficiency, reporting interface, business insight, resource optimization, data utilization, advance reporting.
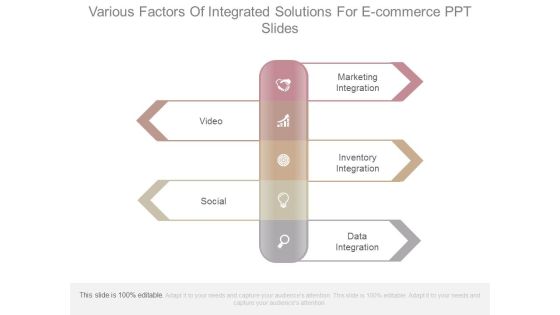
Various Factors Of Integrated Solutions For E Commerce Ppt Slides
This is a various factors of integrated solutions for e commerce ppt slides. This is a five stage process. The stages in this process are marketing integration, inventory integration, data integration, video, social.

Email Marketing Guide Chart Presentation Diagrams
This is a email marketing guide chart presentation diagrams. This is a eight stage process. The stages in this process are automated actions, return on investment, maximum response, consolation, data collection, delivery optimization, list building, contact development, email marketing.

Business Internet Retail Plan Layout Good Ppt Example
This is a business internet retail plan layout good ppt example. This is a seven stage process. The stages in this process are aim and strategies, internet marketing, business challenges, the evaluation, data foundation, insights, innovation.

B2b Integration Design Sample Diagram Example Ppt Presentation
This is a b2b integration design sample diagram example ppt presentation. This is a four stage process. The stages in this process are adapter, protocol conversion, interaction framework, data translation.

Analytics Solutions Diagram Sample Of Ppt Presentation
This is a analytics solutions diagram sample of ppt presentation. This is a four stage process. The stages in this process are analytic applications, analytics, data sources, business intelligence.

Basic Requirements For B2b Integration Ppt Powerpoint Templates Microsoft
This is a basic requirements for b2b integration ppt powerpoint templates microsoft. This is a five stage process. The stages in this process are worklist users, screen scraping, client users, data integration, trading partner.

Transaction Process Diagram Ppt Images Gallery
This is a transaction process diagram ppt images gallery. This is a five stage process. The stages in this process are data entry, tp batch online, database maintenance, document report generation, inquiry processing.

Board Strategic Planning Example Presentation Background Image
This is a board strategic planning example presentation background image. This is a eight stage process. The stages in this process are data retreat, propose goals, defind strategy, examine, share the plan, propose mission, visioning retreat, from the planning team.

Mainframe Accumulation Architecture Template Powerpoint Slide Backgrounds
This is a mainframe accumulation architecture template powerpoint slide backgrounds. This is a six stage process. The stages in this process are input, data sources, external systems, process, load and dispatch, user interface.

Trends In Sales Diagram Ppt Examples Slides
This is a trends in sales diagram ppt examples slides. This is a five stage process. The stages in this process are event roi, single platform, sales data and analytics, art of follow ups, mobility, trends in sales.
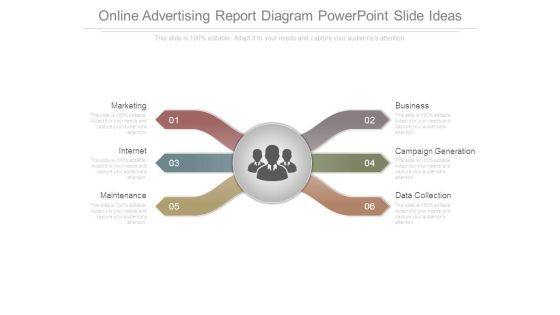
Online Advertising Report Diagram Powerpoint Slide Ideas
This is a online advertising report diagram powerpoint slide ideas. This is a six stage process. The stages in this process are marketing, internet, maintenance, business, campaign generation, data collection.

Customized Analytical Support Diagram Powerpoint Presentation Examples
This is a customized analytical support diagram powerpoint presentation examples. This is a four stage process. The stages in this process are scope and define the problem, data gathering and investigation, develop options, recommendation report.

Fiscal Planning Template Powerpoint Slides Templates
This is a fiscal planning template powerpoint slides templates. This is a six stage process. The stages in this process are evaluation, implementation, develop a plan, receive regular data report, responsibility accounting, steps in fiscal planning.
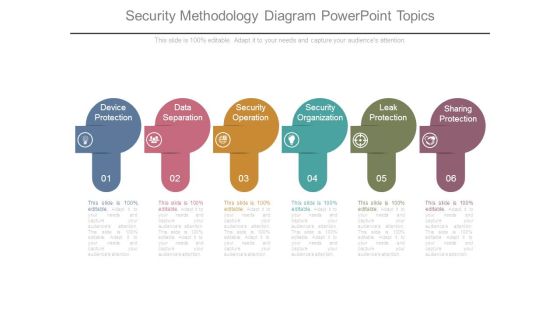
Security Methodology Diagram Powerpoint Topics
This is a security methodology diagram powerpoint topics. This is a six stage process. The stages in this process are device protection, data separation, security operation, security organization, leak protection, sharing protection.

Sample Of Teleselling Diagram Powerpoint Guide
This is a sample of teleselling diagram powerpoint guide. This is a six stage process. The stages in this process are lead generation, sales, appointment setting, data classing, customer surveys, event marketing.
 Home
Home