Data Governance Icon
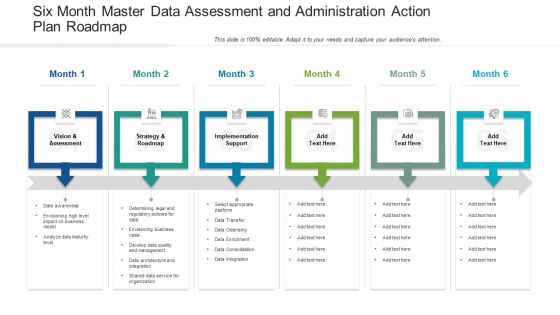
Six Month Master Data Assessment And Administration Action Plan Roadmap Portrait
Presenting our innovatively structured six month master data assessment and administration action plan roadmap portrait Template. Showcase your roadmap process in different formats like PDF, PNG, and JPG by clicking the download button below. This PPT design is available in both Standard Screen and Widescreen aspect ratios. It can also be easily personalized and presented with modified font size, font type, color, and shapes to measure your progress in a clear way.

Average Costing On Threats Management For Data Breach Incident Demonstration PDF
This slide covers total cost incurred on response of data breach incident. It includes four categories such as incident detection and escalation, notifications, post breach response, lost business cost ,etc. Pitch your topic with ease and precision using this Average Costing On Threats Management For Data Breach Incident Demonstration PDF. This layout presents information on Lost Business Cost, Detection And Escalation, Notification. It is also available for immediate download and adjustment. So, changes can be made in the color, design, graphics or any other component to create a unique layout.
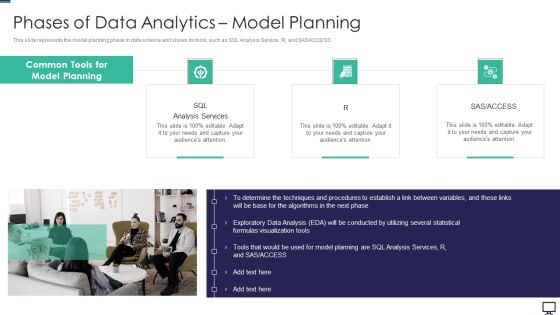
Phases Of Data Analytics Model Planning Ppt Pictures Format Ideas PDF
This slide represents the model planning phase in data science and shows its tools, such as SQL Analysis Service, R, and SAS or ACCESS. This is a phases of data analytics model planning ppt pictures format ideas pdf template with various stages. Focus and dispense information on one stages using this creative set, that comes with editable features. It contains large content boxes to add your information on topics like analysis services, planning. You can also showcase facts, figures, and other relevant content using this PPT layout. Grab it now.

Illustration Of 6 Data Processes And Flows Circular Spoke Chart PowerPoint Slides
We present our illustration of 6 data processes and flows Circular Spoke Chart PowerPoint Slides.Present our Arrows PowerPoint Templates because this slide helps you to communicate your concerns and educate your team along the path to success. Download our Process and Flows PowerPoint Templates because it Highlights the results of you thought process and convinces your team of the reasons for selecting a particular path to follow. Present our Business PowerPoint Templates because project your ideas to you colleagues and complete the full picture. Download our Shapes PowerPoint Templates because different personalities, different abilities but formidable together. Download and present our Circle Charts PowerPoint Templates because this slide shows each path to the smallest detail.Use these PowerPoint slides for presentations relating to Arrows, Background, Blue, Chart, Circle, Circular, Circulation, Color, Connection, Continuity, Cycle, Cyclic, Diagram, Direction, Empty, Flow, Four, Dimensional, Graph, Icon, Presentation, Process, Progress, Reason, Recycle, Recycling, Repetition, Report, Result, Ring, Rotation, Round, Scheme, Section, Step, Symbol, Teamwork. The prominent colors used in the PowerPoint template are Yellow, Gray, White. Professionals tell us our illustration of 6 data processes and flows Circular Spoke Chart PowerPoint Slides are Beautiful. You can be sure our Circulation PowerPoint templates and PPT Slides are Charming. Customers tell us our illustration of 6 data processes and flows Circular Spoke Chart PowerPoint Slides look good visually. Professionals tell us our Circle PowerPoint templates and PPT Slides are Endearing. People tell us our illustration of 6 data processes and flows Circular Spoke Chart PowerPoint Slides are Energetic. People tell us our Chart PowerPoint templates and PPT Slides are Breathtaking.
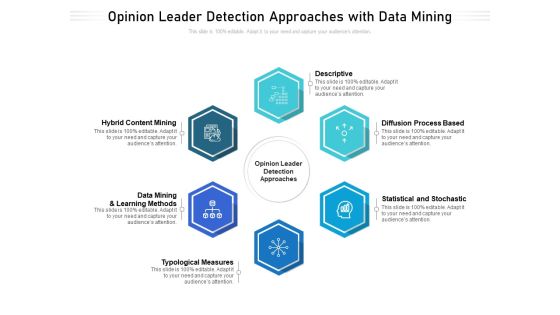
Opinion Leader Detection Approaches With Data Mining Ppt PowerPoint Presentation Gallery Background Image PDF
Presenting opinion leader detection approaches with data mining ppt powerpoint presentation gallery background image pdf to dispense important information. This template comprises six stages. It also presents valuable insights into the topics including descriptive, typological measures, statistical and stochastic. This is a completely customizable PowerPoint theme that can be put to use immediately. So, download it and address the topic impactfully.

Data Transfer Process With POC Validation Ppt PowerPoint Presentation Gallery Influencers PDF
Presenting data transfer process with poc validation ppt powerpoint presentation gallery influencers pdf to dispense important information. This template comprises four stages. It also presents valuable insights into the topics including analysis, planning, validation. This is a completely customizable PowerPoint theme that can be put to use immediately. So, download it and address the topic impactfully.
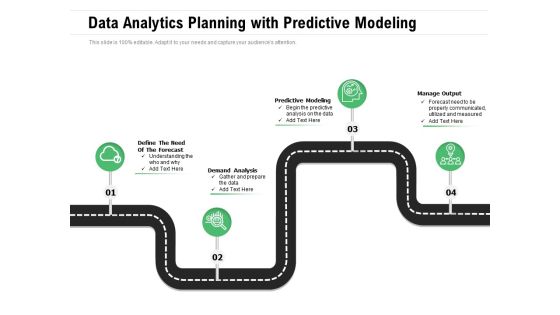
Data Analytics Planning With Predictive Modeling Ppt PowerPoint Presentation File Example Topics PDF
Presenting data analytics planning with predictive modeling ppt powerpoint presentation file example topics pdf to dispense important information. This template comprises four stages. It also presents valuable insights into the topics including analysis, communicated, predictive. This is a completely customizable PowerPoint theme that can be put to use immediately. So, download it and address the topic impactfully.

Data Center Infrastructure Technologies Comparison Between CPU And GPU Diagrams PDF
This slide depicts a comparison between CPU and GPU processing based on the number of cores, latency, processing, and hardware. If your project calls for a presentation, then Slidegeeks is your go-to partner because we have professionally designed, easy-to-edit templates that are perfect for any presentation. After downloading, you can easily edit Data Center Infrastructure Technologies Comparison Between CPU And GPU Diagrams PDF and make the changes accordingly. You can rearrange slides or fill them with different images. Check out all the handy templates.

Data Quality Measurement Dashboard With Various Parameters Ppt PowerPoint Presentation Show Smartart PDF
Showcasing this set of slides titled data quality measurement dashboard with various parameters ppt powerpoint presentation show smartart pdf. The topics addressed in these templates are parametera, quality index by category, quality measures, quality index. All the content presented in this PPT design is completely editable. Download it and make adjustments in color, background, font etc. as per your unique business setting.
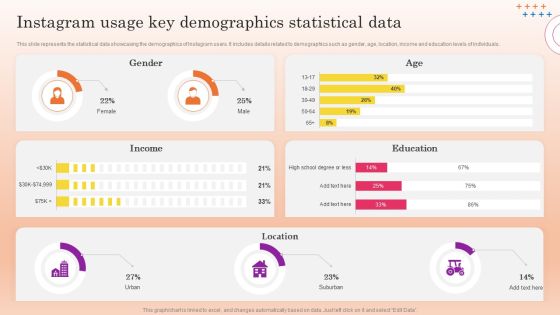
Instagram Marketing To Increase Instagram Usage Key Demographics Statistical Data Demonstration PDF
This slide represents the statistical data showcasing the demographics of Instagram users. It includes details related to demographics such as gender, age, location, income and education levels of individuals. Formulating a presentation can take up a lot of effort and time, so the content and message should always be the primary focus. The visuals of the PowerPoint can enhance the presenters message, so our Instagram Marketing To Increase Instagram Usage Key Demographics Statistical Data Demonstration PDF was created to help save time. Instead of worrying about the design, the presenter can concentrate on the message while our designers work on creating the ideal templates for whatever situation is needed. Slidegeeks has experts for everything from amazing designs to valuable content, we have put everything into Instagram Marketing To Increase Instagram Usage Key Demographics Statistical Data Demonstration PDF.
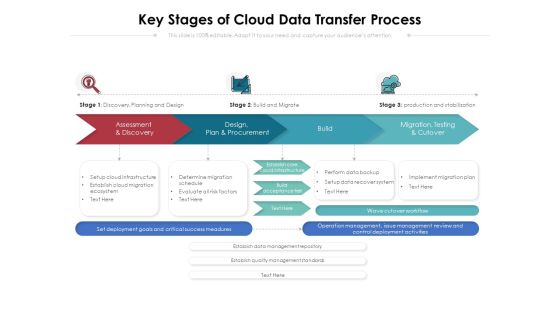
Key Stages Of Cloud Data Transfer Process Ppt PowerPoint Presentation File Good PDF
Presenting key stages of cloud data transfer process ppt powerpoint presentation file good pdf to dispense important information. This template comprises three stages. It also presents valuable insights into the topics including planning, design, stabilization. This is a completely customizable PowerPoint theme that can be put to use immediately. So, download it and address the topic impactfully.
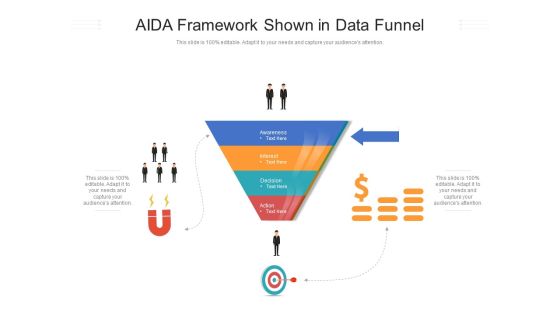
AIDA Framework Shown In Data Funnel Ppt PowerPoint Presentation Gallery Show PDF
Presenting aida framework shown in data funnel ppt powerpoint presentation gallery show pdf to dispense important information. This template comprises two stages. It also presents valuable insights into the topics including awareness, interest, decision. This is a completely customizable PowerPoint theme that can be put to use immediately. So, download it and address the topic impactfully.

Data Funnel With Convert And Engage Ppt PowerPoint Presentation Gallery Topics PDF
Presenting data funnel with convert and engage ppt powerpoint presentation gallery topics pdf to dispense important information. This template comprises four stages. It also presents valuable insights into the topics including reach, convert, engage. This is a completely customizable PowerPoint theme that can be put to use immediately. So, download it and address the topic impactfully.

Data ETL Process With Target System Ppt PowerPoint Presentation File Pictures PDF
Presenting data etl process with target system ppt powerpoint presentation file pictures pdf to dispense important information. This template comprises two stages. It also presents valuable insights into the topics including sources, process, target. This is a completely customizable PowerPoint theme that can be put to use immediately. So, download it and address the topic impactfully.

Data Transformation Process With Trial Migration Review Ppt PowerPoint Presentation Gallery Influencers PDF
Presenting data transformation process with trial migration review ppt powerpoint presentation gallery influencers pdf to dispense important information. This template comprises five stages. It also presents valuable insights into the topics including sources, migration, transformation. This is a completely customizable PowerPoint theme that can be put to use immediately. So, download it and address the topic impactfully.

Data Transformation Process With Evaluate Plan And Extract Ppt PowerPoint Presentation File Grid PDF
Presenting data transformation process with evaluate plan and extract ppt powerpoint presentation file grid pdf to dispense important information. This template comprises six stages. It also presents valuable insights into the topics including evaluate, plan, extract. This is a completely customizable PowerPoint theme that can be put to use immediately. So, download it and address the topic impactfully.
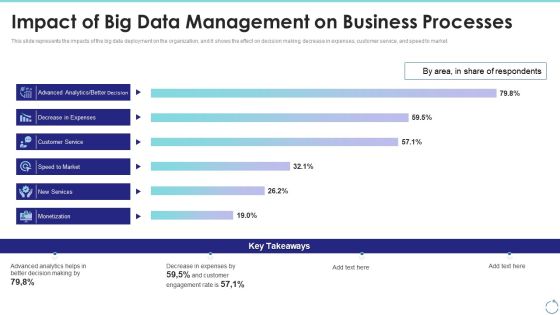
Impact Of Big Data Management On Business Processes Ppt Inspiration Gallery PDF
This slide represents the impacts of the big data deployment on the organization, and it shows the effect on decision making, decrease in expenses, customer service, and speed to market. Deliver and pitch your topic in the best possible manner with this impact of big data management on business processes ppt inspiration gallery pdf. Use them to share invaluable insights on analytics, customer, expenses, services and impress your audience. This template can be altered and modified as per your expectations. So, grab it now.

Impacts Of Big Data Management On Business Processes Ppt PowerPoint Presentation File Infographics PDF
This slide represents the impacts of the big data deployment on the organization, and it shows the effect on decision making, decrease in expenses, customer service, and speed to market. Deliver and pitch your topic in the best possible manner with this Impacts Of Big Data Management On Business Processes Ppt PowerPoint Presentation File Infographics PDF. Use them to share invaluable insights on Decision Making, Expenses, Customer Engagement Rate and impress your audience. This template can be altered and modified as per your expectations. So, grab it now.
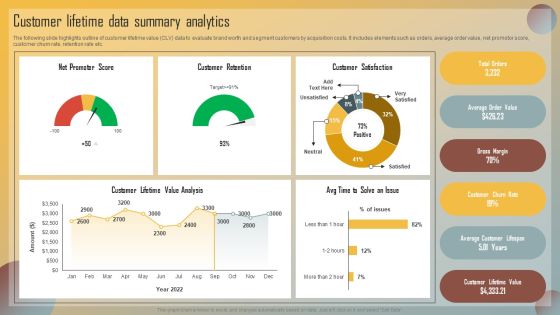
Guide For Marketing Analytics To Improve Decisions Customer Lifetime Data Summary Analytics Structure PDF
The following slide highlights outline of customer lifetime value CLV data to evaluate brand worth and segment customers by acquisition costs. It includes elements such as orders, average order value, net promotor score, customer churn rate, retention rate etc. Find a pre designed and impeccable Guide For Marketing Analytics To Improve Decisions Customer Lifetime Data Summary Analytics Structure PDF. The templates can ace your presentation without additional effort. You can download these easy to edit presentation templates to make your presentation stand out from others. So, what are you waiting for Download the template from Slidegeeks today and give a unique touch to your presentation.

Steps To Conduct Competitor Analysis Checklist To Gather Data For Competitor Analysis Themes PDF
The following slide highlights a checklist showing data to be collected to assess competitor effectively. It showcases elements such as product, price, place, promotion, positioning, people, partnership and reputation. Explore a selection of the finest Steps To Conduct Competitor Analysis Checklist To Gather Data For Competitor Analysis Themes PDF here. With a plethora of professionally designed and pre-made slide templates, you can quickly and easily find the right one for your upcoming presentation. You can use our Steps To Conduct Competitor Analysis Checklist To Gather Data For Competitor Analysis Themes PDF to effectively convey your message to a wider audience. Slidegeeks has done a lot of research before preparing these presentation templates. The content can be personalized and the slides are highly editable. Grab templates today from Slidegeeks.
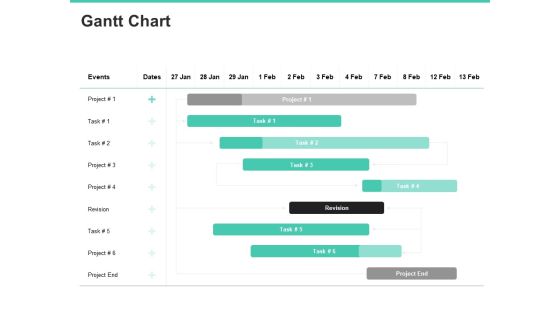
Email Security Encryption And Data Loss Prevention Gantt Chart Information PDF
Your complex projects can be managed and organized simultaneously using this detailed email security encryption and data loss prevention gantt chart information pdf template. Track the milestones, tasks, phases, activities, and subtasks to get an updated visual of your project. Share your planning horizon and release plan with this well-crafted presentation template. This exemplary template can be used to plot various dependencies to distinguish the tasks in the pipeline and their impact on the schedules and deadlines of the project. Apart from this, you can also share this visual presentation with your team members and stakeholders. It a resourceful tool that can be incorporated into your business structure. Therefore, download and edit it conveniently to add the data and statistics as per your requirement.

Statistical Analysis Of Parallel Data 7 Stages Fashion Business Plan PowerPoint Slides
We present our statistical analysis of parallel data 7 stages fashion business plan PowerPoint Slides.Download our Communication PowerPoint Templates because there is a key aspect to be emphasised. Present our Business PowerPoint Templates because watch the excitement levels rise as they realise their worth. Download our Arrows PowerPoint Templates because our PowerPoint templates designed for your ideas to sell. Download our Success PowerPoint Templates because your quest has taken you well onto the path of success. Download our Symbol PowerPoint Templates because they will Amplify your basic corporate concept and forefront the benefits of overlapping processes to arrive at common goals.Use these PowerPoint slides for presentations relating to 3d, Achievement, Action, Aim, Arrows, Black, Business, Color, Communication, Competition, Concept, Connection, Creative, Design, Different, Direction, Element, First, Forward, Graph, Graphic, Group, Growth, Higher, Icon, Illustration, Image, Isolated, Leader, Leadership, Line, Menu, Motion, Orange, Progress, Series, Seven, Sign, Slew, Solution, Success, Swerve, Symbol, Team, Teamwork, Turn, Up. The prominent colors used in the PowerPoint template are Blue, Gray, Black. Customers tell us our statistical analysis of parallel data 7 stages fashion business plan PowerPoint Slides are Awesome. Use our Business PowerPoint templates and PPT Slides will get their audience's attention. PowerPoint presentation experts tell us our statistical analysis of parallel data 7 stages fashion business plan PowerPoint Slides are Awesome. People tell us our Aim PowerPoint templates and PPT Slides are Sparkling. We assure you our statistical analysis of parallel data 7 stages fashion business plan PowerPoint Slides are Royal. People tell us our Black PowerPoint templates and PPT Slides are Detailed.
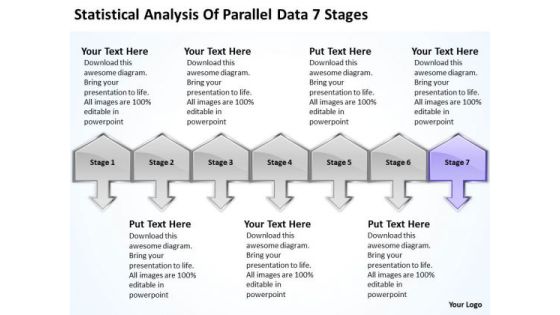
Statistical Analysis Of Parallel Data 7 Stages Ppt Help With Business Plan PowerPoint Slides
We present our statistical analysis of parallel data 7 stages ppt help with business plan PowerPoint Slides.Download and present our Communication PowerPoint Templates because You have gained great respect for your brilliant ideas. Use our PowerPoint Templates and Slides to strengthen and enhance your reputation. Present our Business PowerPoint Templates because you have developed a vision of where you want to be a few years from now. Use our Arrows PowerPoint Templates because this business powerpoint template helps expound on the logic of your detailed thought process to take your company forward. Download our Success PowerPoint Templates because iT outlines the entire thought process for the benefit of others. Tell it to the world with your characteristic aplomb. Use our Symbol PowerPoint Templates because this template helps you to bring your audiences to the table.Use these PowerPoint slides for presentations relating to 3d, Achievement, Action, Aim, Arrows, Black, Business, Color, Communication, Competition, Concept, Connection, Creative, Design, Different, Direction, Element, First, Forward, Graph, Graphic, Group, Growth, Higher, Icon, Illustration, Image, Isolated, Leader, Leadership, Line, Menu, Motion, Orange, Progress, Series, Seven, Sign, Slew, Solution, Success, Swerve, Symbol, Team, Teamwork, Turn, Up. The prominent colors used in the PowerPoint template are Purple, Gray, Black. Customers tell us our statistical analysis of parallel data 7 stages ppt help with business plan PowerPoint Slides will generate and maintain the level of interest you desire. They will create the impression you want to imprint on your audience. Use our Arrows PowerPoint templates and PPT Slides are Magnificent. PowerPoint presentation experts tell us our statistical analysis of parallel data 7 stages ppt help with business plan PowerPoint Slides will help them to explain complicated concepts. People tell us our Action PowerPoint templates and PPT Slides will make the presenter successul in his career/life. We assure you our statistical analysis of parallel data 7 stages ppt help with business plan PowerPoint Slides are Precious. People tell us our Aim PowerPoint templates and PPT Slides are Pleasant.
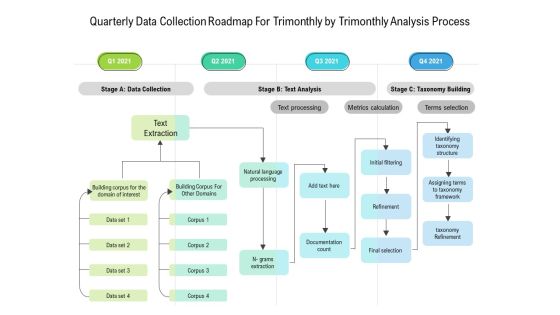
Quarterly Data Collection Roadmap For Trimonthly By Trimonthly Analysis Process Information
We present our quarterly data collection roadmap for trimonthly by trimonthly analysis process information. This PowerPoint layout is easy to edit so you can change the font size, font type, color, and shape conveniently. In addition to this, the PowerPoint layout is Google Slides compatible, so you can share it with your audience and give them access to edit it. Therefore, download and save this well researched quarterly data collection roadmap for trimonthly by trimonthly analysis process information in different formats like PDF, PNG, and JPG to smoothly execute your business plan.
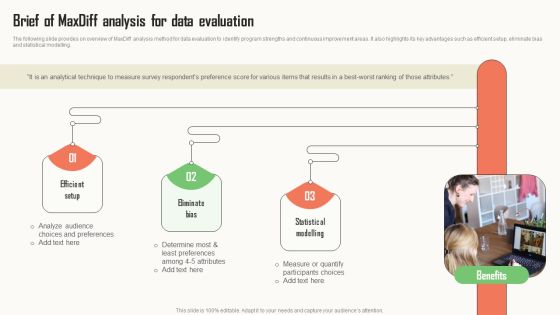
Strategic Market Insight Implementation Guide Brief Of Maxdiff Analysis For Data Evaluation Themes PDF
The following slide provides on overview of MaxDiff analysis method for data evaluation to identify program strengths and continuous improvement areas. It also highlights its key advantages such as efficient setup, eliminate bias and statistical modelling. Do you have to make sure that everyone on your team knows about any specific topic I yes, then you should give Strategic Market Insight Implementation Guide Brief Of Maxdiff Analysis For Data Evaluation Themes PDF a try. Our experts have put a lot of knowledge and effort into creating this impeccable Strategic Market Insight Implementation Guide Brief Of Maxdiff Analysis For Data Evaluation Themes PDF. You can use this template for your upcoming presentations, as the slides are perfect to represent even the tiniest detail. You can download these templates from the Slidegeeks website and these are easy to edit. So grab these today.

Classification Of Business Data Percentage Analysis Ppt PowerPoint Presentation Professional Visual Aids PDF
Presenting this set of slides with name classification of business data percentage analysis ppt powerpoint presentation professional visual aids pdf. The topics discussed in these slides are structured, internal, business systems. This is a completely editable PowerPoint presentation and is available for immediate download. Download now and impress your audience.
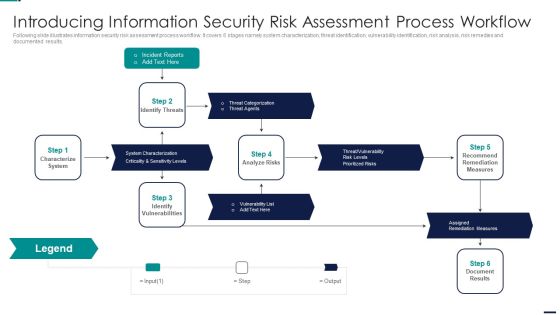
Risk Management Model For Data Introducing Information Security Risk Assessment Process Sample PDF
Following slide illustrates information security risk assessment process workflow. It covers 6 stages namely system characterization, threat identification, vulnerability identification, risk analysis, risk remedies and documented results. This is a Risk Management Model For Data Introducing Information Security Risk Assessment Process Sample PDF template with various stages. Focus and dispense information on five stages using this creative set, that comes with editable features. It contains large content boxes to add your information on topics like Incident Reports, Characterize System, Identify Vulnerabilities, Assigned Remediation Measures. You can also showcase facts, figures, and other relevant content using this PPT layout. Grab it now.

Rings Forming Structured Data 7 Stages Step By Business Plan Template PowerPoint Slides
We present our rings forming structured data 7 stages step by business plan template PowerPoint Slides.Use our Circle Charts PowerPoint Templates because They will Put your wonderful verbal artistry on display. Our PowerPoint Templates and Slides will provide you the necessary glam and glitter. Present our Shapes PowerPoint Templates because It will Give impetus to the hopes of your colleagues. Our PowerPoint Templates and Slides will aid you in winning their trust. Download and present our Signs PowerPoint Templates because Our PowerPoint Templates and Slides will let you Clearly mark the path for others to follow. Download and present our Maketing PowerPoint Templates because It will mark the footprints of your journey. Illustrate how they will lead you to your desired destination. Use our Metaphors-Visual Concepts PowerPoint Templates because Our PowerPoint Templates and Slides has conjured up a web of all you need with the help of our great team. Use them to string together your glistening ideas.Use these PowerPoint slides for presentations relating to diagram, circular, market, bar, advertise, interface, business, concept, vector, sign, success, presentation, symbol, template, circle, brochure, finance, data, description, report, marketing, title, label, abstract, management, graph, four, illustration, icon, pie, chart, strategy, catalog, research, web, design, growth, text, professional, banner, account, profit, information, background, info-graphic, analyze, financial, button, goals. The prominent colors used in the PowerPoint template are Blue, Blue light, White.

6 Step Approach For Data Protection Regulations Ppt PowerPoint Presentation Pictures Information PDF
Presenting 6 step approach for data protection regulations ppt powerpoint presentation pictures information pdf. to dispense important information. This template comprises six stages. It also presents valuable insights into the topics including prioritize, mapping, designate a driver, document, organize, manage risks. This is a completely customizable PowerPoint theme that can be put to use immediately. So, download it and address the topic impactfully.

Data Quality Assurance Balanced Scorecard Template With Consistency And Uniqueness Rules PDF
Deliver an awe inspiring pitch with this creative Data Quality Assurance Balanced Scorecard Template With Consistency And Uniqueness Rules PDF bundle. Topics like Completeness, Consistency, Quality Scorecard can be discussed with this completely editable template. It is available for immediate download depending on the needs and requirements of the user.

Data Driven Marketing Solutions Firm Company Profile Historical Revenue Professional PDF
The following slide highlights the historical revenue of Pureprofile from all of its operations. It also describes revenue CAGR and revenue growth over a time period of 6 years Formulating a presentation can take up a lot of effort and time, so the content and message should always be the primary focus. The visuals of the PowerPoint can enhance the presenters message, so our Data Driven Marketing Solutions Firm Company Profile Historical Revenue Professional PDF was created to help save time. Instead of worrying about the design, the presenter can concentrate on the message while our designers work on creating the ideal templates for whatever situation is needed. Slidegeeks has experts for everything from amazing designs to valuable content, we have put everything into Data Driven Marketing Solutions Firm Company Profile Historical Revenue Professional PDF

Ml And Big Data In Information Technology Processes Major Steps To Attain Aiops Excellence Summary PDF
Purpose of the following slide is to show key steps to attain excellence in the AI for IT operations these steps can be reactive phases proactive phase, expansion phase and establishment phase The Ml And Big Data In Information Technology Processes Major Steps To Attain Aiops Excellence Summary PDF is a compilation of the most recent design trends as a series of slides. It is suitable for any subject or industry presentation, containing attractive visuals and photo spots for businesses to clearly express their messages. This template contains a variety of slides for the user to input data, such as structures to contrast two elements, bullet points, and slides for written information. Slidegeeks is prepared to create an impression.

Four Quarter Organization Data Analysis Process Enhancement Best Practices Roadmap Demonstration
We present our four quarter organization data analysis process enhancement best practices roadmap demonstration. This PowerPoint layout is easy to edit so you can change the font size, font type, color, and shape conveniently. In addition to this, the PowerPoint layout is Google Slides compatible, so you can share it with your audience and give them access to edit it. Therefore, download and save this well researched four quarter organization data analysis process enhancement best practices roadmap demonstration in different formats like PDF, PNG, and JPG to smoothly execute your business plan.

Venn Diagram Data Driven Promotional Guide To Increase Return On Investment Brochure PDF
Whether you have daily or monthly meetings, a brilliant presentation is necessary. Venn Diagram Data Driven Promotional Guide To Increase Return On Investment Brochure PDF can be your best option for delivering a presentation. Represent everything in detail using Venn Diagram Data Driven Promotional Guide To Increase Return On Investment Brochure PDF and make yourself stand out in meetings. The template is versatile and follows a structure that will cater to your requirements. All the templates prepared by Slidegeeks are easy to download and edit. Our research experts have taken care of the corporate themes as well. So, give it a try and see the results.

Data Safety Initiatives Responsibility Matrix To Ensure Effective Risk Management Summary PDF
This slide portrays RACI matrix that company will use in order to ensure effective risks management. Here RACI stands for responsible, accountable, consulted and informed. Deliver and pitch your topic in the best possible manner with this data safety initiatives responsibility matrix to ensure effective risk management summary pdf. Use them to share invaluable insights on cybersecurity strategy and program phase, technical team, leadership and impress your audience. This template can be altered and modified as per your expectations. So, grab it now.

Categories Of Safety Audit To Reduce Data Risks Ppt PowerPoint Presentation Gallery Graphics Download PDF
Presenting categories of safety audit to reduce data risks ppt powerpoint presentation gallery graphics download pdf to dispense important information. This template comprises three stages. It also presents valuable insights into the topics including operational security, physical security, management security. This is a completely customizable PowerPoint theme that can be put to use immediately. So, download it and address the topic impactfully.
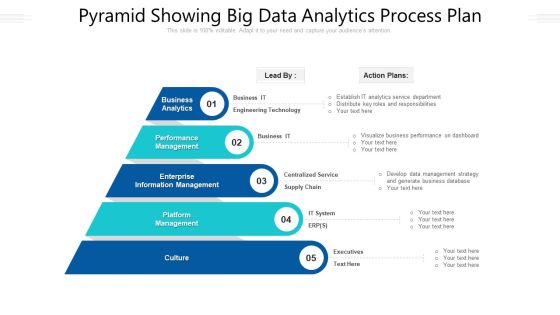
Pyramid Showing Big Data Analytics Process Plan Ppt PowerPoint Presentation File Ideas PDF
Presenting pyramid showing big data analytics process plan ppt powerpoint presentation file ideas pdf to dispense important information. This template comprises five stages. It also presents valuable insights into the topics including culture, management, performance. This is a completely customizable PowerPoint theme that can be put to use immediately. So, download it and address the topic impactfully.

Staff Worksheet Working Hours Data Assessment Chart Ppt PowerPoint Presentation Show Deck PDF
Presenting this set of slides with name staff worksheet working hours data assessment chart ppt powerpoint presentation show deck pdf. The topics discussed in these slides are public holidays, vacation, sick, regular, overtime. This is a completely editable PowerPoint presentation and is available for immediate download. Download now and impress your audience.

Optimizing Fiber Distributed Data Interface To Enhance Processes Structure Of A FDDI Network Demonstration PDF
This slide explains the structure of the FDDI network in which the network doesnt look like a circle although it follows a ring, it can include stars linked to hubs and trees of hubs. Find highly impressive Optimizing Fiber Distributed Data Interface To Enhance Processes Structure Of A FDDI Network Demonstration PDF on Slidegeeks to deliver a meaningful presentation. You can save an ample amount of time using these presentation templates. No need to worry to prepare everything from scratch because Slidegeeks experts have already done a huge research and work for you. You need to download Optimizing Fiber Distributed Data Interface To Enhance Processes Structure Of A FDDI Network Demonstration PDF for your upcoming presentation. All the presentation templates are 100 percent editable and you can change the color and personalize the content accordingly. Download now.
Flowchart Parallel Process 9 Stages Arrow Data Diagram Ppt PowerPoint Slides
We present our flowchart parallel process 9 stages arrow data diagram ppt PowerPoint Slides.Download and present our Business PowerPoint Templates because They will Put the wind in your sails. Skim smoothly over the choppy waters of the market. Download our Arrows PowerPoint Templates because Our PowerPoint Templates and Slides will let your ideas bloom. Create a bed of roses for your audience. Download and present our Shapes PowerPoint Templates because Our PowerPoint Templates and Slides offer you the widest possible range of options. Download our Success PowerPoint Templates because They will Put the wind in your sails. Skim smoothly over the choppy waters of the market. Download and present our Signs PowerPoint Templates because our PowerPoint Templates and Slides are the string of your bow. Fire of your ideas and conquer the podium.Use these PowerPoint slides for presentations relating to 3d, achievement, aim, arrows, business, career, chart, competition,development, direction, education, financial, forecast, forward, glossy, graph,group, growth, higher, icon, increase, investment, leader, leadership, moving,onwards, outlook, path, plan, prediction, price, profit, progress, property, race,sales, series, success, target, team, teamwork, turn, up, upwards, vector, win,winner. The prominent colors used in the PowerPoint template are Brown, Black, Gray. We assure you our flowchart parallel process 9 stages arrow data diagram ppt PowerPoint Slides are the best it can get when it comes to presenting. PowerPoint presentation experts tell us our business PowerPoint templates and PPT Slides are designed by professionals The feedback we get is that our flowchart parallel process 9 stages arrow data diagram ppt PowerPoint Slides will get their audience's attention. We assure you our aim PowerPoint templates and PPT Slides will help them to explain complicated concepts. PowerPoint presentation experts tell us our flowchart parallel process 9 stages arrow data diagram ppt PowerPoint Slides will save the presenter time. We assure you our aim PowerPoint templates and PPT Slides will impress their bosses and teams.
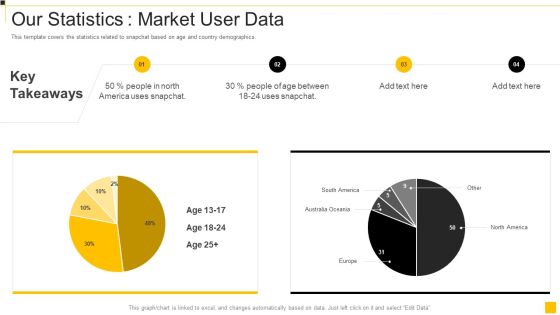
Snapchat Capital Investment Elevator Pitch Deck Our Statistics Market User Data Summary Pdf
This template covers the statistics related to snapchat based on age and country demographics. Deliver an awe inspiring pitch with this creative snapchat capital investment elevator pitch deck our statistics market user data summary pdf bundle. Topics like statistics, demographics, market can be discussed with this completely editable template. It is available for immediate download depending on the needs and requirements of the user.
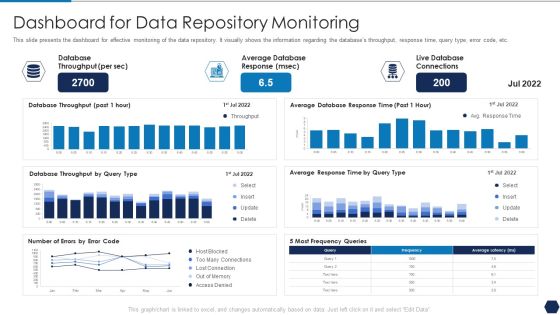
Tactical Plan For Upgrading DBMS Dashboard For Data Repository Monitoring Diagrams PDF
This slide presents the dashboard for effective monitoring of the data repository. It visually shows the information regarding the databases throughput, response time, query type, error code, etc. Deliver and pitch your topic in the best possible manner with this tactical plan for upgrading dbms dashboard for data repository monitoring diagrams pdf. Use them to share invaluable insights on database throughput, average database response, live database connections and impress your audience. This template can be altered and modified as per your expectations. So, grab it now.

Toolkit For Data Science And Analytics Transition Venn Diagram Diagrams PDF
This Toolkit For Data Science And Analytics Transition Venn Diagram Diagrams PDF is perfect for any presentation, be it in front of clients or colleagues. It is a versatile and stylish solution for organizing your meetings. The Toolkit For Data Science And Analytics Transition Venn Diagram Diagrams PDF features a modern design for your presentation meetings. The adjustable and customizable slides provide unlimited possibilities for acing up your presentation. Slidegeeks has done all the homework before launching the product for you. So, do not wait, grab the presentation templates today.

BPM System Methodology Data Flow Representation Of Business Modelling Pictures PDF
This slide covers technique based on flow of data to execute various business processes. The purpose of this slide is to present graphical or visual representation using a standardized set of symbols and notations to explain several businesss operations through data movement. It includes elements such as flow of information between external entities including customer order and payment record database, etc. This modern and well-arranged BPM System Methodology Data Flow Representation Of Business Modelling Pictures PDF provides lots of creative possibilities. It is very simple to customize and edit with the Powerpoint Software. Just drag and drop your pictures into the shapes. All facets of this template can be edited with Powerpoint, no extra software is necessary. Add your own material, put your images in the places assigned for them, adjust the colors, and then you can show your slides to the world, with an animated slide included.

Chart Of Business Function With Customers Data Analysis Ppt PowerPoint Presentation File Slides PDF
Pitch your topic with ease and precision using this chart of business function with customers data analysis ppt powerpoint presentation file slides pdf. This layout presents information on financial, business, strategy. It is also available for immediate download and adjustment. So, changes can be made in the color, design, graphics or any other component to create a unique layout.
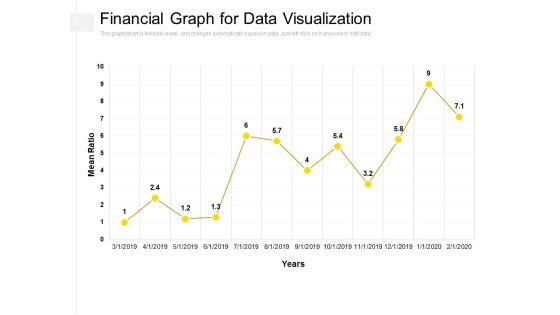
Financial Graph For Data Visualization Ppt PowerPoint Presentation Slides Picture PDF
Presenting this set of slides with name financial graph for data visualization ppt powerpoint presentation slides picture pdf. The topics discussed in these slides are mean ration, year. This is a completely editable PowerPoint presentation and is available for immediate download. Download now and impress your audience.
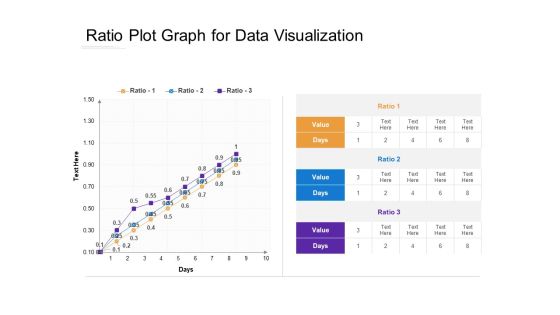
Ratio Plot Graph For Data Visualization Ppt PowerPoint Presentation Ideas Outfit PDF
Presenting this set of slides with name ratio plot graph for data visualization ppt powerpoint presentation ideas outfit pdf. The topics discussed in these slides are ratio, value, days. This is a completely editable PowerPoint presentation and is available for immediate download. Download now and impress your audience.

Deploying B2B Advertising Techniques For Lead Generation Statistical Data To Analyze Need Enhancing Graphics PDF
This slide covers need of optimizing demand generation strategies by analyzing statistical data. It involves optimizing right techniques, aligning content with customer journey. Whether you have daily or monthly meetings, a brilliant presentation is necessary. Deploying B2B Advertising Techniques For Lead Generation Statistical Data To Analyze Need Enhancing Graphics PDF can be your best option for delivering a presentation. Represent everything in detail using Deploying B2B Advertising Techniques For Lead Generation Statistical Data To Analyze Need Enhancing Graphics PDF and make yourself stand out in meetings. The template is versatile and follows a structure that will cater to your requirements. All the templates prepared by Slidegeeks are easy to download and edit. Our research experts have taken care of the corporate themes as well. So, give it a try and see the results.
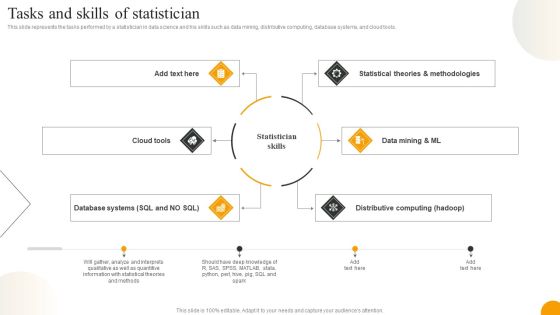
Using Data Science Technologies For Business Transformation Tasks And Skills Of Statistician Diagrams PDF
This slide represents the tasks performed by a statistician in data science and his skills such as data mining, distributive computing, database systems, and cloud tools. This modern and well arranged Using Data Science Technologies For Business Transformation Tasks And Skills Of Statistician Diagrams PDF provides lots of creative possibilities. It is very simple to customize and edit with the Powerpoint Software. Just drag and drop your pictures into the shapes. All facets of this template can be edited with Powerpoint no extra software is necessary. Add your own material, put your images in the places assigned for them, adjust the colors, and then you can show your slides to the world, with an animated slide included.

Key Initiatives And Impact On Business Deploying Data Lineage IT Themes PDF
This slide represents the essential open-source data lineage tools to trace data modifications at each step and get the most value from the information. The tools include Tokern, TrueDat, Pachyderm, OpenLineage, and Egeria.Slidegeeks has constructed Key Initiatives And Impact On Business Deploying Data Lineage IT Themes PDF after conducting extensive research and examination. These presentation templates are constantly being generated and modified based on user preferences and critiques from editors. Here, you will find the most attractive templates for a range of purposes while taking into account ratings and remarks from users regarding the content. This is an excellent jumping-off point to explore our content and will give new users an insight into our top-notch PowerPoint Templates.
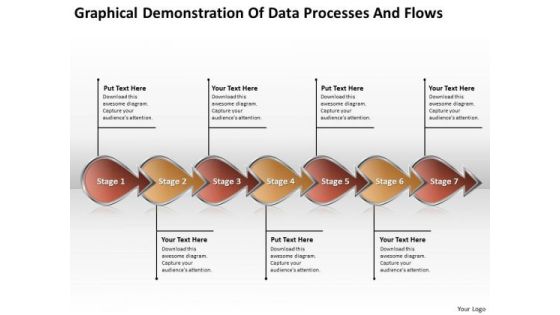
Graphical Demonstration Of Data Processes And Flows Circuit Drawing PowerPoint Slides
We present our graphical demonstration of data processes and flows circuit drawing PowerPoint Slides.Use our Arrows PowerPoint Templates because you can outline your targets to your team. Present our Business PowerPoint Templates because you can Lead your flock steadily to greater heights. Look around at the vast potential of achievement around you. Download our Shapes PowerPoint Templates because our PowerPoint templates designed for your ideas to sell. Download our Marketing PowerPoint Templates because networking is an imperative in todays world. You need to access the views of others. Similarly you need to give access to them of your abilities. Download our Process and Flows PowerPoint Templates because you can Churn the wheels of the brains of your colleagues.Use these PowerPoint slides for presentations relating to Arrow, Arrows, Block, Business, Chart, Design, Development, Diagram, Direction, Element, Flow, Flowchart, Graph, Linear, Management, Organization, Process, Program, Section, Sign, Solution, Symbol. The prominent colors used in the PowerPoint template are Red, Yellow, Black. Customers tell us our graphical demonstration of data processes and flows circuit drawing PowerPoint Slides are Stunning. The feedback we get is that our Development PowerPoint templates and PPT Slides are Royal. Professionals tell us our graphical demonstration of data processes and flows circuit drawing PowerPoint Slides are Sparkling. People tell us our Design PowerPoint templates and PPT Slides are Amazing. Customers tell us our graphical demonstration of data processes and flows circuit drawing PowerPoint Slides are Lush. Professionals tell us our Development PowerPoint templates and PPT Slides are Pleasant.

Actual Time Marketing Data Analysis Ppt PowerPoint Presentation Gallery Pictures PDF
The slide exhibits the evaluation of real-time marketing data to assess the program performance. Various KPIs included are planned and actual budget, real-time marketing benefits and year-wise budget allocation. Showcasing this set of slides titled Actual Time Marketing Data Analysis Ppt PowerPoint Presentation Gallery Pictures PDF. The topics addressed in these templates are Planned, Actual Budget, Budget Allocation, Real Time Marketing, Benefits. All the content presented in this PPT design is completely editable. Download it and make adjustments in color, background, font etc. as per your unique business setting.
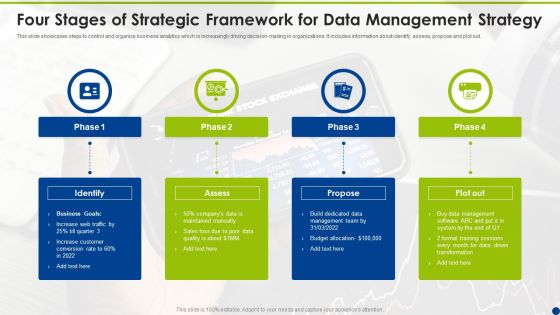
Four Stages Of Strategic Framework For Data Management Strategy Ppt Outline Samples PDF
This slide showcases steps to control and organize business analytics which is increasingly driving decision-making in organizations. It includes information about identify, assess, propose and plot out. Presenting Four Stages Of Strategic Framework For Data Management Strategy Ppt Outline Samples PDF to dispense important information. This template comprises four stages. It also presents valuable insights into the topics including Management Team, Business Goals, Increase Customer. This is a completely customizable PowerPoint theme that can be put to use immediately. So, download it and address the topic impactfully.

Website Analytics Dashboard For Consumer Data Insights Ppt PowerPoint Presentation File Slides PDF
This slide showcases dashboard for website analytics that can help organization to gather data about visitors and formulate targeted marketing campaigns. It can also help to make individual and group buyer personas. If you are looking for a format to display your unique thoughts, then the professionally designed Website Analytics Dashboard For Consumer Data Insights Ppt PowerPoint Presentation File Slides PDF is the one for you. You can use it as a Google Slides template or a PowerPoint template. Incorporate impressive visuals, symbols, images, and other charts. Modify or reorganize the text boxes as you desire. Experiment with shade schemes and font pairings. Alter, share or cooperate with other people on your work. Download Website Analytics Dashboard For Consumer Data Insights Ppt PowerPoint Presentation File Slides PDF and find out how to give a successful presentation. Present a perfect display to your team and make your presentation unforgettable.

Data Center Relocation Implementation Quarterly Roadmap Ppt Infographic Template Portfolio PDF
Introducing our data center relocation implementation quarterly roadmap ppt infographic template portfolio pdf. This PPT presentation is Google Slides compatible, therefore, you can share it easily with the collaborators for measuring the progress. Also, the presentation is available in both standard screen and widescreen aspect ratios. So edit the template design by modifying the font size, font type, color, and shapes as per your requirements. As this PPT design is fully editable it can be presented in PDF, JPG and PNG formats.

Data Center Relocation Quarterly Roadmap For Saving Operation Cost Microsoft PDF
Introducing our data center relocation quarterly roadmap for saving operation cost microsoft pdf. This PPT presentation is Google Slides compatible, therefore, you can share it easily with the collaborators for measuring the progress. Also, the presentation is available in both standard screen and widescreen aspect ratios. So edit the template design by modifying the font size, font type, color, and shapes as per your requirements. As this PPT design is fully editable it can be presented in PDF, JPG and PNG formats.
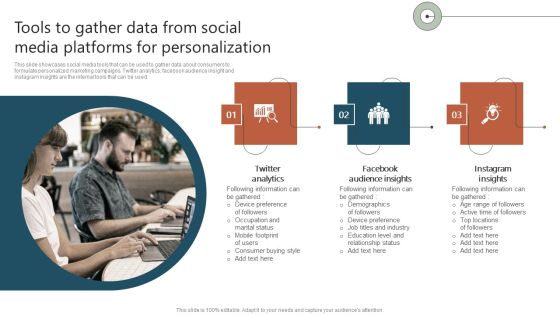
Tools To Gather Data From Social Media Platforms For Personalization Ppt Infographic Template Information PDF
This slide showcases social media tools that can be used to gather data about consumers to formulate personalized marketing campaigns. Twitter analytics, facebook audience insight and instagram insights are the internal tools that can be used. If you are looking for a format to display your unique thoughts, then the professionally designed Tools To Gather Data From Social Media Platforms For Personalization Ppt Infographic Template Information PDF is the one for you. You can use it as a Google Slides template or a PowerPoint template. Incorporate impressive visuals, symbols, images, and other charts. Modify or reorganize the text boxes as you desire. Experiment with shade schemes and font pairings. Alter, share or cooperate with other people on your work. Download Tools To Gather Data From Social Media Platforms For Personalization Ppt Infographic Template Information PDF and find out how to give a successful presentation. Present a perfect display to your team and make your presentation unforgettable.

Data Semantic Chart With Comments Ppt PowerPoint Presentation Gallery Aids PDF
Pitch your topic with ease and precision using this data semantic chart with comments ppt powerpoint presentation gallery aids pdf. This layout presents information on readable, understandable, precise, reliable, useful, sufficient. It is also available for immediate download and adjustment. So, changes can be made in the color, design, graphics or any other component to create a unique layout.

Data Driven Marketing Solutions Firm Company Profile Operational Kpis Graphics PDF
The following slide showcases the business operations KPI to illustrate the performance of the organization. The KPIs include YOY growth, repeat clients revenue, survey completion growth, client growth, and incentives earned. Are you searching for a Data Driven Marketing Solutions Firm Company Profile Operational Kpis Graphics PDF that is uncluttered, straightforward, and original Its easy to edit, and you can change the colors to suit your personal or business branding. For a presentation that expresses how much effort you have put in, this template is ideal. With all of its features, including tables, diagrams, statistics, and lists, its perfect for a business plan presentation. Make your ideas more appealing with these professional slides. Download Data Driven Marketing Solutions Firm Company Profile Operational Kpis Graphics PDF from Slidegeeks today.

Intelligent Manufacturing Global Big Data Analytics In Manufacturing Industry Market Structure PDF
This slide describes the global big data analytics in the manufacturing industry market, including CAGR rate, North Americas share in the market, year-over-year growth, market value in 2020, and growth of the solution category by 2028. Formulating a presentation can take up a lot of effort and time, so the content and message should always be the primary focus. The visuals of the PowerPoint can enhance the presenters message, so our Intelligent Manufacturing Global Big Data Analytics In Manufacturing Industry Market Structure PDF was created to help save time. Instead of worrying about the design, the presenter can concentrate on the message while our designers work on creating the ideal templates for whatever situation is needed. Slidegeeks has experts for everything from amazing designs to valuable content, we have put everything into Intelligent Manufacturing Global Big Data Analytics In Manufacturing Industry Market Structure PDF
 Home
Home