Data Governance Icon

Application Cloud Data Transformation Summary Dashboard Mockup PDF
This slide illustrates application data migration summary dashboard. It provides information about most recently updated applications, applications by migration status, migrated applications over time, etc. Showcasing this set of slides titled Application Cloud Data Transformation Summary Dashboard Mockup PDF. The topics addressed in these templates are Application Migration Status, Number Applications, Most Recently Updated. All the content presented in this PPT design is completely editable. Download it and make adjustments in color, background, font etc. as per your unique business setting.
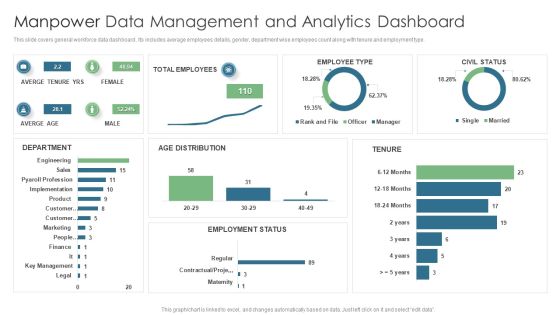
Manpower Data Management And Analytics Dashboard Topics PDF
This slide covers general workforce data dashboard . Its includes average employees details, gender, department wise employees count along with tenure and employment type. Pitch your topic with ease and precision using this Manpower Data Management And Analytics Dashboard Topics PDF. This layout presents information on Total Employees, Averge Tenure Yrs, Employee Type. It is also available for immediate download and adjustment. So, changes can be made in the color, design, graphics or any other component to create a unique layout.
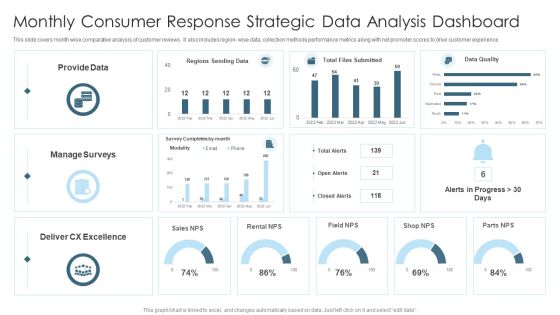
Monthly Consumer Response Strategic Data Analysis Dashboard Graphics PDF
This slide covers month wise comparative analysis of customer reviews . It also includes region wise data, collection methods performance metrics along with net promoter scores to drive customer experience. Showcasing this set of slides titled Monthly Consumer Response Strategic Data Analysis Dashboard Graphics PDF. The topics addressed in these templates are Provide Data, Sales, Manage Surveys. All the content presented in this PPT design is completely editable. Download it and make adjustments in color, background, font etc. as per your unique business setting.

Information Studies Phases Of Data Science Operationalize Pictures PDF
This slide describes the operational phase of data science and what tasks are performed in this phase, such as deliver final reports, pilot project implementation, and how it will be helpful in monitoring performance. This is a Information Studies Phases Of Data Science Operationalize Pictures PDF template with various stages. Focus and dispense information on three stages using this creative set, that comes with editable features. It contains large content boxes to add your information on topics like Technical Documents, Implemented, Production Platform. You can also showcase facts, figures, and other relevant content using this PPT layout. Grab it now.
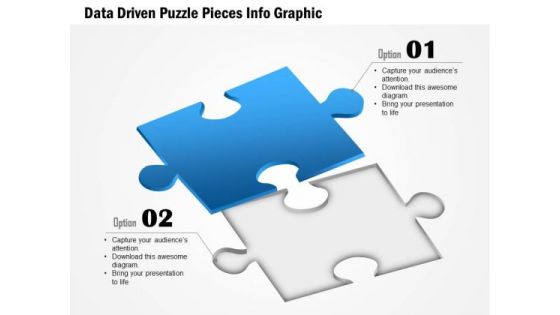
Business Diagram Data Driven Puzzle Pieces Info Graphic Presentation Template
Our above diagram provides data driven puzzle info graphic. This slide contains diagram of puzzle pieces depicting concepts like innovation strategy, research, solution, management and teamwork. Download this diagram to make professional presentations.

Information Studies Phases Of Data Science Communicate Results Structure PDF
This slide defines the last phase of the data science, which is communicated results, and, in this phase, all the key findings are communicated to stakeholders to know if the project is a success or not. Presenting Information Studies Phases Of Data Science Communicate Results Structure PDF to provide visual cues and insights. Share and navigate important information on three stages that need your due attention. This template can be used to pitch topics like Goals, Project. In addtion, this PPT design contains high resolution images, graphics, etc, that are easily editable and available for immediate download.
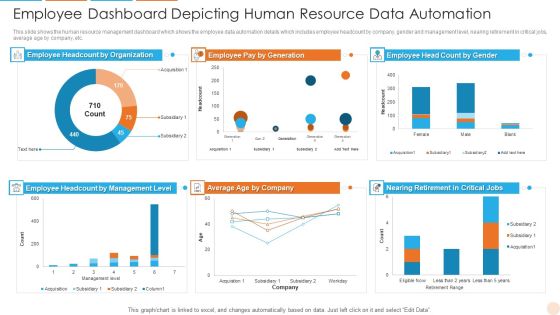
Employee Dashboard Depicting Human Resource Data Automation Professional PDF
This slide shows the human resource management dashboard which shows the employee data automation details which includes employee headcount by company, gender and management level, nearing retirement in critical jobs, average age by company, etc. Showcasing this set of slides titled Employee Dashboard Depicting Human Resource Data Automation Professional PDF. The topics addressed in these templates are Employee Dashboard Depicting Human Resource Data Automation. All the content presented in this PPT design is completely editable. Download it and make adjustments in color, background, font etc. as per your unique business setting.

Hierarchy Of Data Models Sample Diagram Powerpoint Themes
This is a hierarchy of data models sample diagram powerpoint themes. This is a seven stage process. The stages in this process are company, department1, department2, department3, suppliers, employee, projects.

30 60 90 Days Plan For Data Lake Diagrams PDF
This slide describes the 30 60 90 days plan for the data lake by covering the tasks that will be performed at each interval of 30 days post implementation of the data lake. Boost your pitch with our creative 30 60 90 Days Plan For Data Lake Diagrams PDF. Deliver an awe inspiring pitch that will mesmerize everyone. Using these presentation templates you will surely catch everyones attention. You can browse the ppts collection on our website. We have researchers who are experts at creating the right content for the templates. So you do not have to invest time in any additional work. Just grab the template now and use them.
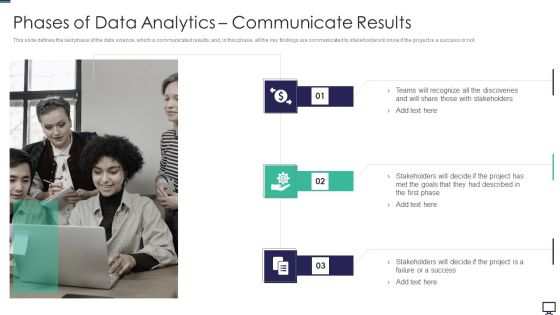
Phases Of Data Analytics Communicate Results Ppt Ideas Inspiration PDF
This slide defines the last phase of the data science, which is communicated results, and, in this phase, all the key findings are communicated to stakeholders to know if the project is a success or not. Presenting phases of data analytics communicate results ppt ideas inspiration pdf to provide visual cues and insights. Share and navigate important information on three stages that need your due attention. This template can be used to pitch topics like goals, project. In addtion, this PPT design contains high resolution images, graphics, etc, that are easily editable and available for immediate download.
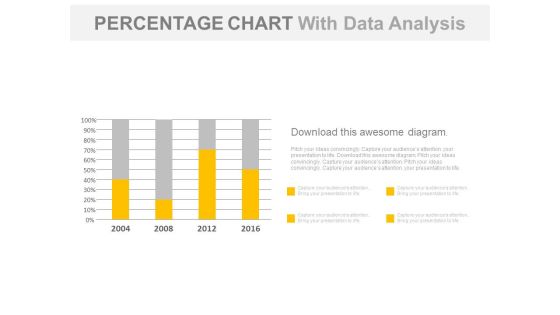
Year Based Chart With Percentage Data Analysis Powerpoint Slides
Our above business slide contains year based statistical chart. This PowerPoint template can be used to display percentage data analysis. Capture the attention of your audience with this slide.
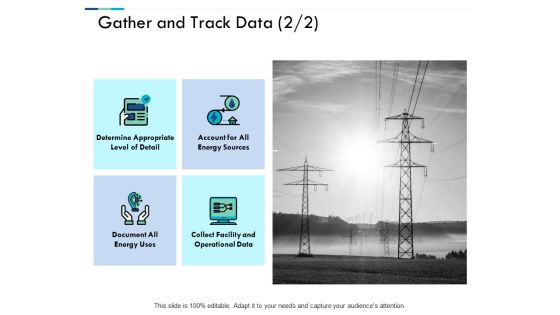
Gather And Track Data Business Ppt PowerPoint Presentation File Samples
This is a gather and track data business ppt powerpoint presentation file samples. The topics discussed in this diagram are business, management, planning, strategy, marketing. This is a completely editable PowerPoint presentation, and is available for immediate download.

Gathering Customer Collecting Quantitative Data For Personalized Marketing Portrait PDF
This slide showcases quantitative data that can be collected to formulate personalized marketing campaign. It also shows ways to collect data from different sources. Whether you have daily or monthly meetings, a brilliant presentation is necessary. Gathering Customer Collecting Quantitative Data For Personalized Marketing Portrait PDF can be your best option for delivering a presentation. Represent everything in detail using Gathering Customer Collecting Quantitative Data For Personalized Marketing Portrait PDF and make yourself stand out in meetings. The template is versatile and follows a structure that will cater to your requirements. All the templates prepared by Slidegeeks are easy to download and edit. Our research experts have taken care of the corporate themes as well. So, give it a try and see the results.

Pharmacy Information System Data Flow Diagram Structure PDF
The following diagram depicts four scenarios in pharmacy management system. It includes customer details management, drug information management, inventory management and payment processing. Showcasing this set of slides titled Pharmacy Information System Data Flow Diagram Structure PDF. The topics addressed in these templates are Administer Customer Data, Drug Information Management, Control Sales And Inventory. All the content presented in this PPT design is completely editable. Download it and make adjustments in color, background, font etc. as per your unique business setting.
Seven Steps Of Spend Data Assessment With Icons Ppt PowerPoint Presentation Styles Portrait
Presenting this set of slides with name seven steps of spend data assessment with icons ppt powerpoint presentation styles portrait. This is a seven stage process. The stages in this process are collect spend data, cleanse spend data, classify spend data, detect addressable spend define categories, select high impact spend, execute opportunity scan . This is a completely editable PowerPoint presentation and is available for immediate download. Download now and impress your audience.

3 Months Roadmap For Data Center Revamping Microsoft
We present our 3 months roadmap for data center revamping microsoft. This PowerPoint layout is easy to edit so you can change the font size, font type, color, and shape conveniently. In addition to this, the PowerPoint layout is Google Slides compatible, so you can share it with your audience and give them access to edit it. Therefore, download and save this well researched 3 months roadmap for data center revamping microsoft in different formats like PDF, PNG, and JPG to smoothly execute your business plan.

Half Yearly Roadmap For Data Center Revamping Sample
We present our half yearly roadmap for data center revamping sample. This PowerPoint layout is easy to edit so you can change the font size, font type, color, and shape conveniently. In addition to this, the PowerPoint layout is Google Slides compatible, so you can share it with your audience and give them access to edit it. Therefore, download and save this well researched half yearly roadmap for data center revamping sample in different formats like PDF, PNG, and JPG to smoothly execute your business plan.

5 Year Roadmap For Data Center Revamping Microsoft
We present our 5 year roadmap for data center revamping microsoft. This PowerPoint layout is easy to edit so you can change the font size, font type, color, and shape conveniently. In addition to this, the PowerPoint layout is Google Slides compatible, so you can share it with your audience and give them access to edit it. Therefore, download and save this well researched 5 year roadmap for data center revamping microsoft in different formats like PDF, PNG, and JPG to smoothly execute your business plan.
Six Steps To Organize Business Data With Icons Ppt File Grid PDF
Presenting this set of slides with name six steps to organize business data with icons ppt file grid pdf. This is a six stage process. The stages in this process are standardize data, append missing data, workforce training, validate data accuracy, automation process, tracking data cleaning system. This is a completely editable PowerPoint presentation and is available for immediate download. Download now and impress your audience.
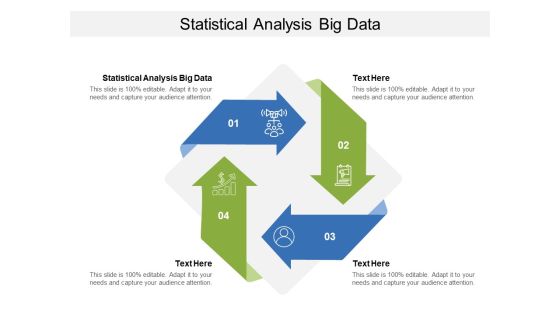
Statistical Analysis Big Data Ppt PowerPoint Presentation Ideas Diagrams Cpb
Presenting this set of slides with name statistical analysis big data ppt powerpoint presentation ideas diagrams cpb. This is an editable Powerpoint four stages graphic that deals with topics like statistical analysis big data to help convey your message better graphically. This product is a premium product available for immediate download and is 100 percent editable in Powerpoint. Download this now and use it in your presentations to impress your audience.

Procedure Of Evaluating Data For Business Decision Professional PDF
This slide showcases the types of data analysis process to identify the data patterns and business decisions . It includes key types such as descriptive analysis, exploratory analysis, diagnostic analysis, predictive analysis, prescriptive analysis and statistical analysis. Presenting Procedure Of Evaluating Data For Business Decision Professional PDF to dispense important information. This template comprises six stages. It also presents valuable insights into the topics including Diagnostic Analysis, Predictive Analysis, Prescriptive Analysis. This is a completely customizable PowerPoint theme that can be put to use immediately. So, download it and address the topic impactfully.

ESG Data Reporting And Management Dashboard Download PDF
The following slide showcases a dashboard for tracking and managing data of economic, social and global goals. It provides information about ESG score breakdown by region, MV weight and MTD return by sector, fund vs. sector ESG score, lowest rated companies with MV weight over 1 percent, etc. Formulating a presentation can take up a lot of effort and time, so the content and message should always be the primary focus. The visuals of the PowerPoint can enhance the presenters message, so our ESG Data Reporting And Management Dashboard Download PDF was created to help save time. Instead of worrying about the design, the presenter can concentrate on the message while our designers work on creating the ideal templates for whatever situation is needed. Slidegeeks has experts for everything from amazing designs to valuable content, we have put everything into ESG Data Reporting And Management Dashboard Download PDF.

Data Protection Technology Ppt PowerPoint Presentation Styles Diagrams Cpb Pdf
Presenting this set of slides with name data protection technology ppt powerpoint presentation styles diagrams cpb pdf. This is an editable Powerpoint six stages graphic that deals with topics like data protection technology to help convey your message better graphically. This product is a premium product available for immediate download and is 100 percent editable in Powerpoint. Download this now and use it in your presentations to impress your audience.

data collection and analysis control chart ppt powerpoint presentation styles
This is a data collection and analysis control chart ppt powerpoint presentation styles. This is a one stage process. The stages in this process are upper limit, centerline, plotted points, lower limit, point labels.
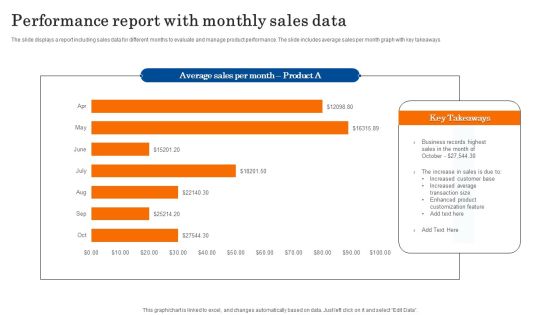
Performance Report With Monthly Sales Data Diagrams PDF
The slide displays a report including sales data for different months to evaluate and manage product performance. The slide includes average sales per month graph with key takeaways. Showcasing this set of slides titled Performance Report With Monthly Sales Data Diagrams PDF. The topics addressed in these templates are Business, Sales, Customization. All the content presented in this PPT design is completely editable. Download it and make adjustments in color, background, font etc. as per your unique business setting.

Data Collection And Analysis Flow Chart Ppt PowerPoint Presentation Sample
This is a data collection and analysis flow chart ppt powerpoint presentation sample. This is a five stage process. The stages in this process are business, strategy, marketing, process, growth strategy, finance.

data collection scatter diagram ppt powerpoint presentation inspiration
This is a data collection scatter diagram ppt powerpoint presentation inspiration. This is a three stage process. The stages in this process are business, planning, marketing, scatter diagram, finance.

Management Information System Steps To Implement Data Warehouse Clipart PDF
This slide represents the steps to implement a data warehouse in the organization, including enterprise strategies, phased delivery, and iterative prototyping.Presenting Management Information System Steps To Implement Data Warehouse Clipart PDF to provide visual cues and insights. Share and navigate important information on three stages that need your due attention. This template can be used to pitch topics like Enterprise Strategy, Phased Delivery, Iterative Prototyping. In addtion, this PPT design contains high resolution images, graphics, etc, that are easily editable and available for immediate download.

Business Diagram Colorful Box For Data Representation Presentation Template
Graphic of colorful boxes has been used to craft this power point template. This PPT diagram contains the concept of data representation. Use this PPT for business and management related presentations.
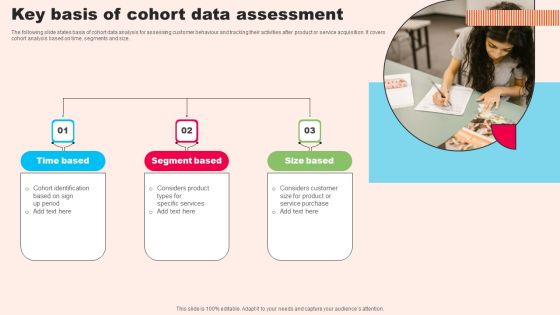
Key Basis Of Cohort Data Assessment Microsoft PDF
The following slide states basis of cohort data analysis for assessing customer behaviour and tracking their activities after product or service acquisition. It covers cohort analysis based on time, segments and size. Presenting Key Basis Of Cohort Data Assessment Microsoft PDF to dispense important information. This template comprises three stages. It also presents valuable insights into the topics including Time Based, Segment Based, Size Based. This is a completely customizable PowerPoint theme that can be put to use immediately. So, download it and address the topic impactfully.

Complete Overview Of Structured Big Data Implementation Type Template PDF
This slide provides a complete overview of structured data that helps businesses dealing high volumes of information and analyse big data to drive business outcomes. It covers aspects such as definition, characteristics, sources, examples and advantages. Presenting Complete Overview Of Structured Big Data Implementation Type Template PDF to dispense important information. This template comprises five stages. It also presents valuable insights into the topics including Definition, Characteristics, Sources, Examples, Advantages. This is a completely customizable PowerPoint theme that can be put to use immediately. So, download it and address the topic impactfully.

Transaction Data Augmentation Flowchart Diagram Ppt Inspiration Format PDF
The following slide represent transaction data enrichment flowchart diagram. Which includes review stage , web scraping stage and processing of transaction. Presenting Transaction Data Augmentation Flowchart Diagram Ppt Inspiration Format PDF to dispense important information. This template comprises one stages. It also presents valuable insights into the topics including Transaction Created, Signature Created, Pending Enrichment Information. This is a completely customizable PowerPoint theme that can be put to use immediately. So, download it and address the topic impactfully.
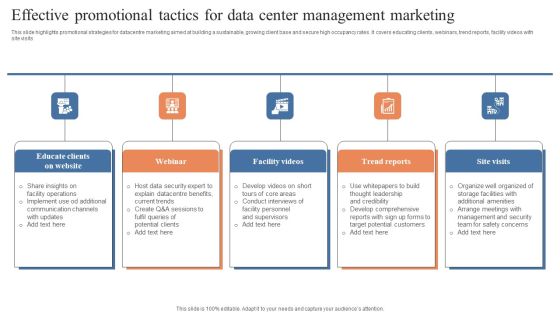
Effective Promotional Tactics For Data Center Management Marketing Rules PDF
This slide highlights promotional strategies for datacentre marketing aimed at building a sustainable, growing client base and secure high occupancy rates. It covers educating clients, webinars, trend reports, facility videos with site visits . Presenting Effective Promotional Tactics For Data Center Management Marketing Rules PDF to dispense important information. This template comprises five stages. It also presents valuable insights into the topics including Educate Clients Website, Facility Videos, Trend Reports. This is a completely customizable PowerPoint theme that can be put to use immediately. So, download it and address the topic impactfully.
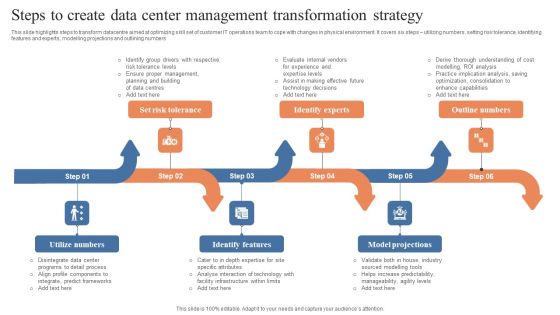
Steps To Create Data Center Management Transformation Strategy Formats PDF
This slide highlights steps to transform datacentre aimed at optimizing skill set of customer IT operations team to cope with changes in physical environment. It covers six steps utilizing numbers, setting risk tolerance, identifying features and experts, modelling projections and outlining numbers. Presenting Steps To Create Data Center Management Transformation Strategy Formats PDF to dispense important information. This template comprises six stages. It also presents valuable insights into the topics including Utilize Numbers, Identify Features, Identify Experts. This is a completely customizable PowerPoint theme that can be put to use immediately. So, download it and address the topic impactfully.
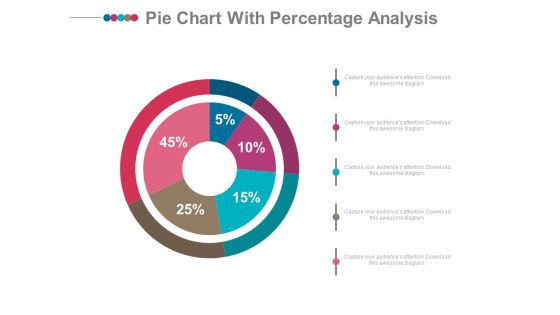
Pie Chart With Financial Data Comparison Powerpoint Slides
Emphatically define your message with our above template which contains graphics of pie chart. This PowerPoint template may be used to display financial data comparison. Grab the attention of your listeners with this slide.

Data Collection Scatter Diagram Ppt PowerPoint Presentation Professional Smartart
This is a data collection scatter diagram ppt powerpoint presentation professional smartart. This is a three stage process. The stages in this process are business, marketing, finance, graph, strategy.

Credit Risk Management Data Analysis On Bank Npas Microsoft PDF
This slide shows the data analysis of XYZ banks NPAs with other competitor banks and also the loans and advances for the same. Whether you have daily or monthly meetings, a brilliant presentation is necessary. Credit Risk Management Data Analysis On Bank Npas Microsoft PDF can be your best option for delivering a presentation. Represent everything in detail using Credit Risk Management Data Analysis On Bank Npas Microsoft PDF and make yourself stand out in meetings. The template is versatile and follows a structure that will cater to your requirements. All the templates prepared by Slidegeeks are easy to download and edit. Our research experts have taken care of the corporate themes as well. So, give it a try and see the results.

Organizations Employee Creating Gantt Charts For Data Representation Download PDF
Persuade your audience using this organizations employee creating gantt charts for data representation download pdf. This PPT design covers two stages, thus making it a great tool to use. It also caters to a variety of topics including organizations employee creating gantt charts for data representation. Download this PPT design now to present a convincing pitch that not only emphasizes the topic but also showcases your presentation skills.

Executing Advance Data Analytics At Workspace Comprehensive Network Diagrams PDF
This slide helps in analyzing the performance of different executives representatives. It will help in tracking metrics such as cost per contact, percentage of tickets opened, etc. The staff performance will be assessed on various parameters such as cost, quality, productivity and service level. Deliver and pitch your topic in the best possible manner with this executing advance data analytics at workspace comprehensive network diagrams pdf. Use them to share invaluable insights on assessing staff performance on various parameters and impress your audience. This template can be altered and modified as per your expectations. So, grab it now.

Big Data Management In Healthcare Sector Infographics PDF
This slide covers the applications where the big data can be proved very useful in the field of health and safety. Applications where it is used are smoother hospital administration, healthcare intelligence and fraud detection and prevention. Presenting Big Data Management In Healthcare Sector Infographics PDF to dispense important information. This template comprises three stages. It also presents valuable insights into the topics including Business Solutions, Develop Smart, Measurement. This is a completely customizable PowerPoint theme that can be put to use immediately. So, download it and address the topic impactfully.
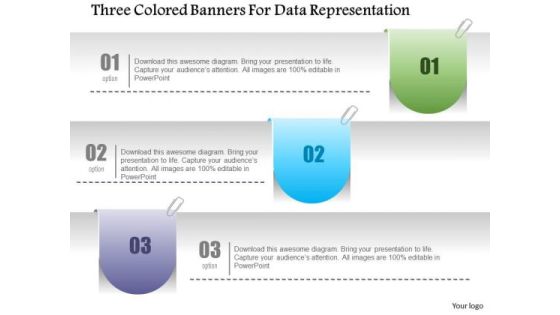
Business Diagram Three Colored Banners For Data Representation Presentation Template
Three colored banners are used to craft this power point template slide. This PPT slide contains the concept of data representation. Use this PPT slide for your business and management related presentations.
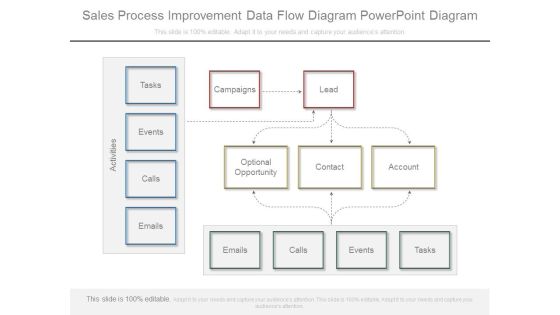
Sales Process Improvement Data Flow Diagram Powerpoint Diagram
This is a sales process improvement data flow diagram powerpoint diagram. This is a thirteen stage process. The stages in this process are campaigns, lead, optional opportunity, contact,. account, emails, calls.

Five Steps For Data Compare And Analysis Powerpoint Template
Our above slide contains graphics of five steps chart. This PowerPoint template is useful for data compare and analysis. Use this diagram to impart more clarity to subject and to create more sound impact on viewers.

Executing Advance Data Analytics At Workspace Technological Assessment Themes PDF
IT infrastructure management capabilities will be judged based on several parameters such as incidents and service requests handling rate, service failure rate, customer satisfaction score, etc. This is a executing advance data analytics at workspace technological assessment themes pdf template with various stages. Focus and dispense information on four stages using this creative set, that comes with editable features. It contains large content boxes to add your information on topics like technological assessment of firm current infrastructure management capabilities. You can also showcase facts, figures, and other relevant content using this PPT layout. Grab it now.
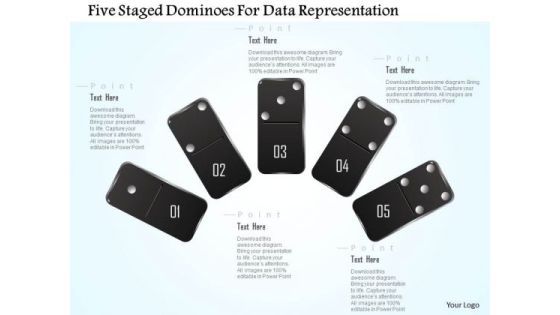
Busines Diagram Five Staged Dominoes For Data Representation Presentation Template
This business diagram displays graphics of five staged dominoes. Use this slide to represent your data in visual manner. This slide offers an excellent background to build professional presentations.
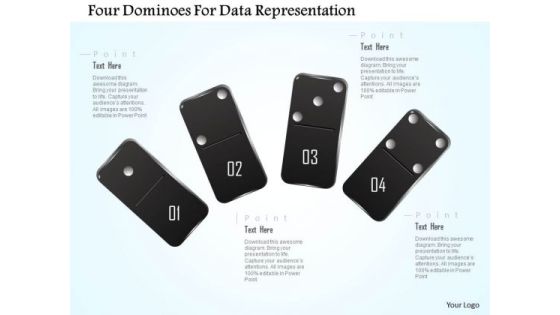
Busines Diagram Four Dominoes For Data Representation Presentation Template
This business diagram displays graphics of four staged dominoes. Use this slide to represent your data in visual manner. This slide offers an excellent background to build professional presentations.
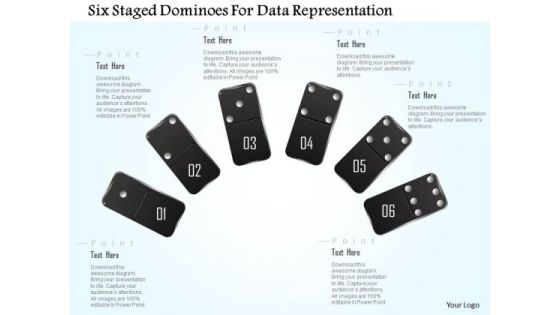
Busines Diagram Six Staged Dominoes For Data Representation Presentation Template
This business diagram displays graphics of six staged dominoes. Use this slide to represent your data in visual manner. This slide offers an excellent background to build professional presentations.

Data Mining Artificial Intelligence Ppt PowerPoint Presentation Inspiration Guide Cpb
Presenting this set of slides with name data mining artificial intelligence ppt powerpoint presentation inspiration guide cpb. This is an editable Powerpoint four stages graphic that deals with topics like data mining artificial intelligence to help convey your message better graphically. This product is a premium product available for immediate download and is 100 percent editable in Powerpoint. Download this now and use it in your presentations to impress your audience.

Qualitative Data Market Research Ppt PowerPoint Presentation Layouts Gallery Cpb
Presenting this set of slides with name qualitative data market research ppt powerpoint presentation layouts gallery cpb. This is an editable Powerpoint three stages graphic that deals with topics like qualitative data market research to help convey your message better graphically. This product is a premium product available for immediate download and is 100 percent editable in Powerpoint. Download this now and use it in your presentations to impress your audience.

Cloud Computer Data Management Icons Ppt PowerPoint Presentation Infographic Template Aids
This is a cloud computer data management icons ppt powerpoint presentation infographic template aids. This is a three stage process. The stages in this process are transform and load, data wore housing, etl, extract.

Transaction Data Overview Company Payout Dashboard Guidelines PDF
The slide highlights the payment dashboard to overview the transaction data for effectively managing finances. Various elements included are activities, statistics, card information, transaction history, and budget. Pitch your topic with ease and precision using this Transaction Data Overview Company Payout Dashboard Guidelines PDF. This layout presents information on Transaction History, Budget, Card Information, Statistics. It is also available for immediate download and adjustment. So, changes can be made in the color, design, graphics or any other component to create a unique layout.

Data Feed News And Information With Icons Ppt PowerPoint Presentation Pictures Master Slide
This is a data feed news and information with icons ppt powerpoint presentation pictures master slide. This is a two stage process. The stages in this process are data feed, web feed, information feed.

Half Yearly Medicinal Investigation Process Roadmap With Data Collection Summary
We present our half yearly medicinal investigation process roadmap with data collection summary. This PowerPoint layout is easy to edit so you can change the font size, font type, color, and shape conveniently. In addition to this, the PowerPoint layout is Google Slides compatible, so you can share it with your audience and give them access to edit it. Therefore, download and save this well researched half yearly medicinal investigation process roadmap with data collection summary in different formats like PDF, PNG, and JPG to smoothly execute your business plan.

Introduction To Data Lake File Storage System Themes PDF
This slide represents the data lake file storage system based on big datas five Vs such as volume, velocity, value, veracity and variety, and benefits of using this file storage system. Do you have to make sure that everyone on your team knows about any specific topic I yes, then you should give Introduction To Data Lake File Storage System Themes PDF a try. Our experts have put a lot of knowledge and effort into creating this impeccable Introduction To Data Lake File Storage System Themes PDF. You can use this template for your upcoming presentations, as the slides are perfect to represent even the tiniest detail. You can download these templates from the Slidegeeks website and these are easy to edit. So grab these today.
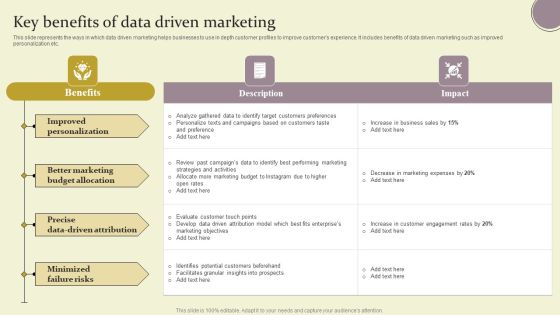
Key Benefits Of Data Driven Marketing Ppt Ideas Grid PDF
This slide represents the ways in which data driven marketing helps businesses to use in depth customer profiles to improve customers experience. It includes benefits of data driven marketing such as improved personalization etc. Are you searching for a Key Benefits Of Data Driven Marketing Ppt Ideas Grid PDF that is uncluttered, straightforward, and original Its easy to edit, and you can change the colors to suit your personal or business branding. For a presentation that expresses how much effort you have put in, this template is ideal With all of its features, including tables, diagrams, statistics, and lists, its perfect for a business plan presentation. Make your ideas more appealing with these professional slides. Download Key Benefits Of Data Driven Marketing Ppt Ideas Grid PDF from Slidegeeks today.

Big Data Architecture Layers Ppt PowerPoint Presentation Diagram Lists PDF
Presenting Big Data Architecture Layers Ppt PowerPoint Presentation Diagram Lists PDF to provide visual cues and insights. Share and navigate important information on four stages that need your due attention. This template can be used to pitch topics like Big Data Sources Layer, Consumption Layer, Analysis Layer. In addtion, this PPT design contains high resolution images, graphics, etc, that are easily editable and available for immediate download.
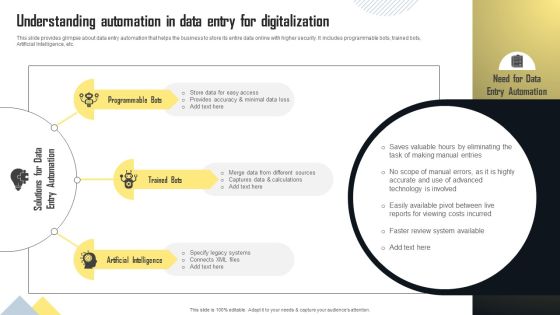
Understanding Automation In Data Entry For Digitalization Diagrams PDF
This slide provides glimpse about data entry automation that helps the business to store its entire data online with higher security. It includes programmable bots, trained bots, Artificial Intelligence, etc. Explore a selection of the finest Understanding Automation In Data Entry For Digitalization Diagrams PDF here. With a plethora of professionally designed and pre made slide templates, you can quickly and easily find the right one for your upcoming presentation. You can use our Understanding Automation In Data Entry For Digitalization Diagrams PDF to effectively convey your message to a wider audience. Slidegeeks has done a lot of research before preparing these presentation templates. The content can be personalized and the slides are highly editable. Grab templates today from Slidegeeks.
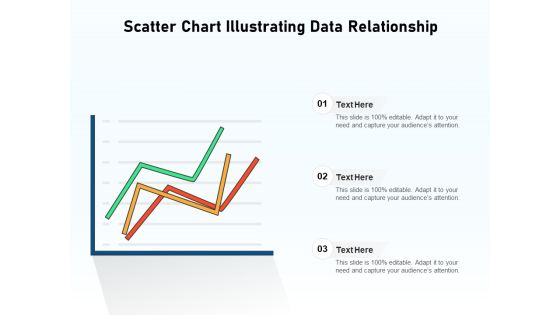
Scatter Chart Illustrating Data Relationship Ppt PowerPoint Presentation Microsoft PDF
Persuade your audience using this scatter chart illustrating data relationship ppt powerpoint presentation microsoft pdf. This PPT design covers three stages, thus making it a great tool to use. It also caters to a variety of topics including scatter chart illustrating data relationship. Download this PPT design now to present a convincing pitch that not only emphasizes the topic but also showcases your presentation skills.

Four Steps For Financial Data Analysis Powerpoint Slides
This PowerPoint contains four circles with percentage values. Download this diagram slide to display financial data analysis. This template is editable, You can edit text, color, shade and style of this diagram as per you need.

Information Studies Different Types Of Data Scientists Introduction PDF
This slide represents the different types of data scientists, including vertical experts, stat DS managers, generalists, legends, statisticians, ML engineers, and dabblers. Presenting Information Studies Different Types Of Data Scientists Introduction PDF to provide visual cues and insights. Share and navigate important information on seven stages that need your due attention. This template can be used to pitch topics like Vertical Experts, Star DS Manager, Generalists. In addtion, this PPT design contains high resolution images, graphics, etc, that are easily editable and available for immediate download.

 Home
Home