AI PPT Maker
Templates
PPT Bundles
Design Services
Business PPTs
Business Plan
Management
Strategy
Introduction PPT
Roadmap
Self Introduction
Timelines
Process
Marketing
Agenda
Technology
Medical
Startup Business Plan
Cyber Security
Dashboards
SWOT
Proposals
Education
Pitch Deck
Digital Marketing
KPIs
Project Management
Product Management
Artificial Intelligence
Target Market
Communication
Supply Chain
Google Slides
Research Services
 One Pagers
All Categories
-
Home
- Customer Favorites
- Data Governance Icon
Data Governance Icon

Resource Administration Accounting Scorecard With Inventory Turnover Microsoft PDF
This graph or chart is linked to excel, and changes automatically based on data. Just left click on it and select Edit Data. Deliver an awe inspiring pitch with this creative Resource Administration Accounting Scorecard With Inventory Turnover Microsoft PDF bundle. Topics like Inventory Turnover, Inventory Accuracy, Back Order Rate can be discussed with this completely editable template. It is available for immediate download depending on the needs and requirements of the user.
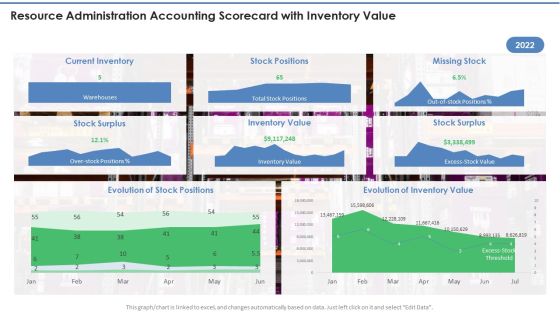
Resource Administration Accounting Scorecard With Inventory Value Infographics PDF
This graph or chart is linked to excel, and changes automatically based on data. Just left click on it and select Edit Data. Deliver and pitch your topic in the best possible manner with this Resource Administration Accounting Scorecard With Inventory Value Infographics PDF. Use them to share invaluable insights on Current Inventory, Stock Positions, Missing Stock and impress your audience. This template can be altered and modified as per your expectations. So, grab it now.
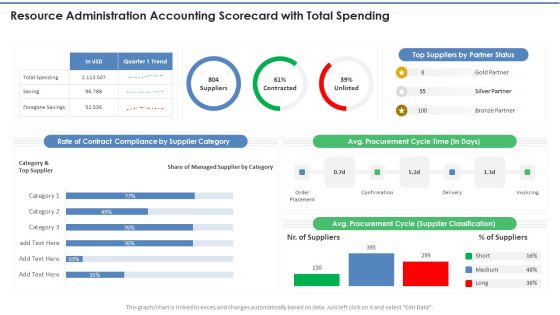
Resource Administration Accounting Scorecard With Total Spending Professional PDF
This graph or chart is linked to excel, and changes automatically based on data. Just left click on it and select Edit Data. Deliver and pitch your topic in the best possible manner with this Resource Administration Accounting Scorecard With Total Spending Professional PDF. Use them to share invaluable insights on Supplier Category, Cycle Time, Top Suppliers and impress your audience. This template can be altered and modified as per your expectations. So, grab it now.
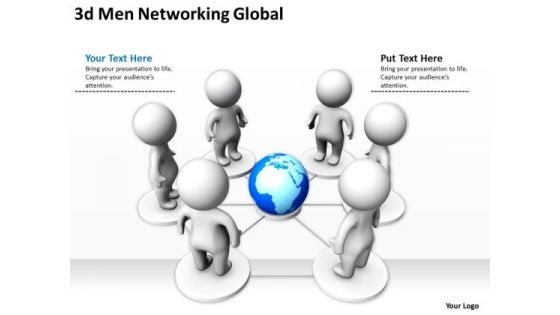
Business Development Process Diagram 3d Networking Global PowerPoint Templates
We present our business development process diagram 3d networking global PowerPoint templates.Download and present our People PowerPoint Templates because You are well armed with penetrative ideas. Our PowerPoint Templates and Slides will provide the gunpowder you need. Download and present our Network Diagrams PowerPoint Templates because Our PowerPoint Templates and Slides will definately Enhance the stature of your presentation. Adorn the beauty of your thoughts with their colourful backgrounds. Present our Spheres PowerPoint Templates because Our PowerPoint Templates and Slides will embellish your thoughts. See them provide the desired motivation to your team. Use our Communication PowerPoint Templates because Our PowerPoint Templates and Slides will bullet point your ideas. See them fall into place one by one. Download our Business PowerPoint Templates because You canTake a leap off the starting blocks with our PowerPoint Templates and Slides. They will put you ahead of the competition in quick time.Use these PowerPoint slides for presentations relating to 3d, abstract, background, blue, business, communication, community,company, computer, concept, connect, connection, contact, data, earth, global,globe, graphic, group, human, icon, idea, illustration, information, internet,isolated, laptop, map, meeting, men, network, organization, partnership, people,person, planet, relationship, silhouette, space, success, team, teamwork,technology, together, unity, web, white, work, world, worldwide. The prominent colors used in the PowerPoint template are Blue, White, Gray. Customers tell us our business development process diagram 3d networking global PowerPoint templates will make the presenter successul in his career/life. We assure you our blue PowerPoint templates and PPT Slides are second to none. Customers tell us our business development process diagram 3d networking global PowerPoint templates will help you be quick off the draw. Just enter your specific text and see your points hit home. Use our blue PowerPoint templates and PPT Slides are effectively colour coded to prioritise your plans They automatically highlight the sequence of events you desire. PowerPoint presentation experts tell us our business development process diagram 3d networking global PowerPoint templates are aesthetically designed to attract attention. We guarantee that they will grab all the eyeballs you need. You can be sure our company PowerPoint templates and PPT Slides will make the presenter successul in his career/life.
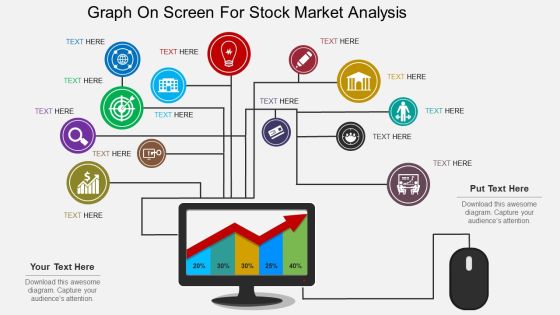
Graph On Screen For Stock Market Analysis Powerpoint Template
This PowerPoint slide contains computer screen with business graph. This professional slide may be used for visual explanation of data. Adjust the above diagram in your business presentations to give professional impact.

Risk Ppt PowerPoint Presentation Summary Graphics Pictures
This is a risk ppt powerpoint presentation summary graphics pictures. This is a three stage process. The stages in this process are icons, management, analysis, strategy, marketing.
Four Circles For Information Display Powerpoint Templates
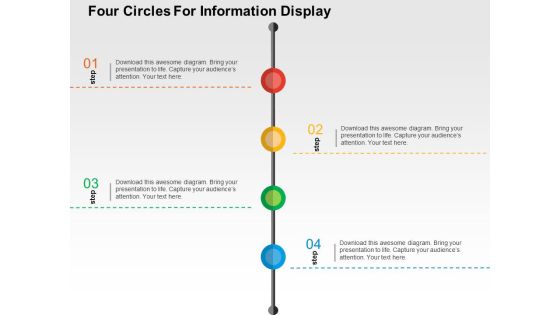
This PowerPoint slide contains graphics of four circles. This professional slide may be used for visual explanation of data. Adjust the above diagram in your business presentations to give professional impact.
Web Marketing Resources Ppt Powerpoint Presentation
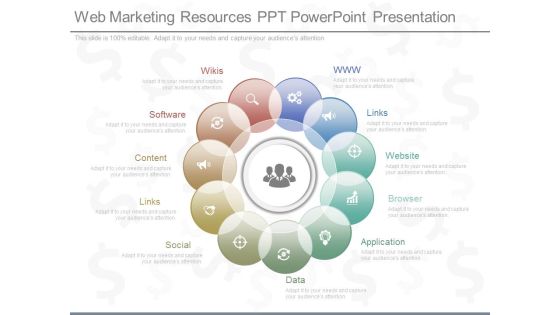
This is a web marketing resources ppt powerpoint presentation. This is a eleven stage process. The stages in this process are www, links, website, browser, application, data, social, links, content, software, wikis.
Ppt Four Segments Around Globe PowerPoint Presentation Circle Blue Templates
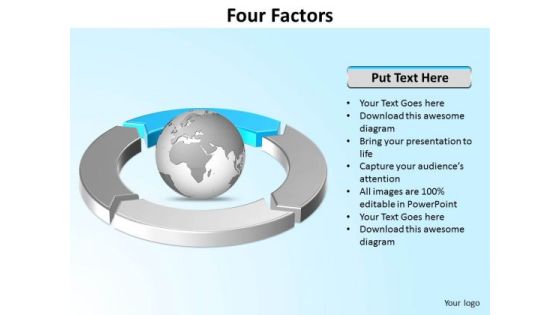
PPT four segments around globe powerpoint presentation circle blue Templates-This PowerPoint Diagram can be used to represent worldwide business issues such as financial data, stock market Exchange, increase in sales, corporate presentations and more. It illustrates the blue component of this worldwide PowerPoint Diagram.-Can be used for presentations on abstract, achievement, aim, arrow, background, business, chart, communication, company, competition, concept, design, development, diagram, direction, finance, financial, forecast, forward, goal, graph, graphic, growth, icon, illustration, increase, investment, leader, leadership, marketing, motion, moving, path, price, process, profit, progress, progress bar, shape, sign, success, symbol, target, team, teamwork, turquoise blue, up, upward-PPT four segments around globe powerpoint presentation circle blue Templates
Ppt Four Segments Around Microsoft PowerPoint Backgrounds Circle Purple Templates
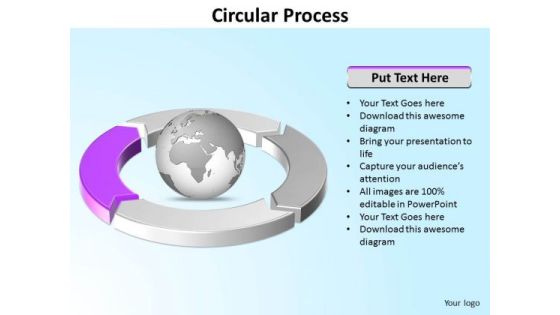
PPT four segments around microsoft powerpoint backgrounds circle purple Templates-This PowerPoint Diagram can be used to represent worldwide business issues such as financial data, stock market Exchange, increase in sales, corporate presentations and more. It illustrates the purple component. This Diagram will fit for Business Presentations.-Can be used for presentations on abstract, achievement, aim, arrow, background, business, chart, communication, company, competition, concept, design, development, diagram, direction, finance, financial, forecast, forward, goal, graph, graphic, growth, icon, illustration, increase, investment, leader, leadership, marketing, motion, moving, path, price, process, profit, progress, progress bar, shape, sign, success, symbol, target, team, teamwork, turquoise blue, up, upward-PPT four segments around microsoft powerpoint backgrounds circle purple Templates

Ppt Four Segments Around Globe In Circle PowerPoint Presentation Templates
PPT four segments around globe in circle powerpoint presentation Templates-Use this graphical approach to represent global business issues such as financial data, stock market Exchange, increase in sales, corporate presentations and more. It Signifies common, comprehensive, extensive, global, international, multinational, omnipresent, planetary, ubiquitous, universal etc.-Can be used for presentations on abstract, achievement, aim, arrow, background, business, chart, communication, company, competition, concept, design, development, diagram, direction, finance, financial, forecast, forward, goal, graph, graphic, growth, icon, illustration, increase, investment, leader, leadership, marketing, motion, moving, path, price, process, profit, progress, progress bar, shape, sign, success, symbol, target, team, teamwork, turquoise blue, up, upward-PPT four segments around globe in circle powerpoint presentation Templates

Website Traffic Analysis Diagram Presentation Layouts
This is a website traffic analysis diagram presentation layouts. This is a four stage process. The stages in this process are keywords used, design analysis, define goals, collect data, web analysis process.
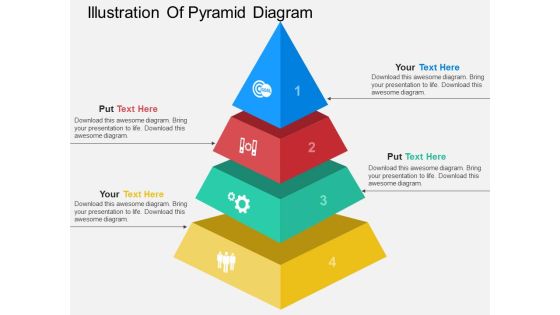
Illustration Of Pyramid Diagram Powerpoint Template
This PowerPoint slide contains illustration of pyramid diagram. This professional slide may be used for visual explanation of data. Adjust the above diagram in your business presentations to give professional impact.

Best Practices For Permission Advertising Campaign Mockup PDF
This slide exhibits permission marketing practices to increase customer engagement and conversion rates. It includes four points clearly state privacy policy, prioritize customer data, understand target audience and secure consumer data. Presenting Best Practices For Permission Advertising Campaign Mockup PDF to dispense important information. This template comprises four stages. It also presents valuable insights into the topics including Understand Target Audience, Secure Consumer Data, Prioritize Customer Choice. This is a completely customizable PowerPoint theme that can be put to use immediately. So, download it and address the topic impactfully.

Web Mapping Diagram Powerpoint Templates
This is a web mapping diagram powerpoint templates. This is a six stage process. The stages in this process are spatial data, prepare response, user request, information, geography, web mapping.

Resource Administration Accounting Scorecard With Defects And Fill Rate Mockup PDF
This graph or chart is linked to excel, and changes automatically based on data. Just left click on it and select Edit Data. Deliver and pitch your topic in the best possible manner with this Resource Administration Accounting Scorecard With Defects And Fill Rate Mockup PDF. Use them to share invaluable insights on Total Order Amount, Raw Material, Quantity Analysis and impress your audience. This template can be altered and modified as per your expectations. So, grab it now.
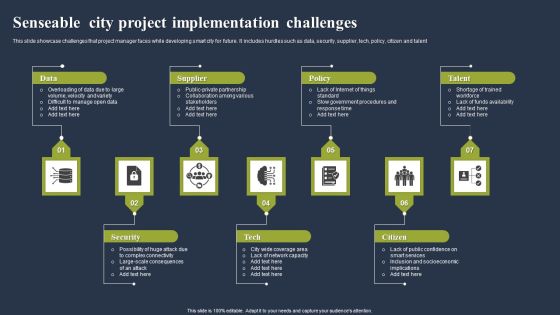
Senseable City Project Implementation Challenges Topics PDF
This slide showcase challenges that project manager faces while developing smart city for future. It includes hurdles such as data, security, supplier, tech, policy, citizen and talent. Presenting Senseable City Project Implementation Challenges Topics PDF to dispense important information. This template comprises seven stages. It also presents valuable insights into the topics including Data, Supplier, Policy. This is a completely customizable PowerPoint theme that can be put to use immediately. So, download it and address the topic impactfully.

Business Diagram Business Plan With Five Options Presentation Template
This business slide helps to displays business plan with five options. This diagram can help by summarizing the key features of the data. Use this editable diagram for your business and management related presentations.

Quarterly Resource Administration Accounting Scorecard With Average Finished Goods Value Introduction PDF
This graph or chart is linked to excel, and changes automatically based on data. Just left click on it and select Edit Data. Deliver an awe inspiring pitch with this creative Quarterly Resource Administration Accounting Scorecard With Average Finished Goods Value Introduction PDF bundle. Topics like Inventory Turns, Average WIP Value, Total Cost Goods can be discussed with this completely editable template. It is available for immediate download depending on the needs and requirements of the user.

Resource Administration Accounting Scorecard With Cost Of Purchase Order Download PDF
This graph or chart is linked to excel, and changes automatically based on data. Just left click on it and select Edit Data. Deliver an awe inspiring pitch with this creative Resource Administration Accounting Scorecard With Cost Of Purchase Order Download PDF bundle. Topics like Cost Reduction, Cost Avoidance, Procurement ROI can be discussed with this completely editable template. It is available for immediate download depending on the needs and requirements of the user.
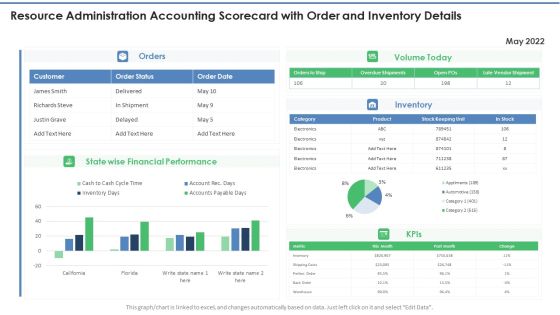
Resource Administration Accounting Scorecard With Order And Inventory Details Mockup PDF
This graph or chart is linked to excel, and changes automatically based on data. Just left click on it and select Edit Data. Deliver and pitch your topic in the best possible manner with this Resource Administration Accounting Scorecard With Order And Inventory Details Mockup PDF. Use them to share invaluable insights on Volume Today, Financial Performance, State wise and impress your audience. This template can be altered and modified as per your expectations. So, grab it now.

Yearly Resource Administration Accounting Scorecard With Carrying Cost Of Inventory Slides PDF
This graph or chart is linked to excel, and changes automatically based on data. Just left click on it and select Edit Data. Deliver an awe inspiring pitch with this creative Yearly Resource Administration Accounting Scorecard With Carrying Cost Of Inventory Slides PDF bundle. Topics like Carrying Cost Inventory, Inventory Shrinkage can be discussed with this completely editable template. It is available for immediate download depending on the needs and requirements of the user.

Set Of Seven Vertical Steps Powerpoint Templates
This PowerPoint slide contains graphics of seven vertical steps. This professional slide may be used for visual explanation of data. Adjust the above diagram in your business presentations to give professional impact.

Set Of Six Vertical Steps Powerpoint Templates
This PowerPoint slide contains graphics of six vertical steps. This professional slide may be used for visual explanation of data. Adjust the above diagram in your business presentations to give professional impact.

Appliances Energy And Cost Consumption Statistics Dashboard Download PDF
This graph or chart is linked to excel, and changes automatically based on data. Just left click on it and select edit data. Presenting Appliances Energy And Cost Consumption Statistics Dashboard Download PDF to dispense important information. This template comprises ten stages. It also presents valuable insights into the topics including Water Heater, Electric Vehicle, Pool Pump. This is a completely customizable PowerPoint theme that can be put to use immediately. So, download it and address the topic impactfully.

Cyber Security Response Sample Diagram Powerpoint Images
This is a cyber security response sample diagram powerpoint images. This is a eight stage process. The stages in this process are preparation, containment and remediation, malware analysis, campaigns, cyber security, log and event data, advertise, tools and tactics.

Local Level Intelligence Diagram Powerpoint Slide Download
This is a local level intelligence diagram powerpoint slide download. This is a six stage process. The stages in this process are technology variables, site specific, data, local level intelligence, technology infrastructure, product service category, competitive landscape study.
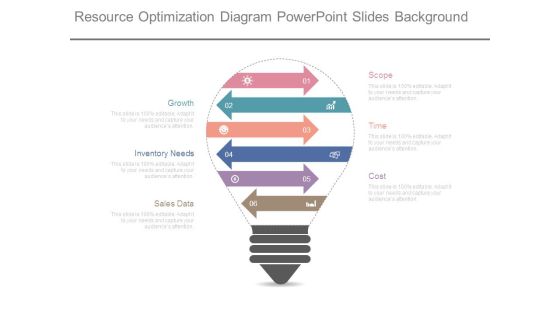
Resource Optimization Diagram Powerpoint Slides Background
This is a resource optimization diagram powerpoint slides background. This is a six stage process. The stages in this process are scope, time, cost, growth, inventory needs, sales data.
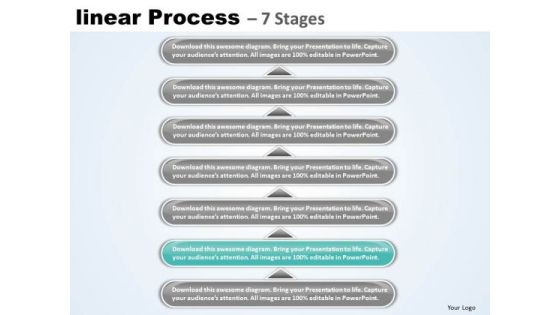
Usa Ppt Linear Process 7 Phase Diagram Project Management PowerPoint 3 Graphic
USA PPT linear process 7 phase diagram project management powerpoint 3 Graphic-This slide is an excellent backdrop for you to enlighten your audience on the process you have gone through and the vision you have for the future. Narrow them down and prove their viability to help your organization -USA PPT linear process 7 phase diagram project management powerpoint 3 Graphic-Abstract, Achievement, Adding, Analyzing, Arrow, Art, Background, Blank, Blue, Business, Chart, Color, Colorful, Cycle, Data, Design, Diagram, Element, Flow, Graph, Graphic, Gray, Green, Icon, Linear, Management, Market, Numbers, Percent, Process, Project, Round, Stock, Success
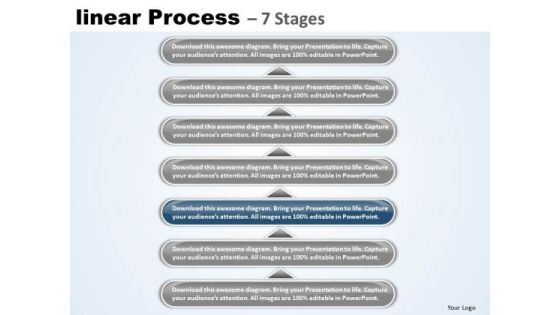
Usa Ppt Linear Process 7 Phase Diagram Project Management PowerPoint 4 Graphic
USA PPT linear process 7 phase diagram project management powerpoint 4 Graphic-Outline the path you have in mind in order to boost sales and stay ahead of the competition enhancing your corporate reputation as you go along the road to success. Now use this slide to transmit this clarity of purpose onto the eager minds of your team.-USA PPT linear process 7 phase diagram project management powerpoint 4 Graphic-Abstract, Achievement, Adding, Analyzing, Arrow, Art, Background, Blank, Blue, Business, Chart, Color, Colorful, Cycle, Data, Design, Diagram, Element, Flow, Graph, Graphic, Gray, Green, Icon, Linear, Management, Market, Numbers, Percent, Process, Project, Round, Stock, Success

Weekly Sales Performance Highlights With Product Share Ppt File Information PDF
This graph or chart is linked to excel, and changes automatically based on data. Just left click on it and select Edit Data. Pitch your topic with ease and precision using this Weekly Sales Performance Highlights With Product Share Ppt File Information PDF. This layout presents information on Dashboard Summary, Weekly Sale, Product Share. It is also available for immediate download and adjustment. So, changes can be made in the color, design, graphics or any other component to create a unique layout.
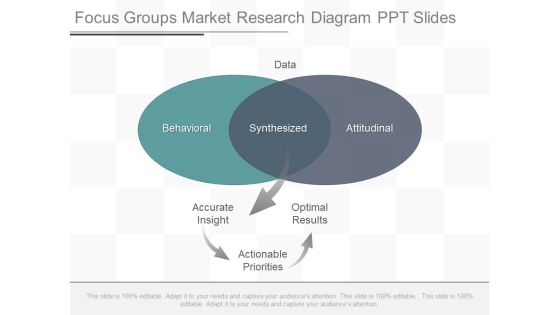
Focus Groups Market Research Diagram Ppt Slides
This is a focus groups market research diagram ppt slides. This is a two stage process. The stages in this process are data, behavioral, synthesized, attitudinal, accurate insight, optimal results, actionable priorities.
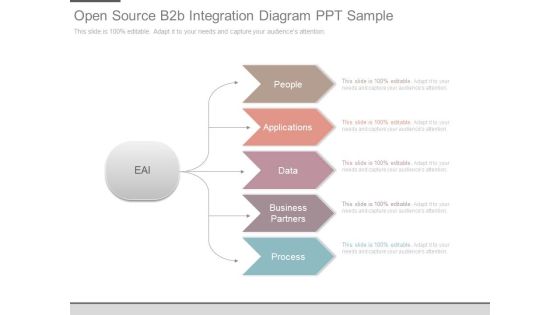
Open Source B2b Integration Diagram Ppt Sample
This is a open source b2b integration diagram ppt sample. This is a five stage process. The stages in this process are eai, people, applications, data, business partners, process.
Example Of Online Mapping Diagram Powerpoint Slides
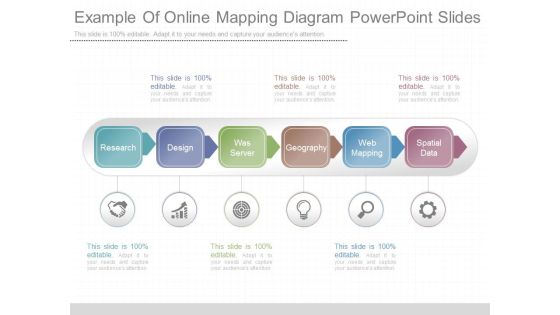
This is a example of online mapping diagram powerpoint slides. This is a six stage process. The stages in this process are research, design, was server, geography, web mapping, spatial data.
Multi Medium Evaluation Diagram Powerpoint Slide Images
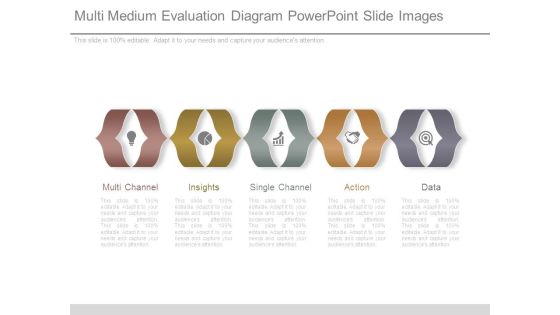
This is a multi medium evaluation diagram powerpoint slide images. This is a five stage process. The stages in this process are multi channel, insights, single channel, action, data.

Moving Inventory Checklist Diagram Presentation Pictures
This is a moving inventory checklist diagram presentation pictures. This is a five stage process. The stages in this process are store inventory data, set order quantities, logistics, consumer, supplier.

Sop Strategic Plan Ppt Diagram Ppt Example
This is a sop strategic plan ppt diagram ppt example. This is a six stage process. The stages in this process are demand planning, inventory and supply planning, strategic plans, broad capacity planning, master planning, gather data.

Alertness Establishment Strategy Diagram Sample Ppt Files
This is a alertness establishment strategy diagram sample ppt files. This is a five stage process. The stages in this process are self awareness, sensory data, feeling, thoughts, areas of development.
Web Analytics Process Diagram Presentation Backgrounds
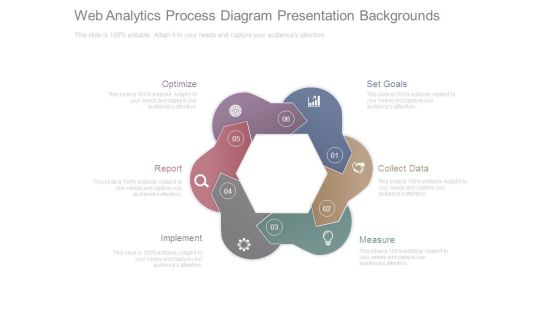
This is a web analytics process diagram presentation backgrounds. This is a six stage process. The stages in this process are optimize, report, implement, measure, collect data, set goals.

Analysis Plan For E Commerce Promotion Tactics Multistep Process To Conduct Social Media Audit Themes PDF
This slide reflects the multistep process to effectively conduct the social media audit. The major steps discussed here gather data, set performance benchmarks, analyze data, highlight gaps and recommendations for improvements. This slide reflects the multistep process to effectively conduct the social media audit. The major steps discussed here gather data, set performance benchmarks, analyze data, highlight gaps and recommendations for improvements. Want to ace your presentation in front of a live audience Our Analysis Plan For E Commerce Promotion Tactics Multistep Process To Conduct Social Media Audit Themes PDF can help you do that by engaging all the users towards you. Slidegeeks experts have put their efforts and expertise into creating these impeccable powerpoint presentations so that you can communicate your ideas clearly. Moreover, all the templates are customizable, and easy to edit and downloadable. Use these for both personal and commercial use.

Customer Acquisition Management Strategies Ppt Example File
This is a customer acquisition management strategies ppt example file. This is a four stage process. The stages in this process are build connections, assess specific needs of project, response management, execute campaigns, end to end audience engagement, customer acquisition and retention, data.
Business Benchmarking Diagram Example Of Ppt Presentation
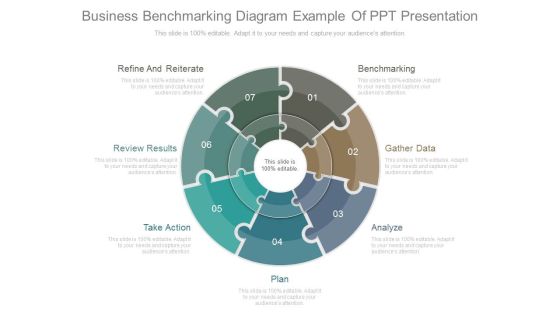
This is a business benchmarking diagram example of ppt presentation. This is a seven stage process. The stages in this process are refine and reiterate, review results, take action, plan, analyze, gather data, benchmarking.

Strategic Promotions Ppt Diagram Powerpoint Topics
This is a strategic promotions ppt diagram powerpoint topics. This is a seven stage process. The stages in this process are brand identity, new market penetration, develop vision, research best practices, long term planning, short term planning, synthesize data.
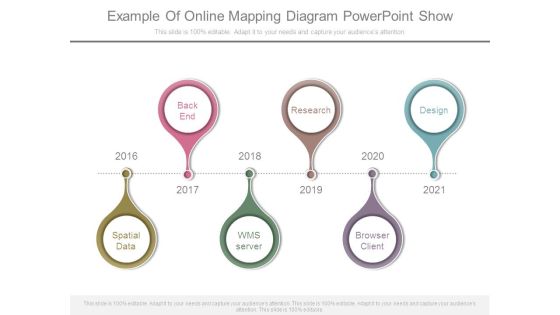
Example Of Online Mapping Diagram Powerpoint Show
This is a example of online mapping diagram powerpoint show. This is a six stage process. The stages in this process are back end, research, design, spatial data, wms server, browser client.
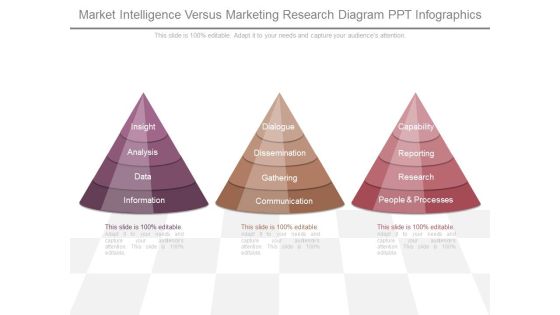
Market Intelligence Versus Marketing Research Diagram Ppt Infographics
This is a market intelligence versus marketing research diagram ppt infographics. This is a three stage process. The stages in this process are insight, analysis, data, information, dialogue, dissemination, gathering, communication, capability, reporting, research, people and processes.

Standards For Web Intelligence Sample Diagram Ppt Powerpoint Slides
This is a standards for web intelligence sample diagram ppt powerpoint slides. This is a five stage process. The stages in this process are web, web data, information, knowledge, wisdom.
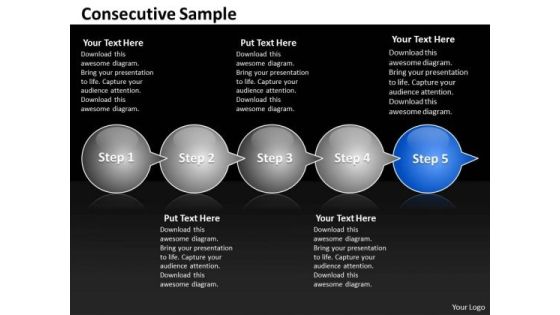
Ppt Consecutive Sample Of 5 Steps Through Curved Arrows PowerPoint 2010 Templates
PPT consecutive sample of 5 steps through curved arrows powerpoint 2010 Templates-The above template displays a diagram of circles connected with arrows. This is a graphic organizer for recording related ideas about a concept. It can be used to emphasize direction of movement and interconnections of stages in a flow. Deliver amazing presentations to mesmerize your audience.-PPT consecutive sample of 5 steps through curved arrows powerpoint 2010 Templates-3d, Abstract, Arrow, Circle, Circular, Click, Computer, Data, Direction, Graphic, Icon, Illustration, Insignia, Intention, Internet, Isolated, Label, Mail, Mascot, Media, Menu, Motion, Page, Pushing, Search, Shiny, Sign, Simple, Symbol
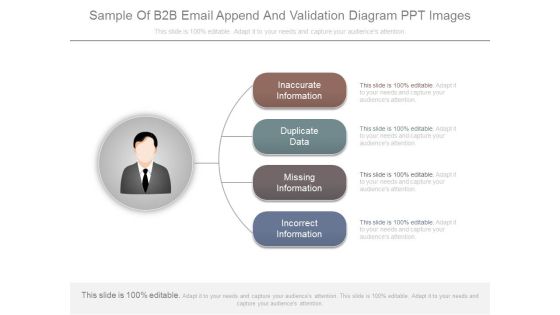
Sample Of B2b Email Append And Validation Diagram Ppt Images
This is a sample of b2b email append and validation diagram ppt images. This is a four stage process. The stages in this process are inaccurate information, duplicate data, missing information, incorrect information.

Help Desk Call Centre Service Level Agreement KPI Dashboard Pictures PDF
This graph or chart is linked to excel, and changes automatically based on data. Just left click on it and select Edit Data. Showcasing this set of slides titled Help Desk Call Centre Service Level Agreement KPI Dashboard Pictures PDF. The topics addressed in these templates are Call Type Today, Occupancy Today, Call Summary Today. All the content presented in this PPT design is completely editable. Download it and make adjustments in color, background, font etc. as per your unique business setting.

Doughnut Graph Depicting Time Spent On Multiple Project Activities Microsoft PDF
This graph or chart is linked to excel, and changes automatically based on data. Just left click on it and select Edit Data. Showcasing this set of slides titled Doughnut Graph Depicting Time Spent On Multiple Project Activities Microsoft PDF. The topics addressed in these templates are Website Development, IT Incident Management, Portfolio Management. All the content presented in this PPT design is completely editable. Download it and make adjustments in color, background, font etc. as per your unique business setting.
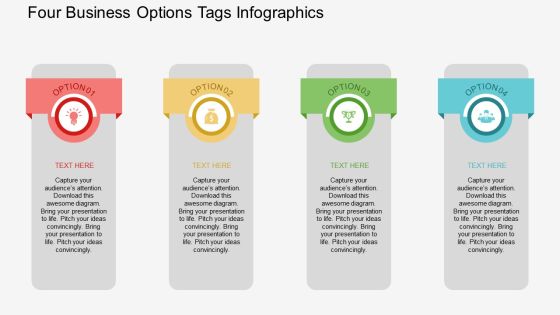
Four Business Options Tags Infographics Powerpoint Template
The above PowerPoint slide displays four options tags infographic. This PowerPoint diagram helps to summarize complex business data. Adjust the above diagram in your business presentations to visually support your content.

Finance Metrics Dashboard Indicating Portfolio Performance Microsoft PDF
This graph or chart is linked to excel, and changes automatically based on data. Just left click on it and select edit data. Pitch your topic with ease and precision using this Finance Metrics Dashboard Indicating Portfolio Performance Microsoft PDF. This layout presents information on Portfolio Performance Portfolio, Asset Management Manager, Top 10 Assets. It is also available for immediate download and adjustment. So, changes can be made in the color, design, graphics or any other component to create a unique layout.
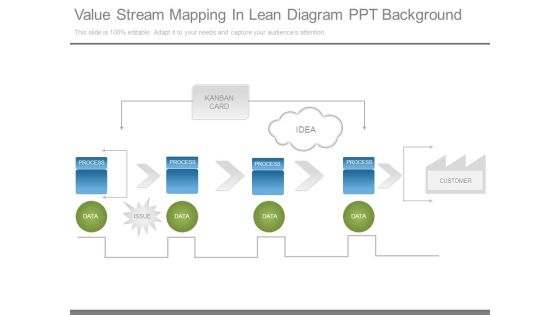
Value Stream Mapping In Lean Diagram Ppt Background
This is a value stream mapping in lean diagram ppt background. This is a four stage process. The stages in this process are kanban card, idea, process, customer, data, issue.
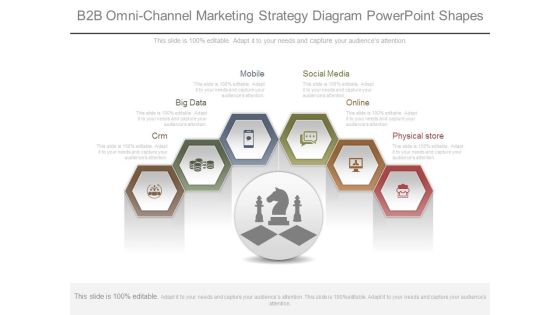
B2b Omni Channel Marketing Strategy Diagram Powerpoint Shapes
This is a b2b omni channel marketing strategy diagram powerpoint shapes. This is a six stage process. The stages in this process are crm, big data, mobile, social media, online, physical store.
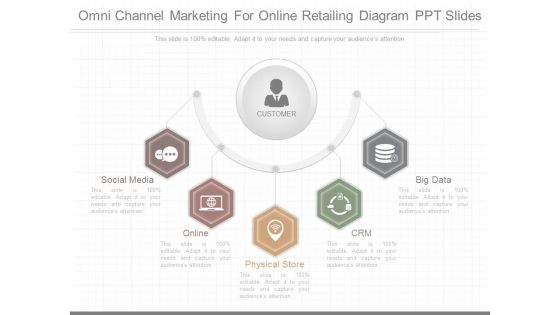
Omni Channel Marketing For Online Retailing Diagram Ppt Slides
This is a omni channel marketing for online retailing diagram ppt slides. This is a five stage process. The stages in this process are social media, online, physical store, crm, big data.
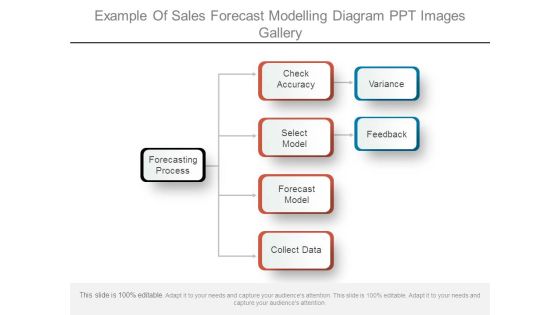
Example Of Sales Forecast Modelling Diagram Ppt Images Gallery
This is a example of sales forecast modelling diagram ppt images gallery. This is a three stage process. The stages in this process are forecasting process, check accuracy, select model, forecast model, collect data, variance, feedback.

Supplier Scorecard Retail Supplier Scorecard For Evaluating Risk Compliance Clipart PDF
This graph or chart is linked to excel, and changes automatically based on data. Just left click on it and select Edit Data. Deliver and pitch your topic in the best possible manner with this supplier scorecard retail supplier scorecard for evaluating risk compliance clipart pdf. Use them to share invaluable insights on risk summary, risk category, vendors evaluated, low, medium, high and impress your audience. This template can be altered and modified as per your expectations. So, grab it now.

IT Security Evaluation Scorecard With Ip Availability Ppt Pictures Portrait PDF
This graph or chart is linked to excel, and changes automatically based on data. Just left click on it and select Edit Data. Deliver and pitch your topic in the best possible manner with this IT Security Evaluation Scorecard With Ip Availability Ppt Pictures Portrait PDF. Use them to share invaluable insights on Devices Memory Utilization, Interfaces Errors Discards, IP Availability Summary and impress your audience. This template can be altered and modified as per your expectations. So, grab it now.

IT Security Evaluation Scorecard With Server Status Ppt Professional Images PDF
This graph or chart is linked to excel, and changes automatically based on data. Just left click on it and select Edit Data. Deliver an awe inspiring pitch with this creative IT Security Evaluation Scorecard With Server Status Ppt Professional Images PDF bundle. Topics like Operations Status Tool, Management Services Managed can be discussed with this completely editable template. It is available for immediate download depending on the needs and requirements of the user.
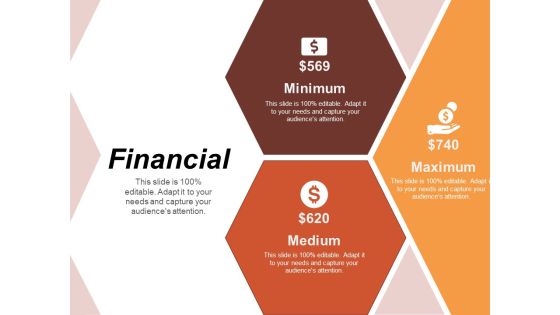
Financial Risk Estimator Ppt PowerPoint Presentation Slides Mockup
This is a financial risk estimator ppt powerpoint presentation slides mockup. This is a three stage process. The stages in this process are business, management, strategy, analysis, icons.
