AI PPT Maker
Templates
PPT Bundles
Design Services
Business PPTs
Business Plan
Management
Strategy
Introduction PPT
Roadmap
Self Introduction
Timelines
Process
Marketing
Agenda
Technology
Medical
Startup Business Plan
Cyber Security
Dashboards
SWOT
Proposals
Education
Pitch Deck
Digital Marketing
KPIs
Project Management
Product Management
Artificial Intelligence
Target Market
Communication
Supply Chain
Google Slides
Research Services
 One Pagers
All Categories
-
Home
- Customer Favorites
- Data Governance Icon
Data Governance Icon

Alternative Workplace Strategy Diagram Ppt Sample
This is a alternative workplace strategy diagram ppt sample. This is a five stage process. The stages in this process are data exploration, develop the strategy, build a business case, develop implement, evaluate and improve.
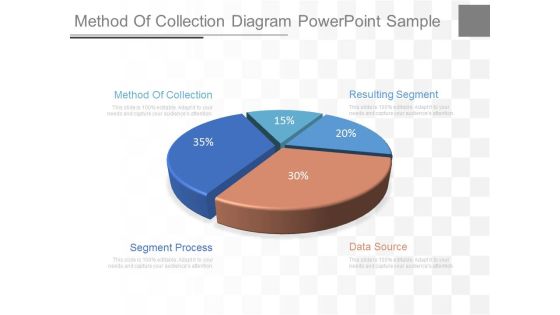
Method Of Collection Diagram Powerpoint Sample
This is a method of collection diagram powerpoint sample. This is a five stage process. The stages in this process are method of collection, segment process, data source, resulting segment.
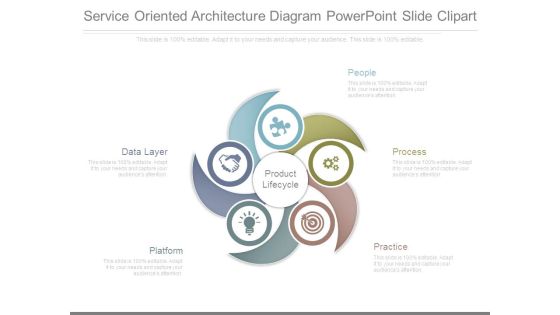
Service Oriented Architecture Diagram Powerpoint Slide Clipart
This is a service oriented architecture diagram powerpoint slide clipart. This is a five stage process. The stages in this process are product lifecycle, data layer, platform, people, process, practice.
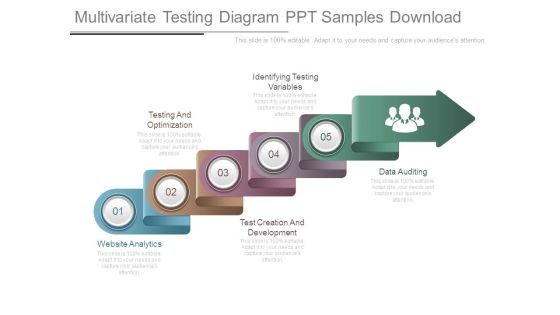
Multivariate Testing Diagram Ppt Samples Download
This is a multivariate testing diagram ppt samples download. This is a five stage process. The stages in this process are website analytics, testing and optimization, test creation and development, identifying testing variables, data auditing.

Strategic Planning Decisions Diagram Powerpoint Presentation
This is a strategic planning decisions diagram powerpoint presentation. This is a eight stage process. The stages in this process are data sheet, references, pricing, social media, call guide, sales presentation, demo, website.
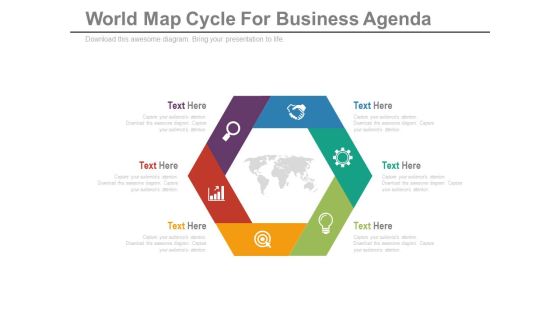
Diagram For Global Business Strategy Powerpoint Template
Our above slide contains hexagonal infographic diagram. This PowerPoint template helps to display global business strategy. Use this diagram to impart more clarity to data and to create more sound impact on viewers.
Marketing And Sales Tools Diagram Sample Ppt Files
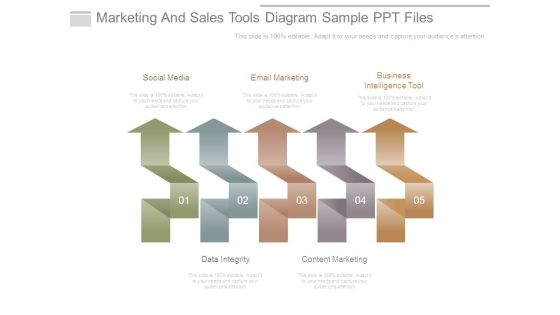
This is a marketing and sales tools diagram sample ppt files. This is a five stage process. The stages in this process are social media, email marketing, business intelligence tool, data integrity, content marketing.

Abc Steps For Corporate Entrepreneurship Powerpoint Template
Our above PPT slide contains graphics of ABC steps chart. This business diagram helps to depict concept of corporate entrepreneurship. Use this diagram to impart more clarity to data and to create more sound impact on viewers.

Cycle Of Cross Media Overview Diagram Ppt Slides
This is a cycle of cross media overview diagram ppt slides. This is a five stage process. The stages in this process are email, sms, mms text messaging, rich media, landing pages and micro sites, variable data print.

Board With Bar Graph For Financial Analysis Powerpoint Slides
You can download this PowerPoint template to display statistical data and analysis. This PPT slide contains display board with bar graph. Draw an innovative business idea using this professional diagram.

Desktop Security Management Prepare And Deploy Strong It Policies Template PDF
This slide represents the value of having strong IT policies within an organization regarding software, hardware, passwords, and data transfer. Deliver and pitch your topic in the best possible manner with this desktop security management prepare and deploy strong it policies template pdf. Use them to share invaluable insights on management, data, network and impress your audience. This template can be altered and modified as per your expectations. So, grab it now.
Channel Insight Pricing Diagram Example Of Ppt Presentation
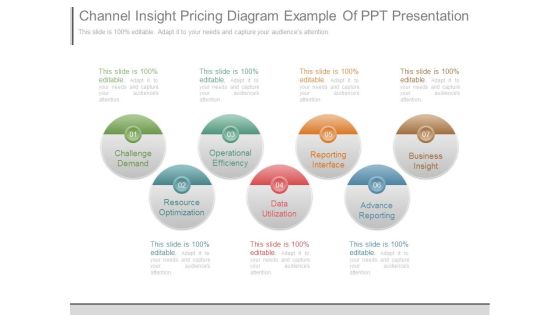
This is a channel insight pricing diagram example of ppt presentation. This is a seven stage process. The stages in this process are challenge demand, operational efficiency, reporting interface, business insight, resource optimization, data utilization, advance reporting.

B2b Integration Design Sample Diagram Example Ppt Presentation
This is a b2b integration design sample diagram example ppt presentation. This is a four stage process. The stages in this process are adapter, protocol conversion, interaction framework, data translation.
Online Promotion Playbook Google Analytics For All Web Tracking Summary PDF
This template covers tools to measure marketing analytics such as google analytics for all web tracking, google data studio to build real time reporting dashboards and google data studio reports. Deliver and pitch your topic in the best possible manner with this online promotion playbook google analytics for all web tracking summary pdf. Use them to share invaluable insights on demographics, devices, social networks and impress your audience. This template can be altered and modified as per your expectations. So, grab it now.

Circle Process Of Four Steps Powerpoint Templates
Our above slide contains graphics of bulb with success graph. It helps to exhibit planning for growth. Use this diagram to impart more clarity to data and to create more sound impact on viewers.

Dashboard With Increasing Values Powerpoint Slides
This innovative, stunningly beautiful dashboard has been designed for data visualization. It contains pie charts with increasing percentage values. This PowerPoint template helps to display your information in a useful, simple and uncluttered way.

Pyramid For Financial Accounting Information Powerpoint Slides
This PowerPoint template has been designed with graphics of pyramid chart. This PPT slide can be used to prepare presentations for profit growth report and also for financial data analysis. You can download finance PowerPoint template to prepare awesome presentations.

Sample Of Business Process Flow Diagram Presentation Slides
This is a sample of business process flow diagram presentation slides. This is a six stage process. The stages in this process are etl, sqa, business process, data warehouse, decisioning services, predictive services.
Voice Of The Customer Six Sigma Diagram Ppt Images
This is a voice of the customer six sigma diagram ppt images. This is a five stage process. The stages in this process are groups, warranty, metrics, data returns, survey, voice of customer.

Sop Strategic Plan Ppt Diagram Powerpoint Templates Microsoft
This is a sop strategic plan ppt diagram powerpoint templates microsoft. This is a six stage process. The stages in this process are production, construction, supplier, gather data and analyze, demand and supply, demand planning.
Linking Of Four Business Concepts Powerpoint Template
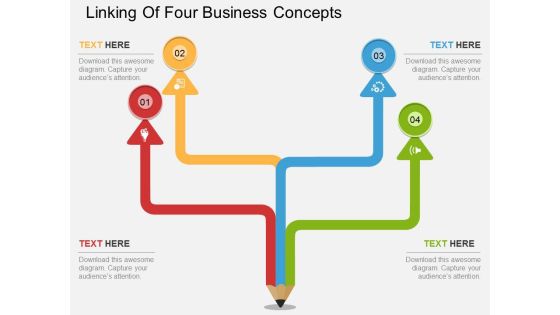
This PowerPoint template has been designed with four steps pencil diagram. This diagram is excellent visual tools to present link of steps. Download this PPT slide to explain complex data immediately and clearly.
Parts Of Marketing Plan Ppt Presentation
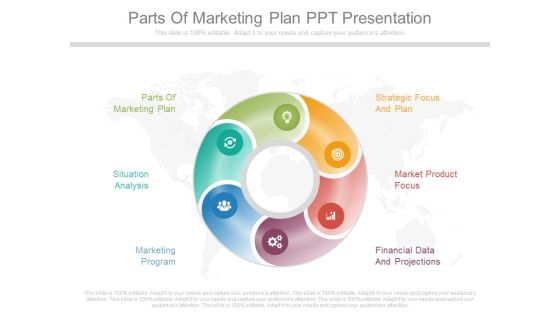
This is a parts of marketing plan ppt presentation. This is a six stage process. The stages in this process are parts of marketing plan, strategic focus and plan, situation analysis, market product focus, marketing program, financial data and projections.
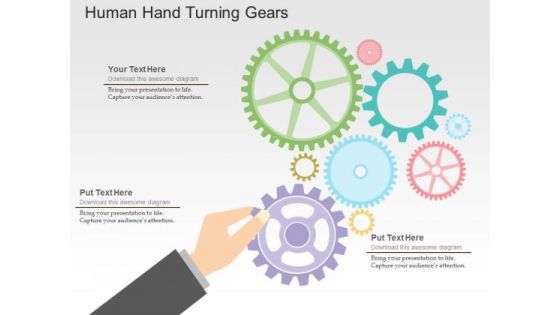
Human Hand Turning Gears PowerPoint Templates
Our above slide contains graphics of human hand turning gears. It helps to display concepts of process control and management. Use this diagram to impart more clarity to data and to create more sound impact on viewers.

Three Puzzle Steps For Business Solutions Powerpoint Slides
Our above slide contains graphics of three puzzle steps. This slide is suitable to present business management and strategy. Use this diagram to impart more clarity to data and to create more sound impact on viewers.
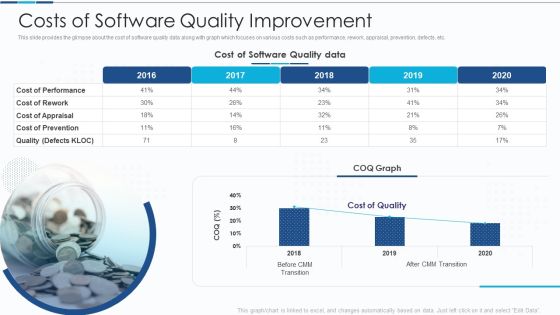
Introduction To IT Project Development Costs Of Software Quality Improvement Information PDF
This slide provides the glimpse about the cost of software quality data along with graph which focuses on various costs such as performance, rework, appraisal, prevention, defects, etc. Deliver an awe inspiring pitch with this creative introduction to it project development costs of software quality improvement information pdf bundle. Topics like cost of software, quality data, cost of performance can be discussed with this completely editable template. It is available for immediate download depending on the needs and requirements of the user.

Diamond Design With Two Levels And Eight Stages Powerpoint Template
Our above slide contains graphics of diamond design with two levels and eight stages. It helps to display concepts in visual manner. Use this diagram to impart more clarity to data and to create more sound impact on viewers.
Four Arrows For Different Process Representation Powerpoint Template
This PowerPoint template has been designed with graphics of four arrows This diagram is excellent visual tools for business presentations. Download this PPT slide to explain complex data immediately and clearly.

Five Steps Of Human Assessment Planning Process Ppt PowerPoint Presentation Outline Model PDF
This slide shows the various stages of workforce analysis planning process. These stages are strategy formulation, data collection and analysis, implementation and assessment . Presenting Five Steps Of Human Assessment Planning Process Ppt PowerPoint Presentation Outline Model PDF to dispense important information. This template comprises five stages. It also presents valuable insights into the topics including Goals Missions, Data Collection, Implementation. This is a completely customizable PowerPoint theme that can be put to use immediately. So, download it and address the topic impactfully.

Research Business Intelligence Ppt Powerpoint Templates
This is a research business intelligence ppt powerpoint templates. This is a seven stage process. The stages in this process are data warehousing, reporting, analytics, datamining, qap, epr, benchmarking.
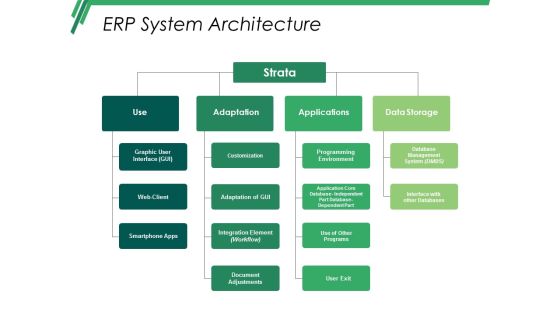
Erp System Architecture Ppt PowerPoint Presentation Pictures Master Slide
This is a erp system architecture ppt powerpoint presentation pictures master slide. This is a four stage process. The stages in this process are use, strata, adaptation, applications, data storage.

Four Tags For Strategy Planning Process Powerpoint Template
Steps for strategy planning can be explained with this diagram. This PowerPoint template contains diagram of four infographic tags. You can also use this design for data analysis in business presentations

Four Steps Circular Infographic Powerpoint Templates
Our above slide contains diagram of three stage circular infographic. It helps to display global business analysis. Use this diagram to impart more clarity to data and to create more sound impact on viewers.

Business Men On Gears Towards Success Trophy Powerpoint Templates
Our above slide contains diagram of business men on gears towards success trophy. It helps to exhibit strategy process and competition. Use this diagram to impart more clarity to data and to create more sound impact on viewers.

Circles With Percentage Values Powerpoint Templates
This PowerPoint template displays circles with percentage values. This business diagram is suitable for financial data analysis. Use this business diagram slide to highlight the key issues of your presentation.

Bar Graph For Marketing Research Process Powerpoint Slides
This PowerPoint template has been designed with diagram of bar graph. This PPT slide can be used to prepare presentations for profit growth report and also for financial data analysis. You can download finance PowerPoint template to prepare awesome presentations.

Four Options Zigzag Infographics Powerpoint Template
Emphatically define your message with our above template which contains four options zigzag infographic. This business diagram may be used to plot data series. Deliver amazing presentations to mesmerize your audience.

Colorful Circle Arrow Design Powerpoint Template
Our above PPT slide contains circular arrow design. This business diagram helps to exhibit process flow. Use this diagram to impart more clarity to data and to create more sound impact on viewers.
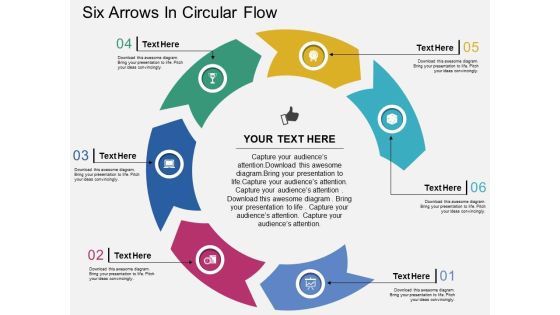
Six Arrows In Circular Flow Powerpoint Templates
Our above PPT slide contains graphics of circular diagram. This business diagram helps to display outline of business plan. Use this template to impart more clarity to data and to create more sound impact on viewers.

Arrow In Labyrinth Moving Towards Year 2016 Powerpoint Templates
Our above slide contains graphics of labyrinth with arrow on 2016 and globe. It helps to display concept of global business strategy. Use this diagram to impart more clarity to data and to create more sound impact on viewers.
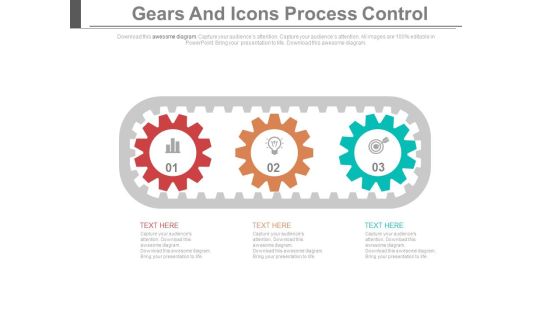
Three Gears Steps For Innovative Process Powerpoint Template
This PowerPoint slide contains graphics of three gears steps. It helps to exhibit innovative process steps. Use this diagram to impart more clarity to data and to create more sound impact on viewers.

Cylinder With Four Corporate Marketing Steps Powerpoint Template
Our above slide contains graphics of cylinder with four text tags. It may be used to display marketing steps. Use this diagram to impart more clarity to data and to create more sound impact on viewers.
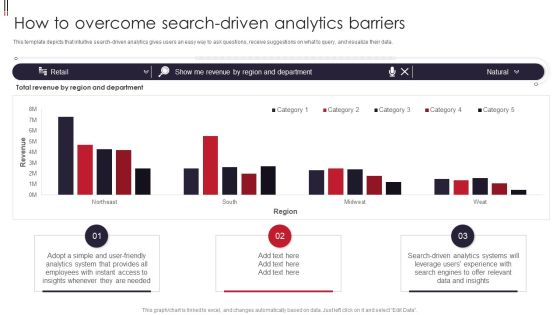
Information Visualizations Playbook How To Overcome Search Driven Analytics Barriers Guidelines PDF
This template depicts that intuitive search-driven analytics gives users an easy way to ask questions, receive suggestions on what to query, and visualize their data. Deliver an awe inspiring pitch with this creative Information Visualizations Playbook How To Overcome Search Driven Analytics Barriers Guidelines PDF bundle. Topics like Analytics System, Data And Insights, Search Driven Analytics can be discussed with this completely editable template. It is available for immediate download depending on the needs and requirements of the user.

Arrows With Circles And Idea Bulb Powerpoint Template
Our above slide contains graphics of arrows with circles and idea bulb. It helps to display innovative ideas. Use this diagram to impart more clarity to data and to create more sound impact on viewers.

Profit Growth Graph With Gears Powerpoint Template
This business slide contains profit growth graph with gears. This PowerPoint template helps to display outline of business plan. Use this diagram to impart more clarity to data and to create more sound impact on viewers.
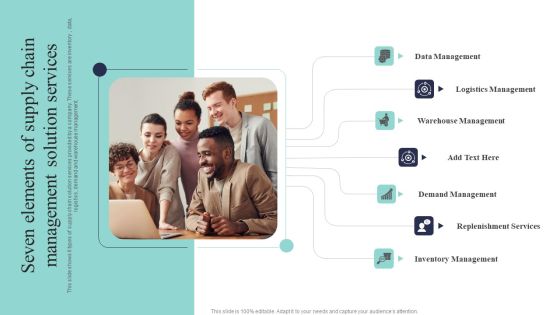
Seven Elements Of Supply Chain Management Solution Services Clipart PDF
This slide shows 6 types of supply chain solution services provided by a company. These services are inventory , data, logistics, demand and warehouse management. Presenting Seven Elements Of Supply Chain Management Solution Services Clipart PDF to dispense important information. This template comprises seven stages. It also presents valuable insights into the topics including Data Management, Logistics Management, Warehouse Management. This is a completely customizable PowerPoint theme that can be put to use immediately. So, download it and address the topic impactfully.
Coalescer Section Powerpoint Slides Design
This is a coalescer section powerpoint slides design. This is a six stage process. The stages in this process are data flow diagram, compressed air, coalescer section, fresh caustic prewash, jet fuel feed, spent caustic drain.

Jet Fuel Feed Powerpoint Slide Background Picture
This is a jet fuel feed powerpoint slide background picture. This is a six stage process. The stages in this process are data flow diagram, compressed air, coalesce section, fresh caustic prewash, jet fuel feed, spent caustic drain.
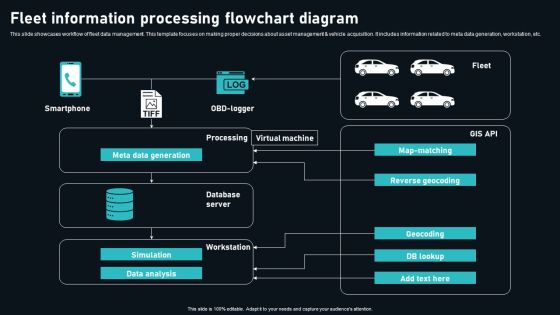
Fleet Information Processing Flowchart Diagram Themes PDF
This slide showcases workflow of fleet data management. This template focuses on making proper decisions about asset management and vehicle acquisition. It includes information related to meta data generation, workstation, etc. Showcasing this set of slides titled Fleet Information Processing Flowchart Diagram Themes PDF. The topics addressed in these templates are Smartphone, Processing, Virtual Machine. All the content presented in this PPT design is completely editable. Download it and make adjustments in color, background, font etc. as per your unique business setting.

Major Challenges Of PDSA Planning Management Cycle Background PDF
The purpose of this slide is to show majors challenges of PDSA planning cycle. It covers creating overlapping changes, requiring training and relying on data collection.Presenting Major Challenges Of PDSA Planning Management Cycle Background PDF to dispense important information. This template comprises three stages. It also presents valuable insights into the topics including Overlapping Changes, Requires Proper, Data Collection. This is a completely customizable PowerPoint theme that can be put to use immediately. So, download it and address the topic impactfully.
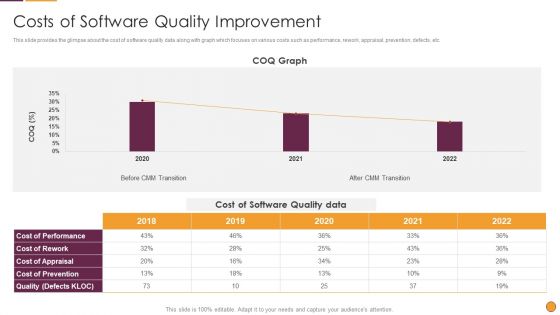
Process Enhancement Program Success Costs Of Software Quality Improvement Graphics PDF
This slide provides the glimpse about the cost of software quality data along with graph which focuses on various costs such as performance, rework, appraisal, prevention, defects, etc. Deliver an awe inspiring pitch with this creative Process Enhancement Program Success Costs Of Software Quality Improvement Graphics PDF bundle. Topics like Cost Software, Quality Data, COQ Graph can be discussed with this completely editable template. It is available for immediate download depending on the needs and requirements of the user.
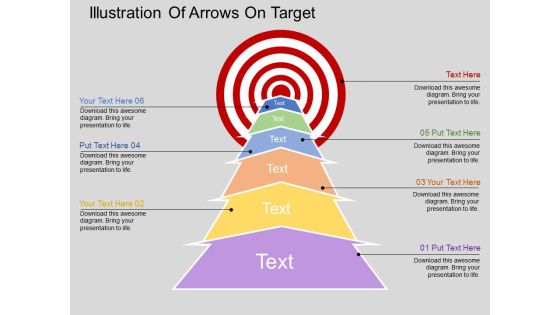
Illustration Of Arrows On Target Powerpoint Templates
Our above slide illustrates arrow steps towards target. This PowerPoint template may be used to exhibit target planning. Use this diagram to impart more clarity to data and to create more sound impact on viewers.
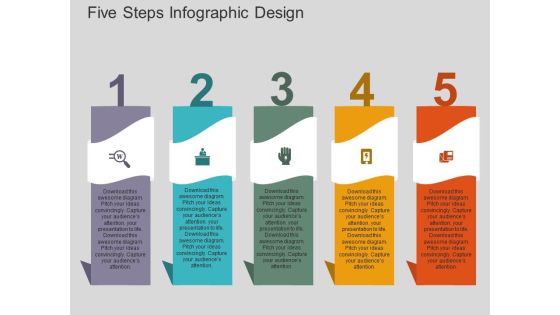
Five Steps Infographic Design Powerpoint Templates
Our above slide contains graphics of six hands around bulb. It helps to display steps of idea planning. Use this diagram to impart more clarity to data and to create more sound impact on viewers.

Global Shipping And Finance Services Powerpoint Templates
Our above PPT slide contains triangles infographic. It helps to display outline of business plan. Use this diagram to impart more clarity to data and to create more sound impact on viewers.
Compressed Air Powerpoint Templates Microsoft
This is a compressed air powerpoint templates microsoft. This is a six stage process. The stages in this process are data flow diagram, compressed air, coalescer section, fresh caustic prewash, jet fuel feed, spent caustic drain.

3D Man Moving Toward Arrow Powerpoint Template
Our above PPT slide contains graphics of 3d man moving towards arrow. This PowerPoint template helps to exhibit finding possible solutions. Use this diagram to impart more clarity to data and to create more sound impact on viewers.
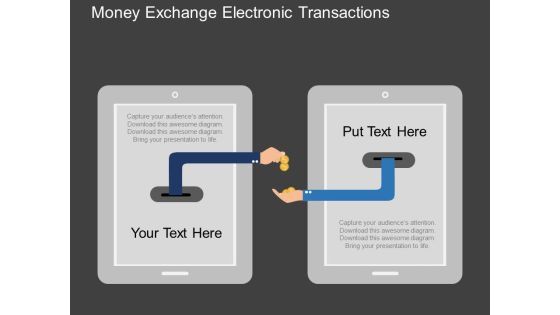
Money Exchange Electronic Transactions Powerpoint Templates
Our above slide contains illustration of money exchange. It helps to display electronic transactions. Use this diagram to impart more clarity to data and to create more sound impact on viewers.

Business Man On Road With Question Mark Powerpoint Template
Our above PPT slide contains road graphics with business man and question mark. It helps to exhibit finding possible solutions. Use this diagram to impart more clarity to data and to create more sound impact on viewers.

Financial Enterprise Technology Solutions Framework Diagrams PDF
This slide represents financial enterprise technology framework such as enterprise calculation engine, modeling, reporting, smart data integration etc that helps business in decision making. Showcasing this set of slides titled Financial Enterprise Technology Solutions Framework Diagrams PDF. The topics addressed in these templates are Business Apps, Platform Tools, Data Sources. All the content presented in this PPT design is completely editable. Download it and make adjustments in color, background, font etc. as per your unique business setting.

Information Security Prepare And Deploy Strong IT Policies Ppt Gallery Images PDF
This slide represents the value of having strong IT policies within an organization regarding software, hardware, passwords, and data transfer. Deliver an awe inspiring pitch with this creative information security prepare and deploy strong it policies ppt gallery images pdf bundle. Topics like management, network, device, data can be discussed with this completely editable template. It is available for immediate download depending on the needs and requirements of the user.

Cyber Safety Incident Management Statistics Associated To Workplace Threats Elements PDF
This slide provides details regarding statistics associated to workplace threats that firms face in terms of data records theft, workplace violence, financial phishing, etc. Deliver and pitch your topic in the best possible manner with this cyber safety incident management statistics associated to workplace threats elements pdf. Use them to share invaluable insights on cyber attacks costs, organizations, organizations have, organizations face, data records and impress your audience. This template can be altered and modified as per your expectations. So, grab it now.
