Data Governance Icon

Database Layout Tool Diagram Presentation Visuals
This is a database layout tool diagram presentation visuals. This is a three stage process. The stages in this process are database concepts, data modeling, database layout tool, database design.\n\n\n\n

Competitive Analysis Scatter Chart Radar Chart Ppt PowerPoint Presentation Model
This is a competitive analysis scatter chart radar chart ppt powerpoint presentation model. This is a eight stage process. The stages in this process are users interface, data import, example, pricing, support, update, tutorials, easy to use.
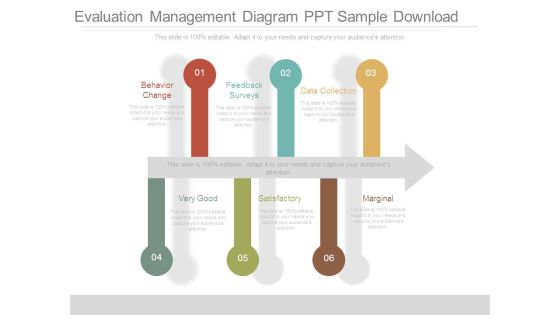
Evaluation Management Diagram Ppt Sample Download
This is a evaluation management diagram ppt sample download. This is a six stage process. The stages in this process are behavior change, feedback surveys, data collection, very good, satisfactory, marginal.
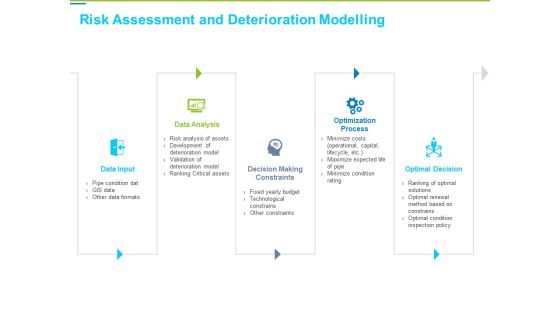
Framework Administration Risk Assessment And Deterioration Modelling Diagrams PDF
Presenting framework administration risk assessment and deterioration modelling diagrams pdf to provide visual cues and insights. Share and navigate important information on five stages that need your due attention. This template can be used to pitch topics like data input, data analysis, optimal decision, optimization process, decision making constraints. In addition, this PPT design contains high-resolution images, graphics, etc, that are easily editable and available for immediate download.

Business Management Consulting Services Diagram Powerpoint Slide
This is a business management consulting services diagram powerpoint slide. This is a eight stage process. The stages in this process are strategy, business consulting, performance, management, operations, data sciences, organization, enterprise devices.

Decision Based Approach For Information Availability Risk Assessment Summary PDF
This slide represents decision based approach for data availability risk assessment such as concept generation, problem identification, data feasibility and disposition. Presenting decision based approach for information availability risk assessment summary pdf to dispense important information. This template comprises four stages. It also presents valuable insights into the topics including risk, potential, evaluating. This is a completely customizable PowerPoint theme that can be put to use immediately. So, download it and address the topic impactfully.

Stock Photo Black Brown Pie Chart For Business Result PowerPoint Slide
This high quality image is designed with pie chart. Use this image to make business reports. Use this outstanding image in presentations relating to data analysis and reports. Go ahead and add charm to your presentations.
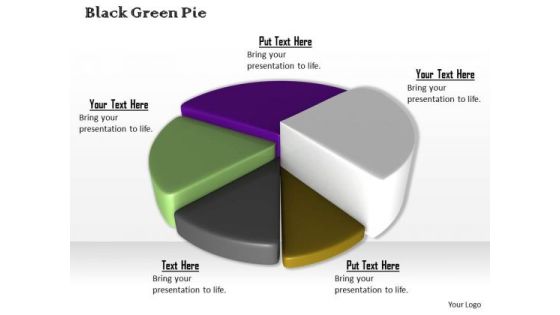
Stock Photo Colorful 3d Pie Chart For Business Result PowerPoint Slide
This high quality image is designed with pie chart. Use this image to make business reports. Use this outstanding image in presentations relating to data analysis and reports. Go ahead and add charm to your presentations.

Competitive Analysis Scatter Chart Radar Chart Ppt PowerPoint Presentation Infographics
This is a competitive analysis scatter chart radar chart ppt powerpoint presentation infographics. This is a eight stage process. The stages in this process are users interface, data import, example, pricing, support, update, tutorials, easy to use.

Marketing Tools For Client Solution Management Themes PDF
This slide depicts marketing tools for customer solution management. It provides information about live personas, audience profiling, data planning and workflow management. Presenting Marketing Tools For Client Solution Management Themes PDF to dispense important information. This template comprises four stages. It also presents valuable insights into the topics including Data Planning, Workflow Management, Audience Profiling . This is a completely customizable PowerPoint theme that can be put to use immediately. So, download it and address the topic impactfully

Process Of Sales Account Management Diagram Powerpoint Templates Download
This is a process of sales account management diagram powerpoint templates download. This is a three stage process. The stages in this process are sales account management, customer prospect data acquisition, sales account assignment, sales account planning.
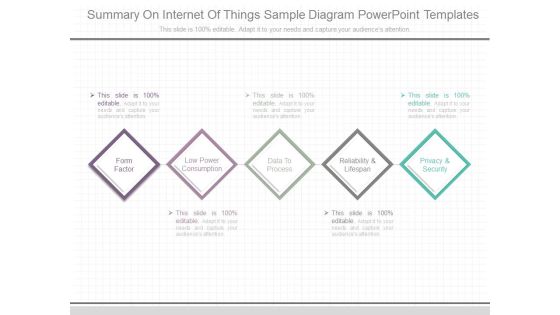
Summary On Internet Of Things Sample Diagram Powerpoint Templates
This is a summary on internet of things sample diagram powerpoint templates. This is a five stage process. The stages in this process are form factor, low power consumption, data to process, reliability and lifespan, privacy and security.
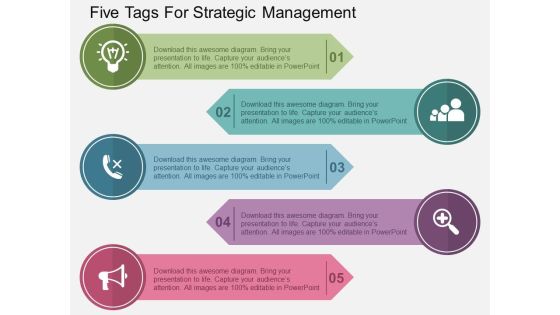
Five Tags For Strategic Management Powerpoint Templates
Our above slide contains diagram of circular infographic. It helps to exhibit six steps of goal planning. Use this diagram to impart more clarity to data and to create more sound impact on viewers.

Chart Of Four Business Steps Powerpoint Templates
This business diagram displays flow of four business steps. This editable slide is suitable to present growth management. Use this diagram for business and finance related topics and display complete data analysis in your presentation.

Six Phases Of Training Needs Assessment Professional PDF
This slide depicts the different phases for development analysis. It includes phases such as scoping, planning, data gathering, gap analysis, report preparation and presentation of finding. Presenting six phases of training needs assessment professional pdf to dispense important information. This template comprises six stages. It also presents valuable insights into the topics including planning, gap analysis, data gathering. This is a completely customizable PowerPoint theme that can be put to use immediately. So, download it and address the topic impactfully.

Arrows Infographic For Strategic Management Concept Powerpoint Template
Our above PPT slide contains four curved arrows infographic design. This business diagram helps to depict business information for strategic management. Use this diagram to impart more clarity to data and to create more sound impact on viewers.

Strategies To Improve Warehouse Inventory Management Summary PDF
This slide covers strategies to improve stock inventory management. It involves four strategies such as supply chain monitoring, efficient use of technology, data analysis and continuous improvement. Presenting Strategies To Improve Warehouse Inventory Management Summary PDF to dispense important information. This template comprises four stages. It also presents valuable insights into the topics including Supply Chain Monitoring, Data Analysis, Continuous Improvement. This is a completely customizable PowerPoint theme that can be put to use immediately. So, download it and address the topic impactfully.

Competitive Analysis Template 6 Scatter Chart Ppt PowerPoint Presentation Shapes
This is a competitive analysis template 6 scatter chart ppt powerpoint presentation shapes. This is a one stage process. The stages in this process are users interface, data import, example, pricing, support update, tutorials, easy to use.

Competitive Analysis Scatter Chart Radar Chart Ppt PowerPoint Presentation Portfolio Templates
This is a competitive analysis scatter chart radar chart ppt powerpoint presentation portfolio templates. This is a eight stage process. The stages in this process are users interface, data import, example, pricing, support.
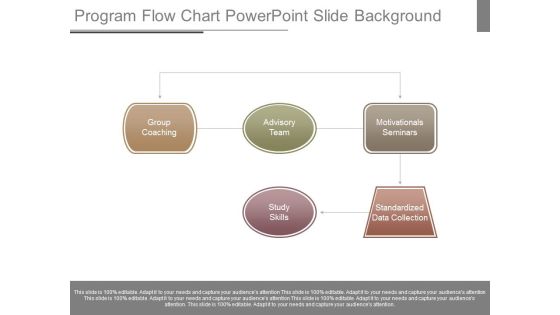
Program Flow Chart Powerpoint Slide Background
This is a program flow chart powerpoint slide background. This is a five stage process. The stages in this process are group coaching, advisory team, study skills, motivationals seminars, standardized data collection.

Competitive Analysis Template 6 Scatter Chart Ppt PowerPoint Presentation Slides
This is a competitive analysis template 6 scatter chart ppt powerpoint presentation slides. This is a eight stage process. The stages in this process are users interface, data import, example, pricing, support, update, tutorials, easy to use, table.

Competitive Analysis Template 7 Bubble Chart Ppt PowerPoint Presentation Deck
This is a competitive analysis template 7 bubble chart ppt powerpoint presentation deck. This is a six stage process. The stages in this process are users interface, data import, example, pricing, support, update, tutorials, easy to use, table.
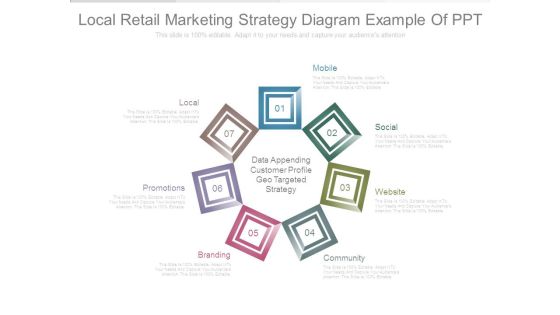
Local Retail Marketing Strategy Diagram Example Of Ppt
This is a local retail marketing strategy diagram example of ppt. This is a seven stage process. The stages in this process are local, promotions, branding, mobile, social, website, community, data appending customer profile geo targeted strategy.

Business Development Planning Template Ppt Slide
This is a business development planning template ppt slide. This is a six stage process. The stages in this process are data profiles, workshop, phased plan, key indicators, concept model, business priorities.

Business Diagram Four Staged Flag Diagram For Timeline Presentation Template
Graphic of four staged flag diagram has been used to decorate this power point template diagram. This PPT diagram contains the concept of data flow and timeline formation. Use this PPT for marketing and business related presentations.

Marketing Operating System Sample Diagram Powerpoint Presentation
This is a marketing operating system sample diagram powerpoint presentation. This is a five stage process. The stages in this process are data management, message delivery, confidentiality, partner management, directory, cross channel media, transformation, analytics and insights, delivery management, authentication.
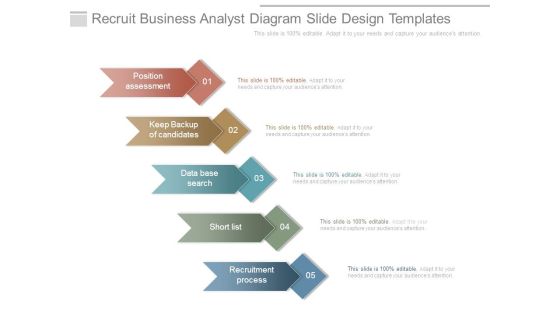
Recruit Business Analyst Diagram Slide Design Templates
This is a recruit business analyst diagram slide design templates. This is a five stage process. The stages in this process are position assessment, keep backup of candidates, data base search, short list, recruitment process.
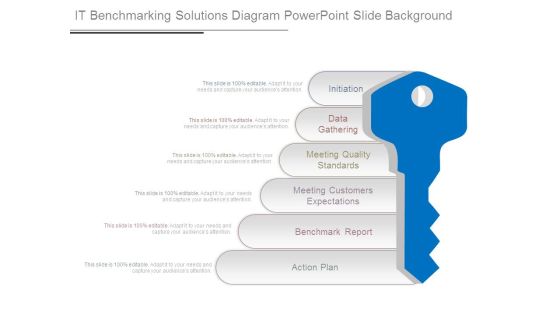
It Benchmarking Solutions Diagram Powerpoint Slide Background
This is a it benchmarking solutions diagram powerpoint slide background. This is a six stage process. The stages in this process are initiation, data gathering, meeting quality standards, meeting customers expectations, benchmark report, action plan.

Business Intelligence Ecosystem Chart Example Of Ppt Presentation
This is a business intelligence ecosystem chart example of ppt presentation. This is a eight stage process. The stages in this process are strategy, data mining, customers, market, business outcome, leadership skills, suppliers, competition.

Project Management Regulatory Compliance Report Phases Professional PDF
The following slide exhibits compliance reporting stages in project management. It provides information about project scope, planning, requirements, data management, product setup, test, live, etc. Presenting Project Management Regulatory Compliance Report Phases Professional PDF to dispense important information. This template comprises three stages. It also presents valuable insights into the topics including Plan And Requirement, Data Management, Train Project Team. This is a completely customizable PowerPoint theme that can be put to use immediately. So, download it and address the topic impactfully.

Sample Of Integrated Branding Diagram Presentation Ideas
This is a sample of integrated branding diagram presentation ideas. This is a three stage process. The stages in this process are listening and research phase, plan phase, activation phase, development phase, branding strategy, data research, optimization, report measurement.

AI Business Introduction Action Plans Summary PDF
This slide illustrates four courses of action of adopting artificial intelligence in business. It includes virtual assistance, generating insights, unlocking unstructured data and automation of manual processes. Presenting AI Business Introduction Action Plans Summary PDF to dispense important information. This template comprises four stages. It also presents valuable insights into the topics including Virtual Assistance, Generating Insights, Unlocking Unstructured Data. This is a completely customizable PowerPoint theme that can be put to use immediately. So, download it and address the topic impactfully.

Sample Of Three Types Of Internet Of Things Diagram Ppt Slides
This is a sample of three types of internet of things diagram ppt slides. This is a three stage process. The stages in this process are things with networked sensors, analytic engines, data storage.

Sample Of Dbms Model Diagram Powerpoint Slides
This is a sample of dbms model diagram powerpoint slides. This is a one stage process. The stages in this process are applications, sql, query processor, buffer manager, disk space and io manage, data files, logs, index structure.
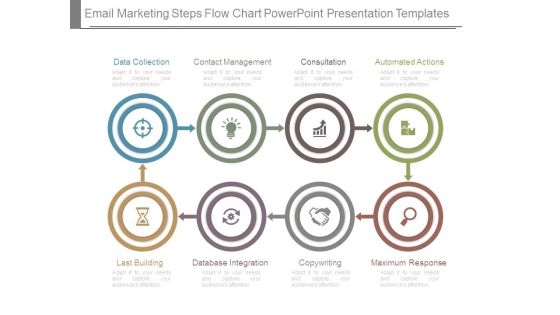
Email Marketing Steps Flow Chart Powerpoint Presentation Templates
This is a email marketing steps flow chart powerpoint presentation templates. This is a eight stage process. The stages in this process are data collection, contact management, consultation, automated actions, last building, database integration, copywriting, maximum response.
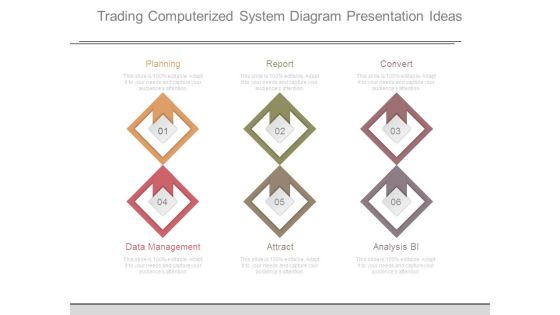
Trading Computerized System Diagram Presentation Ideas
This is a trading computerized system diagram presentation ideas. This is a six stage process. The stages in this process are planning, report, convert, data management, attract, analysis bi.

Email Marketing Guide Chart Presentation Diagrams
This is a email marketing guide chart presentation diagrams. This is a eight stage process. The stages in this process are automated actions, return on investment, maximum response, consolation, data collection, delivery optimization, list building, contact development, email marketing.

Call Centers Positive Impact On Client Satisfaction Ppt Gallery Slides PDF
Presenting call centers positive impact on client satisfaction ppt gallery slides pdf. to dispense important information. This template comprises five stages. It also presents valuable insights into the topics including provides 365 customer support, lets operator be omnipresent for your customer, easy access to customer data, securing client data on the cloud, faster customer query resolution. This is a completely customizable PowerPoint theme that can be put to use immediately. So, download it and address the topic impactfully.
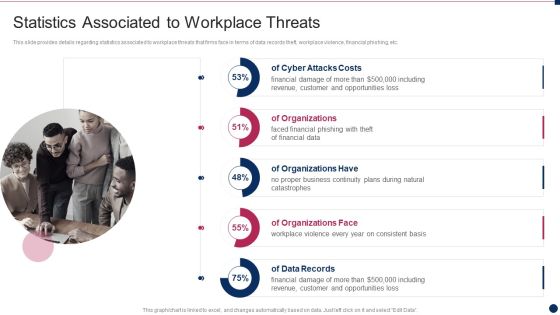
Threat Management At Workplace Statistics Associated To Workplace Threats Summary PDF
This slide provides details regarding statistics associated to workplace threats that firms face in terms of data records theft, workplace violence, financial phishing, etc. Deliver an awe inspiring pitch with this creative threat management at workplace statistics associated to workplace threats summary pdf bundle. Topics like cyber attacks costs, organization, data records can be discussed with this completely editable template. It is available for immediate download depending on the needs and requirements of the user.

Cloud Security Assessment Key Cloud Security Use Cases Diagrams PDF
This slide represents the key use cases of cloud security namely privileged account access, data exfiltration, suspicious network connections, man-in-the-cloud attack, and unsecured storage containers.Deliver and pitch your topic in the best possible manner with this Cloud Security Assessment Key Cloud Security Use Cases Diagrams PDF Use them to share invaluable insights on Account Access, Data Exfiltration, Network Connections and impress your audience. This template can be altered and modified as per your expectations. So, grab it now.
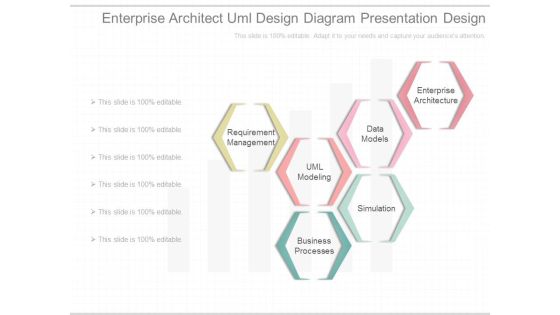
Enterprise Architect Uml Design Diagram Presentation Design
This is a enterprise architect uml design diagram presentation design. This is a six stage process. The stages in this process are requirement management, uml modeling, data models, business processes, simulation, enterprise architecture.

Finance Operations Planning Sample Diagram Ppt Example
This is a finance operations planning sample diagram ppt example. This is a six stage process. The stages in this process are consolidation, analytics, corporate, external reporting, business unit, data preparation and transfer, ledger close, management reporting.\n\n\n\n\n\n\n\n\n \n

Real Estate Development Analysis Powerpoint Slides Show
This is a real estate development analysis powerpoint slides show. This is a five stage process. The stages in this process are development analysis, financial and economic analysis, environmental data impact analysis, customer base management analysis, real estate development analysis.

Datafy Phases Of Datafication As A Use Perspective Ideas PDF
This slide represents the phases of datafication from a use perspective and the stages include domain, data generation, analyzing data and generating output, and data-driven interventions. Each phase includes four steps, such as step counter, webshop, Schiphol-asito, and predictive policing. The Datafy Phases Of Datafication As A Use Perspective Ideas PDF is a compilation of the most recent design trends as a series of slides. It is suitable for any subject or industry presentation, containing attractive visuals and photo spots for businesses to clearly express their messages. This template contains a variety of slides for the user to input data, such as structures to contrast two elements, bullet points, and slides for written information. Slidegeeks is prepared to create an impression.

Business Diagram Five Staged Circular Process Diagram For Text Representation Presentation Template
Our above slide displays Five staged circular process diagram. Download our above diagram to express information in a visual way. Use this diagram and get good comments for data related presentations.
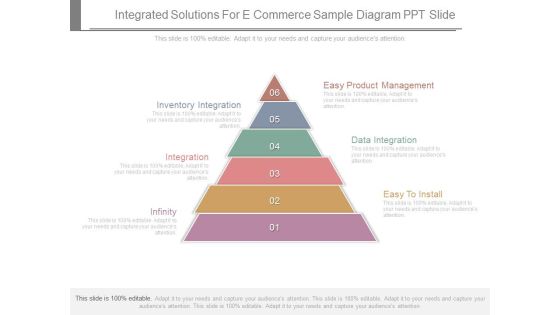
Integrated Solutions For E Commerce Sample Diagram Ppt Slide
This is a integrated solutions for e commerce sample diagram ppt slide. This is a six stage process. The stages in this process are inventory integration, integration, infinity, easy to install, data integration, easy product management.
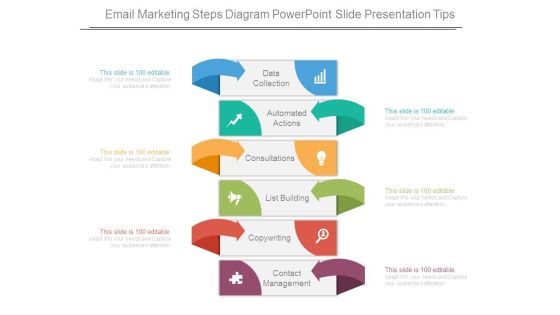
Email Marketing Steps Diagram Powerpoint Slide Presentation Tips
This is a email marketing steps diagram powerpoint slide presentation tips. This is a six stage process. The stages in this process are data collection, automated actions, consultations, list building, copywriting, contact management.

AI Playbook For Business In House AI Team Organizational Chart Download PDF
This is a AI Playbook For Business In House AI Team Organizational Chart Download PDF template with various stages. Focus and dispense information on three stages using this creative set, that comes with editable features. It contains large content boxes to add your information on topics like Senior Executive, Data Science, Team Leader, Data Analyst. You can also showcase facts, figures, and other relevant content using this PPT layout. Grab it now.

Illustration Of Save Money Concept Powerpoint Templates
This business slide has been designed with infographic square. These text boxes can be used for data representation. Use this diagram for your business presentations. Build a quality presentation for your viewers with this unique diagram.
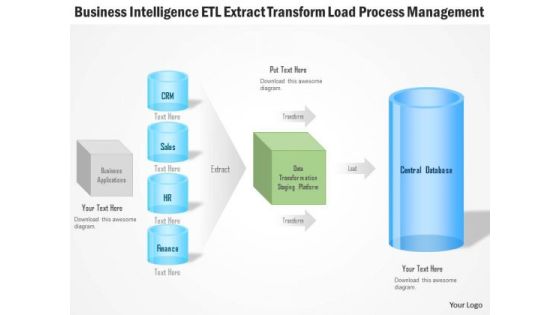
Business Diagram Business Intelligence Etl Extract Transform Load Process Management Ppt Slide
Explain the load process management and ETL extract transform with this unique PPT. This PPT contains the graphic of computer server and data base with connectivity. This PPT can be used for business intelligence related topics in any presentation.

Business Diagram Circles With Pencils For Business Structures Presentation Template
This business diagram has been designed with graphic of pencils with text circles. This slide helps to depict business data and process. Use this slide to build quality presentations for your viewers.

Introduction Of Information System Diagram Powerpoint Guide
This is a introduction of information system diagram powerpoint guide. This is a six stage process. The stages in this process are executive information systems, purpose, transaction processing systems, information processes, participants, data information.

Email Survey Service Diagram Ppt Slide Design
This is a email survey service diagram ppt slide design. This is a four stage process. The stages in this process are design, administration, data collection, report and analysis.

Business Diagram Three Staged Text Representation Diagram Presentation Template
Display the concept of data flow in any presentation with this unique power point template. This PPT contains the graphic of three staged text boxes. Use this PPT for your business and management related presentations.

Web Based Sale Solution Diagram Powerpoint Guide
This is a web based sale solution diagram powerpoint guide. This is a six stage process. The stages in this process are fool proof inventory, real time visibility, increased availability, zero maintenance, easy data administration, secure offline.

Business Diagram Four Staged Road Sign Diagram For Text Representation Presentation Template
Four staged road sign diagram has been used to design this power point template. This PPT contains the concept of text and data representation. Use this PPT and build quality presentation for your viewers.
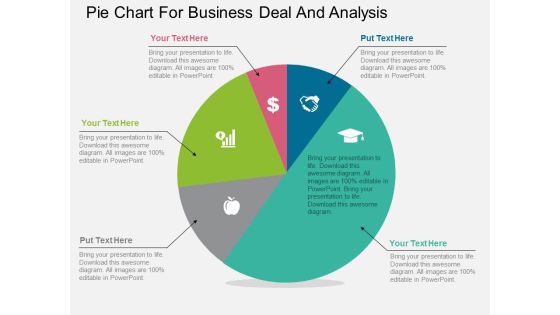
Pie Chart For Business Deal And Analysis Powerpoint Template
Our above PPT slide contains diagram of pentagon infographic. It helps to display steps of corporate marketing. Use this diagram to impart more clarity to data and to create more sound impact on viewers.

Pie Charts For Financial Ratio Analysis Powerpoint Slides
This PowerPoint template has been designed with diagram of pie charts. This PPT slide can be used to prepare presentations for profit growth report and also for financial data analysis. You can download finance PowerPoint template to prepare awesome presentations.
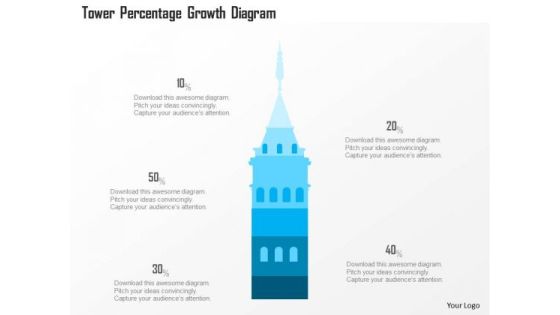
Business Diagram Tower Percentage Growth Diagram Presentation Template
This power point diagram slide has been crafted with graphic of 3d blue tower and text boxes. This PPT slide contains the concept of data and text representations. Use this PPT slide for your business and management related presentations.
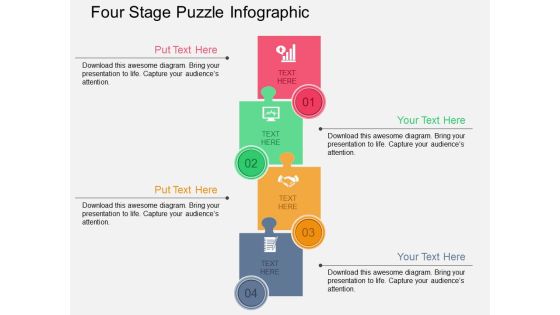
Four Stage Puzzle Infographic Powerpoint Templates
Our above slide contains diagram of puzzles infographic. It helps to exhibit business management and strategies. Use this diagram to impart more clarity to data and to create more sound impact on viewers.
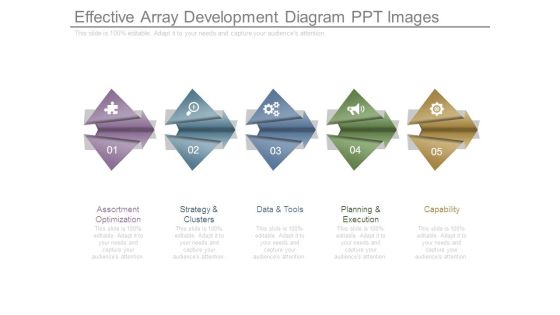
Effective Array Development Diagram Ppt Images
This is a effective array development diagram ppt images. This is a five stage process. The stages in this process are assortment optimization, strategy and clusters, data and tools, planning and execution, capability.
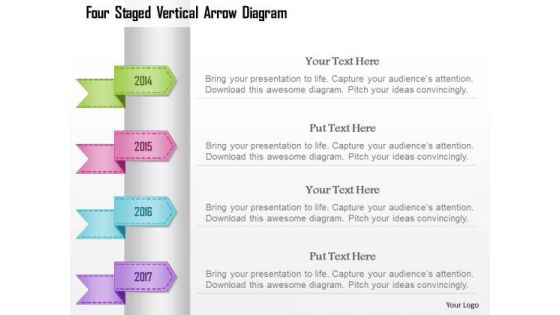
Busines Diagram Four Staged Vertical Arrow Diagram Presentation Template
Four staged vertical arrow diagram has been used to design this business diagram. This business diagram contains the concept of data representation. This pre designed high quality image slide will make your presentations simply the best.
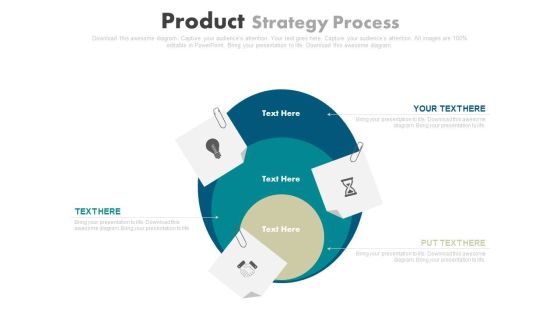
Three Steps Business Strategy Chart Powerpoint Template
This PowerPoint slide contains three steps infographic hart. It helps to exhibit business strategy steps. Use this diagram to impart more clarity to data and to create more sound impact on viewers.
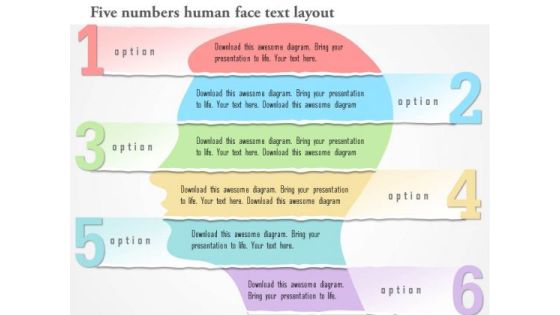
Business Diagram Six Numbers Human Face Text Layout Presentation Template
Graphic of six numeric tags and human face has been used to design this business diagram. Download our above diagram to express information in a visual way. Use this diagram and get good comments for data related presentations.

Business Diagram Five Staged Pencil Style Text Boxes Presentation Template
Our above slide displays five staged pencil style text boxes. Download our above diagram to express information in a visual way. Use this diagram and get good comments for data related presentations.

Busines Diagram Four Bulb Design For Text Representation Presentation Template
Four bulb design text diagram has been used to design this business slide. Use this diagram to display data in visual manner. This slide offers an excellent background to build professional presentations.

Business Diagram Four Staged Torn Paper For Text Display PowerPoint Template
Four staged torn paper style text boxes has been used to design this power point template. This PPT contains the concept of text representation for business process. Use this PPT and build quality presentation for data and process related topics.

Infographic Diagram With Percentage Values Powerpoint Template
Visually support your presentation with our above template containing infographic diagram with percentage values. This diagram is excellent visual tools for explaining huge amounts of information where complex data needs to be explained immediately and clearly.

Business Diagram Highway Signboard With Road And Text Boxes PowerPoint Template
Graphic of highway signboard with road and text has been used to craft this power point template diagram. This PPT contains the concept of transportation and data representation. Use this PPT for your business and management related presentations.

Best Practices For Progress Summary Creation Ideas PDF
Following slide showcases best practices for creating progress report which help to manage projects and secure businesses. It presents information related to data usage, transparency, etc. Presenting Best Practices For Progress Summary Creation Ideas PDF to dispense important information. This template comprises six stages. It also presents valuable insights into the topics including Use Data, Be Transparent, Include Company Department Goals. This is a completely customizable PowerPoint theme that can be put to use immediately. So, download it and address the topic impactfully.
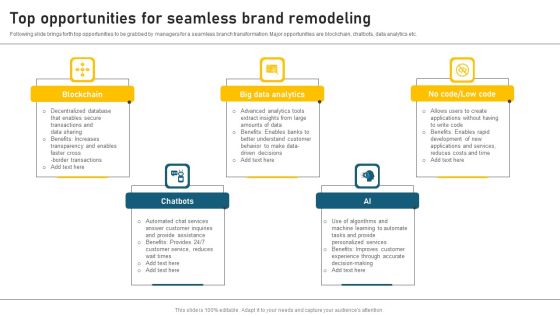
Top Opportunities For Seamless Brand Remodeling Summary PDF
Following slide brings forth top opportunities to be grabbed by managers for a seamless branch transformation. Major opportunities are blockchain, chatbots, data analytics etc. Presenting Top Opportunities For Seamless Brand Remodeling Summary PDF to dispense important information. This template comprises Five stages. It also presents valuable insights into the topics including Blockchain, Big Data Analytics, Chatbots. This is a completely customizable PowerPoint theme that can be put to use immediately. So, download it and address the topic impactfully.
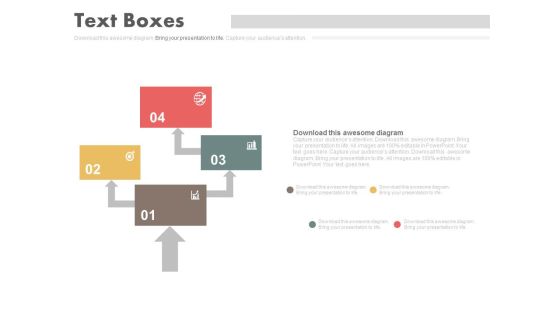
Four Steps Arrow Chart Design Powerpoint Slides
This PowerPoint template has been designed with four steps arrow chart. This PPT slide can be used to prepare presentations for marketing reports and also for financial data analysis. You can download finance PowerPoint template to prepare awesome presentations.
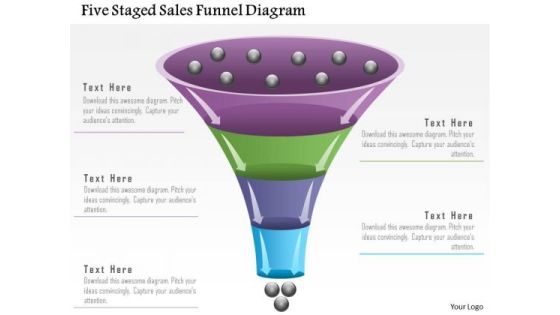
Business Diagram Five Staged Sales Funnel Diagram Presentation Template
Our above slide displays five staged sales funnel diagram. Download our above diagram to express information in a visual way. Use this diagram and get good comments for data related presentations.
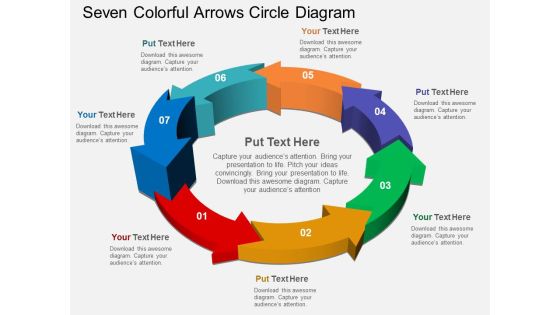
Seven Colorful Arrows Circle Diagram Powerpoint Templates
Our above PPT slide contains arrows infographic. It helps to display outline of business plan. Use this diagram to impart more clarity to data and to create more sound impact on viewers.

Six Sigma Strands Chart Ppt Examples Slides
This is a six sigma strands chart ppt examples slides. This is a six stage process. The stages in this process are bottom line, trained individuals, data driven approach, customer focused, project by project, engagement, benefits of six sigma.
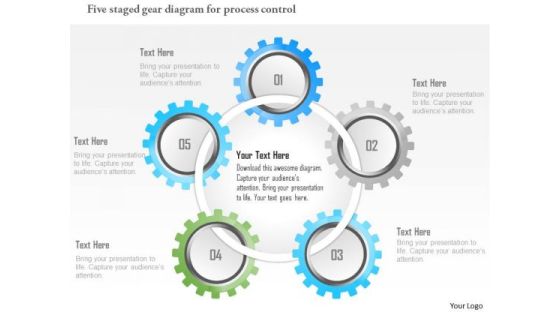
Business Diagram Five Staged Gear Diagram For Process Control Presentation Template
Our above slide displays five staged gear diagram for process control. Download our above diagram to express information in a visual way. Use this diagram and get good comments for data related presentations.

Competitive Analysis Scatter Chart Template 2 Ppt PowerPoint Presentation Files
This is a competitive analysis scatter chart template 2 ppt powerpoint presentation files. This is a nine stage process. The stages in this process are users interface, data import, example, pricing, support, update.

Real Time Business Intelligence Diagram Powerpoint Slide Ideas
This is a real time business intelligence diagram powerpoint slide ideas. This is a seven stage process. The stages in this process are data warehousing, reporting, analytics, datamining, qap, epr, benchmarking.

Busines Diagram 3d Pencil With Multicolor And Text Boxes Presentation Template
This business diagram displays four text boxes around a pencil. This professional slide can be used for data display in visual manner. Download this diagram for your school and education related presentations.

Circle Diagram For Business Marketing Mix Powerpoint Slides
This PowerPoint template has been designed with nine steps circle chart. This PPT slide can be used to prepare presentations for profit growth report and also for financial data analysis. You can download finance PowerPoint template to prepare awesome presentations.

Database Platform Powerpoint Slides Themes
This is a database platform powerpoint slides themes. This is a four stage process. The stages in this process are database platform, data warehouse platform, security and identity, development.
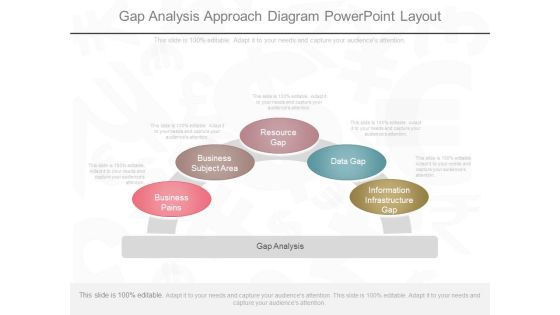
Gap Analysis Approach Diagram Powerpoint Layout
This is a gap analysis approach diagram powerpoint layout. This is a five stage process. The stages in this process are information infrastructure gap, data gap, resource gap, business subject area, business pains.
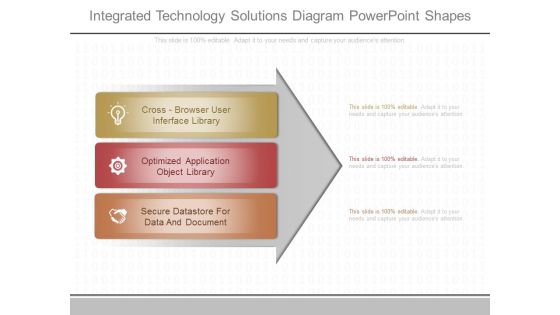
Integrated Technology Solutions Diagram Powerpoint Shapes
This is a integrated technology solutions diagram powerpoint shapes. This is a three stage process. The stages in this process are cross browser user interface library, optimized application object library, secure datastore for data and document.
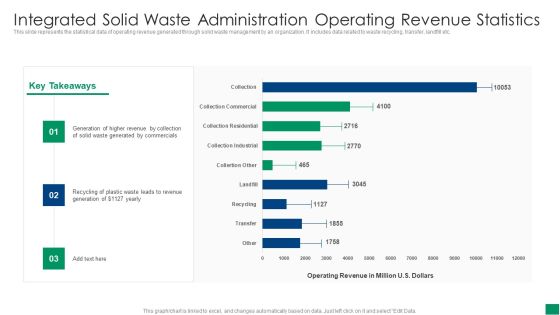
Integrated Solid Waste Administration Operating Revenue Statistics Formats PDF
This slide represents the statistical data of operating revenue generated through solid waste management by an organization. It includes data related to waste recycling, transfer, landfill etc. Pitch your topic with ease and precision using this Integrated Solid Waste Administration Operating Revenue Statistics Formats PDF. This layout presents information on Revenue, Recycling, Commercials. It is also available for immediate download and adjustment. So, changes can be made in the color, design, graphics or any other component to create a unique layout.

Four Horizontal Text Banners Powerpoint Template
This PowerPoint template has been designed with four horizontal text banners. This diagram is excellent visual tools for business presentations. Download this PPT slide to explain complex data immediately and clearly.

Market Research And Analysis Diagram Ppt Sample
This is a market research and analysis diagram ppt sample. This is a five stage process. The stages in this process are location analysis, data mining, sowt analysis, market research and analysis, competition analysis, marketing potential.
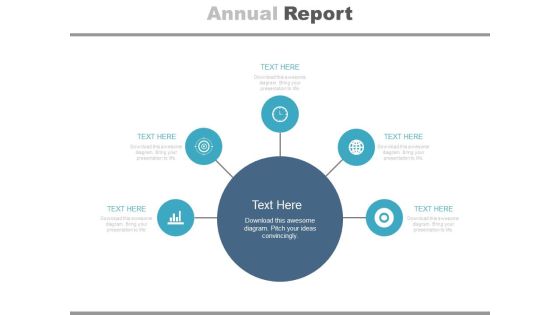
Diagram For Market Research Analysis Powerpoint Slides
This PowerPoint template has been designed with circular infographic diagram. It can be used to display steps for market research and also for financial data analysis. You can download finance PowerPoint template to prepare awesome presentations.
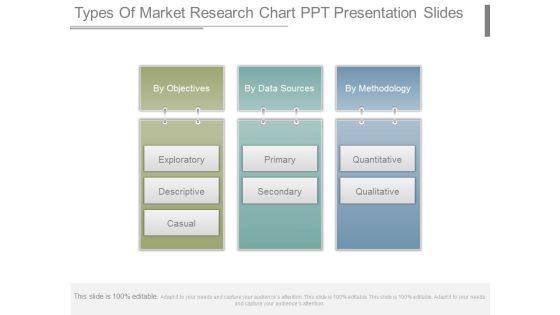
Types Of Market Research Chart Ppt Presentation Slides
This is a types of market research chart ppt presentation slides. This is a three stage process. The stages in this process are by objectives, exploratory, descriptive, causal, by data sources, primary, secondary, by methodology, quantitative, qualitative.

Business Diagram Blue Cloud With Database Server And Laptop PowerPoint Template
Graphic of blue cloud and server has been used to craft this power point template. This PPT contains the concept of database management. Use this PPT diagram for your data and database related topics in any technical presentations.
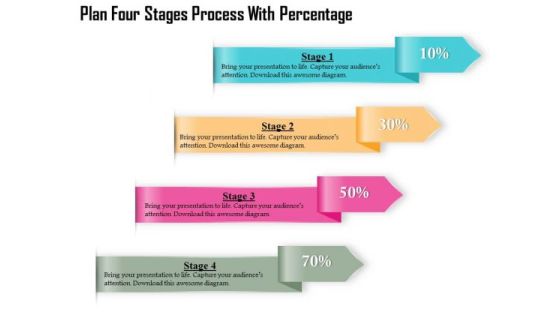
Business Diagram Four Stages Process With Percentage Presentation Template
Four multicolored tags in vertical order has been used to decorate this business diagram. This diagram contains the concept of financial data display with percent values. This diagram can be used for management and finance related presentations.

Business Diagram Three Stages Process Percentage Presentation Template
Three multicolored tags in vertical order has been used to decorate this business diagram. This diagram contains the concept of financial data display with percent values. This diagram can be used for management and finance related presentations.

Deeper Learning Cultivator Ppt Slides Themes
This is a deeper learning cultivator ppt slides themes. This is a five stage process. The stages in this process are social emotional learning facilitator, data driven, lifelong learner, deeper learning cultivator, personalized learning architect.
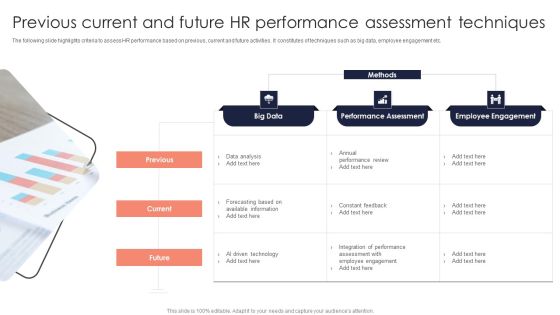
Previous Current And Future Hr Performance Assessment Techniques Brochure PDF
The following slide highlights criteria to assess HR performance based on previous, current and future activities. It constitutes of techniques such as big data, employee engagement etc. Presenting Previous Current And Future Hr Performance Assessment Techniques Brochure PDF to dispense important information. This template comprises three stages. It also presents valuable insights into the topics including Data Analysis, Information, Performance Assessment. This is a completely customizable PowerPoint theme that can be put to use immediately. So, download it and address the topic impactfully.

Business Activity Flows Optimization Functional Areas Overview Ppt PowerPoint Presentation Layouts Gallery PDF
Presenting this set of slides with name business activity flows optimization functional areas overview ppt powerpoint presentation layouts gallery pdf. This is a nine stage process. The stages in this process are master data management, human resources, research and development, controlling, master data management, materials management, production needs assessment, finance and accounting. This is a completely editable PowerPoint presentation and is available for immediate download. Download now and impress your audience.
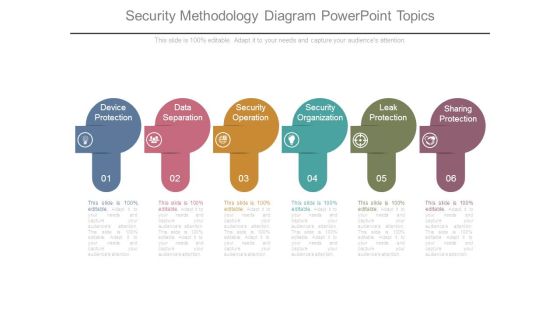
Security Methodology Diagram Powerpoint Topics
This is a security methodology diagram powerpoint topics. This is a six stage process. The stages in this process are device protection, data separation, security operation, security organization, leak protection, sharing protection.
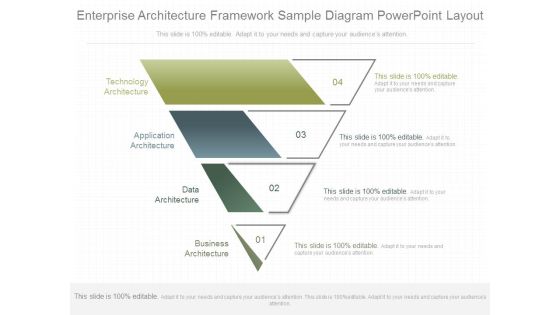
Enterprise Architecture Framework Sample Diagram Powerpoint Layout
This is a enterprise architecture framework sample diagram powerpoint layout. This is a four stage process. The stages in this process are technology architecture, application architecture, data architecture, business architecture.

Circular Diagram Of Cfl Bulbs Powerpoint Templates
This PowerPoint template has been designed with circular diagram of CFL bulbs. It helps to exhibit business strategies and ideas. Use this diagram to impart more clarity to data and to create more sound impact on viewers.

Business Intelligence Pillar Diagram Powerpoint Presentation
This is a business intelligence pillar diagram powerpoint presentation. This is a three stage process. The stages in this process are business intelligence strategy, business process strategy, data strategy, technology strategy.

Business Research Process Diagram Ppt Example
This is a business research process diagram ppt example. This is a five stage process. The stages in this process are business issues decision, analysis and reporting, data collection, questionnaire development, research objectives methodology.

Comparative Assessment Of SOA And Microservices Architecture Professional PDF
This slide illustrates comparative analysis of Service Oriented Architecture and Microservices. It includes scope, component reuse, communication protocols, data access, etc. Presenting Comparative Assessment Of SOA And Microservices Architecture Professional PDF to dispense important information. This template comprises six stages. It also presents valuable insights into the topics including Scope, Component Reuse, Communication Protocols, Data Access. This is a completely customizable PowerPoint theme that can be put to use immediately. So, download it and address the topic impactfully.
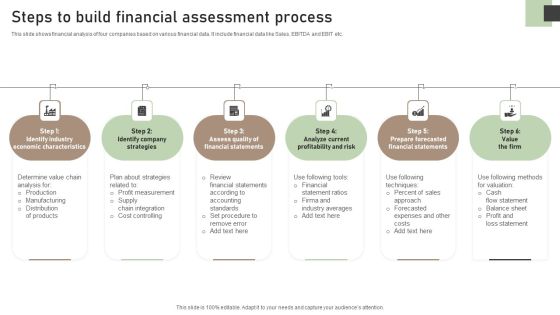
Steps To Build Financial Assessment Process Ideas PDF
This slide shows financial analysis of four companies based on various financial data. It include financial data like Sales, EBITDA and EBIT etc. Presenting Steps To Build Financial Assessment Process Ideas PDF to dispense important information. This template comprises six stages. It also presents valuable insights into the topics including Identify Industry Economic, Identify Company Strategies, Analyze Current Profitability. This is a completely customizable PowerPoint theme that can be put to use immediately. So, download it and address the topic impactfully.
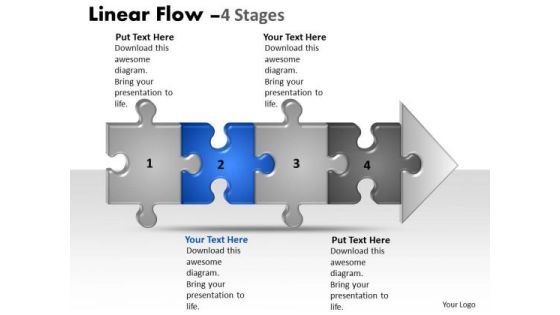
Usa Ppt Background Linear Flow 4 State Diagram Style1 Time Management PowerPoint 3 Design
USA PPT Background linear flow 4 state diagram style1 time management powerpoint 3 design-Linear flow diagram is a visual representation of the flow of data in an information system. Data flows are an important visualization tool to model processes.-USA PPT Background linear flow 4 state diagram style1 time management powerpoint 3 design-Arrow, Attached, Background, Business, Chain, Chart, Competition, Concepts, Connection, Diagram, Finance, Future, Graph, Growth, Ideas, Improvement, Investment, Isolated, Jigsaw, Making, Market, Money, Order, Partnership, Piece, Planning, Puzzle, Shape

Future Of Ecommerce Diagram Ppt Example File
This is a future of ecommerce diagram ppt example file. This is a six stage process. The stages in this process are responsive design, rich functionalities, social media, omni channel, mobile, data segmentation.

Investment Research Example Diagram Ppt Example File
This is a investment research example diagram ppt example file. This is a four stage process. The stages in this process are research reports, data and pricing, education, investment tools.

Digital Marketing Services Sample Diagram Ppt Images
This is a digital marketing services sample diagram ppt images. This is a eight stage process. The stages in this process are data science, display ppc, cro, email, social media, online articles, seo, mobile apps.

Architect Design And Solutions Diagram Powerpoint Slides
This is a architect design and solutions diagram powerpoint slides. This is a six stage process. The stages in this process are data safety, efficiently, speed, reliability, convenience, security.

Analytics Solutions Diagram Sample Of Ppt Presentation
This is a analytics solutions diagram sample of ppt presentation. This is a four stage process. The stages in this process are analytic applications, analytics, data sources, business intelligence.

Transaction Process Diagram Ppt Images Gallery
This is a transaction process diagram ppt images gallery. This is a five stage process. The stages in this process are data entry, tp batch online, database maintenance, document report generation, inquiry processing.

Trends In Sales Diagram Ppt Examples Slides
This is a trends in sales diagram ppt examples slides. This is a five stage process. The stages in this process are event roi, single platform, sales data and analytics, art of follow ups, mobility, trends in sales.
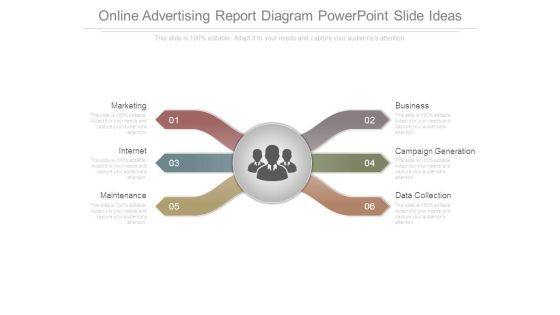
Online Advertising Report Diagram Powerpoint Slide Ideas
This is a online advertising report diagram powerpoint slide ideas. This is a six stage process. The stages in this process are marketing, internet, maintenance, business, campaign generation, data collection.

Customized Analytical Support Diagram Powerpoint Presentation Examples
This is a customized analytical support diagram powerpoint presentation examples. This is a four stage process. The stages in this process are scope and define the problem, data gathering and investigation, develop options, recommendation report.

Sample Of Teleselling Diagram Powerpoint Guide
This is a sample of teleselling diagram powerpoint guide. This is a six stage process. The stages in this process are lead generation, sales, appointment setting, data classing, customer surveys, event marketing.
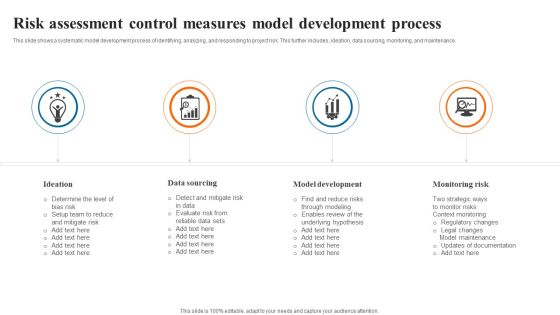
Risk Assessment Control Measures Model Development Process Structure PDF
This slide shows a systematic model development process of identifying, analyzing, and responding to project risk. This further includes, ideation, data sourcing, monitoring, and maintenance. Presenting Risk Assessment Control Measures Model Development Process Structure PDF to dispense important information. This template comprises four stages. It also presents valuable insights into the topics including Data Sourcing, Model Development, Monitoring Risk. This is a completely customizable PowerPoint theme that can be put to use immediately. So, download it and address the topic impactfully.
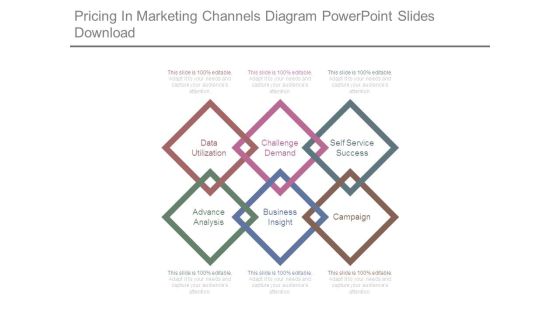
Pricing In Marketing Channels Diagram Powerpoint Slides Download
This is a pricing in marketing channels diagram powerpoint slides download. This is a six stage process. The stages in this process are data utilization, challenge demand, self service success, advance analysis, business insight, campaign.

3D Arrows Step Process Diagram Powerpoint Template
Our above slide contains graphics of arrows step process diagram. It helps to display innovative ideas. Use this diagram to impart more clarity to data and to create more sound impact on viewers.

Colorful Circle Arrow Diagram Powerpoint Template
Our above PPT slide contains circular arrow design. This business diagram helps to exhibit process flow. Use this diagram to impart more clarity to data and to create more sound impact on viewers.

Colorful Circular Arrows Diagram Powerpoint Template
Our above PPT slide contains circular arrow design. This business diagram helps to exhibit process flow. Use this diagram to impart more clarity to data and to create more sound impact on viewers.

Diagram Of Colorful Circular Arrows Powerpoint Template
Our above PPT slide contains circular arrow design. This business diagram helps to exhibit process flow. Use this diagram to impart more clarity to data and to create more sound impact on viewers.
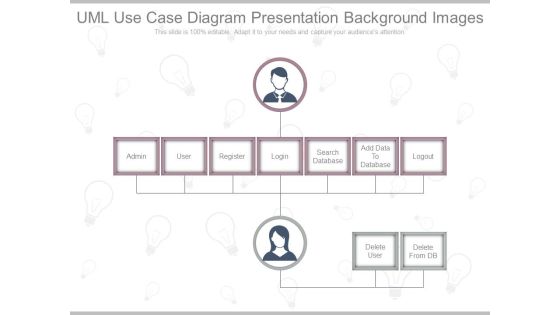
Uml Use Case Diagram Presentation Background Images
This is a uml use case diagram presentation background images. This is a seven stage process. The stages in this process are admin, user, register, login, search database, add data to database, logout.

Qualitative Market Research Diagram Ppt Presentation
This is a qualitative market research diagram ppt presentation. This is a five stage process. The stages in this process are qualitative, data collection tools, online communities, web survey chat, online forums, focus groups, depth interviews triads dyads.

Alternative Workplace Strategy Diagram Ppt Sample
This is a alternative workplace strategy diagram ppt sample. This is a five stage process. The stages in this process are data exploration, develop the strategy, build a business case, develop implement, evaluate and improve.
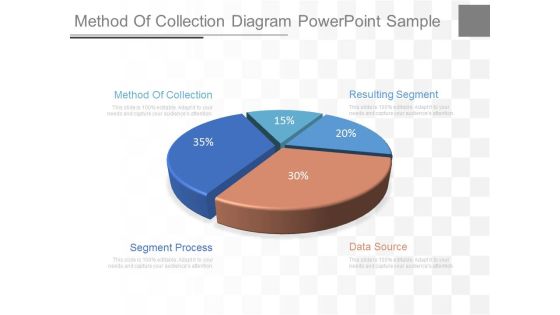
Method Of Collection Diagram Powerpoint Sample
This is a method of collection diagram powerpoint sample. This is a five stage process. The stages in this process are method of collection, segment process, data source, resulting segment.
Service Oriented Architecture Diagram Powerpoint Slide Clipart
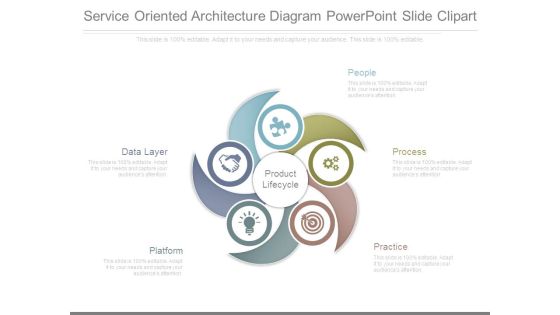
This is a service oriented architecture diagram powerpoint slide clipart. This is a five stage process. The stages in this process are product lifecycle, data layer, platform, people, process, practice.
Multivariate Testing Diagram Ppt Samples Download
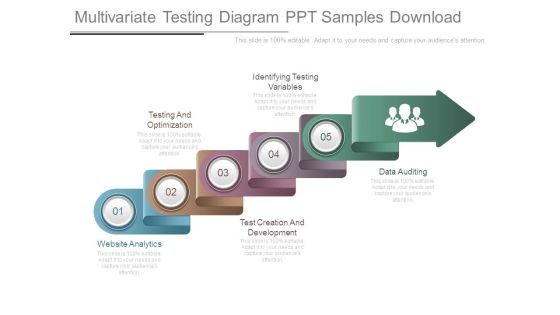
This is a multivariate testing diagram ppt samples download. This is a five stage process. The stages in this process are website analytics, testing and optimization, test creation and development, identifying testing variables, data auditing.

Strategic Planning Decisions Diagram Powerpoint Presentation
This is a strategic planning decisions diagram powerpoint presentation. This is a eight stage process. The stages in this process are data sheet, references, pricing, social media, call guide, sales presentation, demo, website.
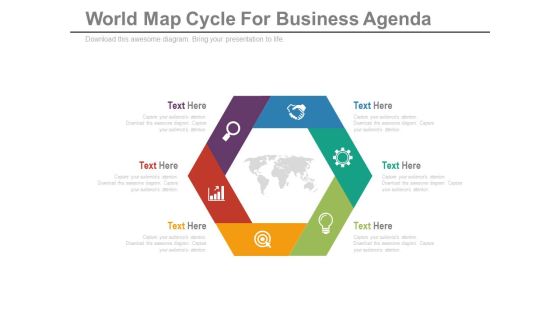
Diagram For Global Business Strategy Powerpoint Template
Our above slide contains hexagonal infographic diagram. This PowerPoint template helps to display global business strategy. Use this diagram to impart more clarity to data and to create more sound impact on viewers.
Marketing And Sales Tools Diagram Sample Ppt Files
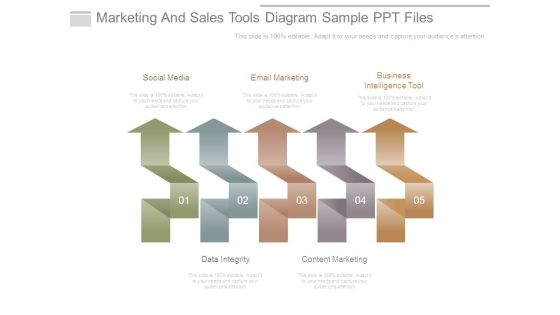
This is a marketing and sales tools diagram sample ppt files. This is a five stage process. The stages in this process are social media, email marketing, business intelligence tool, data integrity, content marketing.

Abc Steps For Corporate Entrepreneurship Powerpoint Template
Our above PPT slide contains graphics of ABC steps chart. This business diagram helps to depict concept of corporate entrepreneurship. Use this diagram to impart more clarity to data and to create more sound impact on viewers.

Cycle Of Cross Media Overview Diagram Ppt Slides
This is a cycle of cross media overview diagram ppt slides. This is a five stage process. The stages in this process are email, sms, mms text messaging, rich media, landing pages and micro sites, variable data print.

Board With Bar Graph For Financial Analysis Powerpoint Slides
You can download this PowerPoint template to display statistical data and analysis. This PPT slide contains display board with bar graph. Draw an innovative business idea using this professional diagram.

Desktop Security Management Prepare And Deploy Strong It Policies Template PDF
This slide represents the value of having strong IT policies within an organization regarding software, hardware, passwords, and data transfer. Deliver and pitch your topic in the best possible manner with this desktop security management prepare and deploy strong it policies template pdf. Use them to share invaluable insights on management, data, network and impress your audience. This template can be altered and modified as per your expectations. So, grab it now.
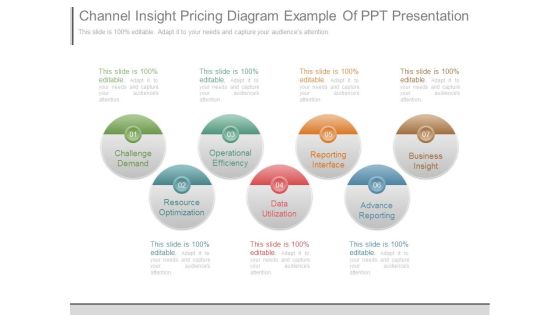
Channel Insight Pricing Diagram Example Of Ppt Presentation
This is a channel insight pricing diagram example of ppt presentation. This is a seven stage process. The stages in this process are challenge demand, operational efficiency, reporting interface, business insight, resource optimization, data utilization, advance reporting.

B2b Integration Design Sample Diagram Example Ppt Presentation
This is a b2b integration design sample diagram example ppt presentation. This is a four stage process. The stages in this process are adapter, protocol conversion, interaction framework, data translation.
Online Promotion Playbook Google Analytics For All Web Tracking Summary PDF
This template covers tools to measure marketing analytics such as google analytics for all web tracking, google data studio to build real time reporting dashboards and google data studio reports. Deliver and pitch your topic in the best possible manner with this online promotion playbook google analytics for all web tracking summary pdf. Use them to share invaluable insights on demographics, devices, social networks and impress your audience. This template can be altered and modified as per your expectations. So, grab it now.

Circle Process Of Four Steps Powerpoint Templates
Our above slide contains graphics of bulb with success graph. It helps to exhibit planning for growth. Use this diagram to impart more clarity to data and to create more sound impact on viewers.

Dashboard With Increasing Values Powerpoint Slides
This innovative, stunningly beautiful dashboard has been designed for data visualization. It contains pie charts with increasing percentage values. This PowerPoint template helps to display your information in a useful, simple and uncluttered way.

Pyramid For Financial Accounting Information Powerpoint Slides
This PowerPoint template has been designed with graphics of pyramid chart. This PPT slide can be used to prepare presentations for profit growth report and also for financial data analysis. You can download finance PowerPoint template to prepare awesome presentations.

Sample Of Business Process Flow Diagram Presentation Slides
This is a sample of business process flow diagram presentation slides. This is a six stage process. The stages in this process are etl, sqa, business process, data warehouse, decisioning services, predictive services.
Voice Of The Customer Six Sigma Diagram Ppt Images
This is a voice of the customer six sigma diagram ppt images. This is a five stage process. The stages in this process are groups, warranty, metrics, data returns, survey, voice of customer.

Sop Strategic Plan Ppt Diagram Powerpoint Templates Microsoft
This is a sop strategic plan ppt diagram powerpoint templates microsoft. This is a six stage process. The stages in this process are production, construction, supplier, gather data and analyze, demand and supply, demand planning.
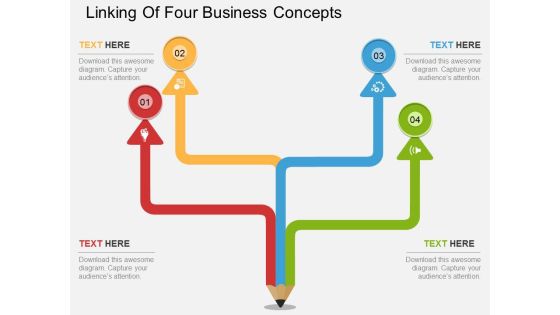
Linking Of Four Business Concepts Powerpoint Template
This PowerPoint template has been designed with four steps pencil diagram. This diagram is excellent visual tools to present link of steps. Download this PPT slide to explain complex data immediately and clearly.
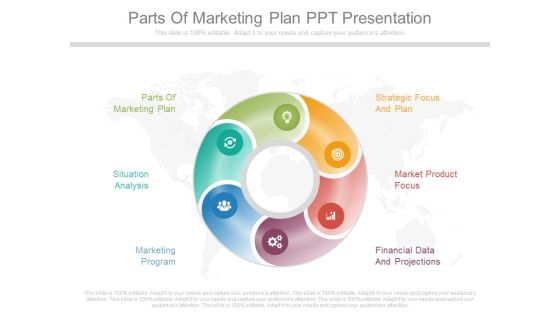
Parts Of Marketing Plan Ppt Presentation
This is a parts of marketing plan ppt presentation. This is a six stage process. The stages in this process are parts of marketing plan, strategic focus and plan, situation analysis, market product focus, marketing program, financial data and projections.
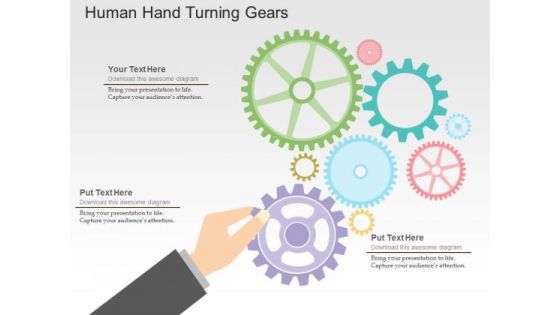
Human Hand Turning Gears PowerPoint Templates
Our above slide contains graphics of human hand turning gears. It helps to display concepts of process control and management. Use this diagram to impart more clarity to data and to create more sound impact on viewers.

Three Puzzle Steps For Business Solutions Powerpoint Slides
Our above slide contains graphics of three puzzle steps. This slide is suitable to present business management and strategy. Use this diagram to impart more clarity to data and to create more sound impact on viewers.
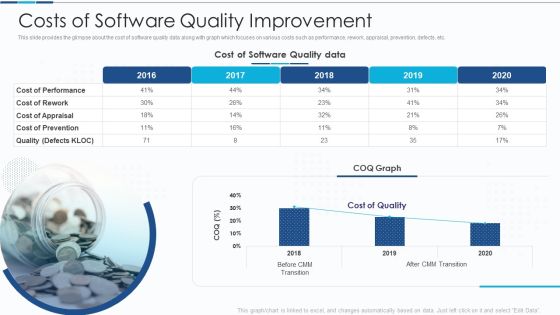
Introduction To IT Project Development Costs Of Software Quality Improvement Information PDF
This slide provides the glimpse about the cost of software quality data along with graph which focuses on various costs such as performance, rework, appraisal, prevention, defects, etc. Deliver an awe inspiring pitch with this creative introduction to it project development costs of software quality improvement information pdf bundle. Topics like cost of software, quality data, cost of performance can be discussed with this completely editable template. It is available for immediate download depending on the needs and requirements of the user.

Diamond Design With Two Levels And Eight Stages Powerpoint Template
Our above slide contains graphics of diamond design with two levels and eight stages. It helps to display concepts in visual manner. Use this diagram to impart more clarity to data and to create more sound impact on viewers.
Four Arrows For Different Process Representation Powerpoint Template
This PowerPoint template has been designed with graphics of four arrows This diagram is excellent visual tools for business presentations. Download this PPT slide to explain complex data immediately and clearly.

Five Steps Of Human Assessment Planning Process Ppt PowerPoint Presentation Outline Model PDF
This slide shows the various stages of workforce analysis planning process. These stages are strategy formulation, data collection and analysis, implementation and assessment . Presenting Five Steps Of Human Assessment Planning Process Ppt PowerPoint Presentation Outline Model PDF to dispense important information. This template comprises five stages. It also presents valuable insights into the topics including Goals Missions, Data Collection, Implementation. This is a completely customizable PowerPoint theme that can be put to use immediately. So, download it and address the topic impactfully.

Research Business Intelligence Ppt Powerpoint Templates
This is a research business intelligence ppt powerpoint templates. This is a seven stage process. The stages in this process are data warehousing, reporting, analytics, datamining, qap, epr, benchmarking.
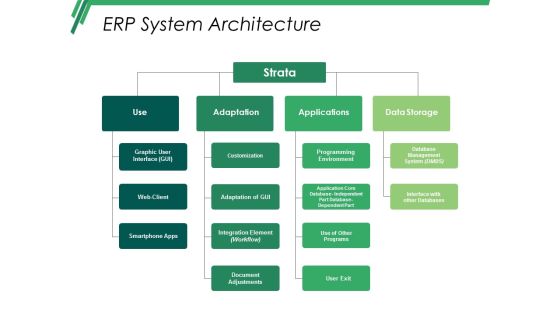
Erp System Architecture Ppt PowerPoint Presentation Pictures Master Slide
This is a erp system architecture ppt powerpoint presentation pictures master slide. This is a four stage process. The stages in this process are use, strata, adaptation, applications, data storage.

Four Tags For Strategy Planning Process Powerpoint Template
Steps for strategy planning can be explained with this diagram. This PowerPoint template contains diagram of four infographic tags. You can also use this design for data analysis in business presentations

Four Steps Circular Infographic Powerpoint Templates
Our above slide contains diagram of three stage circular infographic. It helps to display global business analysis. Use this diagram to impart more clarity to data and to create more sound impact on viewers.

Business Men On Gears Towards Success Trophy Powerpoint Templates
Our above slide contains diagram of business men on gears towards success trophy. It helps to exhibit strategy process and competition. Use this diagram to impart more clarity to data and to create more sound impact on viewers.

Circles With Percentage Values Powerpoint Templates
This PowerPoint template displays circles with percentage values. This business diagram is suitable for financial data analysis. Use this business diagram slide to highlight the key issues of your presentation.

Bar Graph For Marketing Research Process Powerpoint Slides
This PowerPoint template has been designed with diagram of bar graph. This PPT slide can be used to prepare presentations for profit growth report and also for financial data analysis. You can download finance PowerPoint template to prepare awesome presentations.

Four Options Zigzag Infographics Powerpoint Template
Emphatically define your message with our above template which contains four options zigzag infographic. This business diagram may be used to plot data series. Deliver amazing presentations to mesmerize your audience.

Colorful Circle Arrow Design Powerpoint Template
Our above PPT slide contains circular arrow design. This business diagram helps to exhibit process flow. Use this diagram to impart more clarity to data and to create more sound impact on viewers.
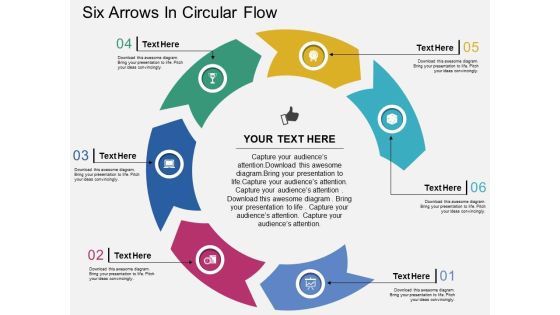
Six Arrows In Circular Flow Powerpoint Templates
Our above PPT slide contains graphics of circular diagram. This business diagram helps to display outline of business plan. Use this template to impart more clarity to data and to create more sound impact on viewers.

Arrow In Labyrinth Moving Towards Year 2016 Powerpoint Templates
Our above slide contains graphics of labyrinth with arrow on 2016 and globe. It helps to display concept of global business strategy. Use this diagram to impart more clarity to data and to create more sound impact on viewers.
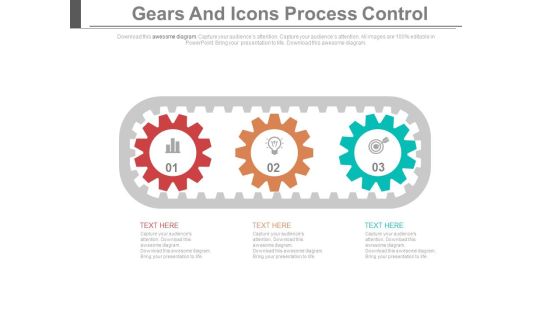
Three Gears Steps For Innovative Process Powerpoint Template
This PowerPoint slide contains graphics of three gears steps. It helps to exhibit innovative process steps. Use this diagram to impart more clarity to data and to create more sound impact on viewers.

Cylinder With Four Corporate Marketing Steps Powerpoint Template
Our above slide contains graphics of cylinder with four text tags. It may be used to display marketing steps. Use this diagram to impart more clarity to data and to create more sound impact on viewers.
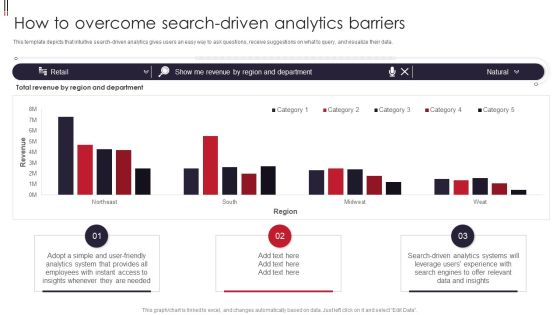
Information Visualizations Playbook How To Overcome Search Driven Analytics Barriers Guidelines PDF
This template depicts that intuitive search-driven analytics gives users an easy way to ask questions, receive suggestions on what to query, and visualize their data. Deliver an awe inspiring pitch with this creative Information Visualizations Playbook How To Overcome Search Driven Analytics Barriers Guidelines PDF bundle. Topics like Analytics System, Data And Insights, Search Driven Analytics can be discussed with this completely editable template. It is available for immediate download depending on the needs and requirements of the user.

Arrows With Circles And Idea Bulb Powerpoint Template
Our above slide contains graphics of arrows with circles and idea bulb. It helps to display innovative ideas. Use this diagram to impart more clarity to data and to create more sound impact on viewers.

Profit Growth Graph With Gears Powerpoint Template
This business slide contains profit growth graph with gears. This PowerPoint template helps to display outline of business plan. Use this diagram to impart more clarity to data and to create more sound impact on viewers.
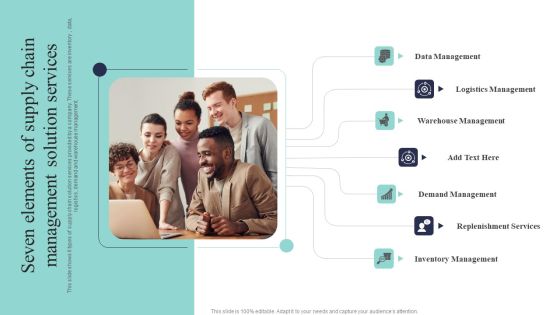
Seven Elements Of Supply Chain Management Solution Services Clipart PDF
This slide shows 6 types of supply chain solution services provided by a company. These services are inventory , data, logistics, demand and warehouse management. Presenting Seven Elements Of Supply Chain Management Solution Services Clipart PDF to dispense important information. This template comprises seven stages. It also presents valuable insights into the topics including Data Management, Logistics Management, Warehouse Management. This is a completely customizable PowerPoint theme that can be put to use immediately. So, download it and address the topic impactfully.
Coalescer Section Powerpoint Slides Design
This is a coalescer section powerpoint slides design. This is a six stage process. The stages in this process are data flow diagram, compressed air, coalescer section, fresh caustic prewash, jet fuel feed, spent caustic drain.

Jet Fuel Feed Powerpoint Slide Background Picture
This is a jet fuel feed powerpoint slide background picture. This is a six stage process. The stages in this process are data flow diagram, compressed air, coalesce section, fresh caustic prewash, jet fuel feed, spent caustic drain.
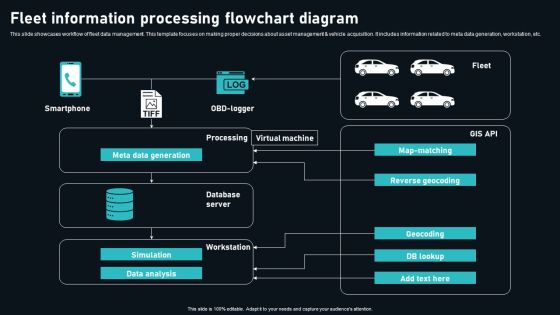
Fleet Information Processing Flowchart Diagram Themes PDF
This slide showcases workflow of fleet data management. This template focuses on making proper decisions about asset management and vehicle acquisition. It includes information related to meta data generation, workstation, etc. Showcasing this set of slides titled Fleet Information Processing Flowchart Diagram Themes PDF. The topics addressed in these templates are Smartphone, Processing, Virtual Machine. All the content presented in this PPT design is completely editable. Download it and make adjustments in color, background, font etc. as per your unique business setting.

Major Challenges Of PDSA Planning Management Cycle Background PDF
The purpose of this slide is to show majors challenges of PDSA planning cycle. It covers creating overlapping changes, requiring training and relying on data collection.Presenting Major Challenges Of PDSA Planning Management Cycle Background PDF to dispense important information. This template comprises three stages. It also presents valuable insights into the topics including Overlapping Changes, Requires Proper, Data Collection. This is a completely customizable PowerPoint theme that can be put to use immediately. So, download it and address the topic impactfully.
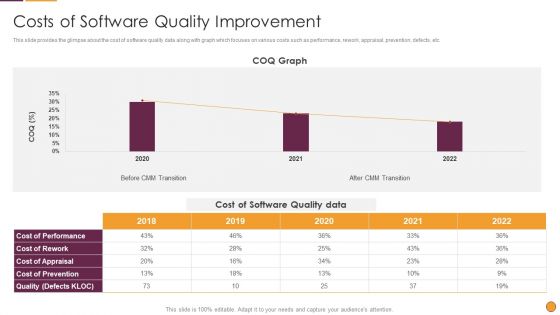
Process Enhancement Program Success Costs Of Software Quality Improvement Graphics PDF
This slide provides the glimpse about the cost of software quality data along with graph which focuses on various costs such as performance, rework, appraisal, prevention, defects, etc. Deliver an awe inspiring pitch with this creative Process Enhancement Program Success Costs Of Software Quality Improvement Graphics PDF bundle. Topics like Cost Software, Quality Data, COQ Graph can be discussed with this completely editable template. It is available for immediate download depending on the needs and requirements of the user.
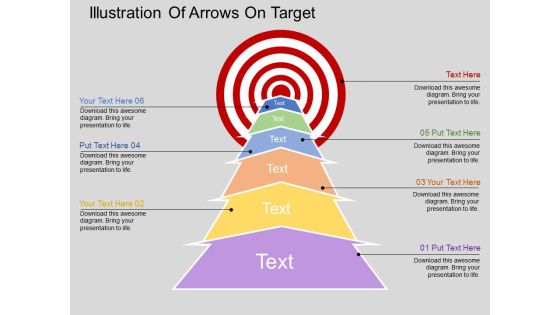
Illustration Of Arrows On Target Powerpoint Templates
Our above slide illustrates arrow steps towards target. This PowerPoint template may be used to exhibit target planning. Use this diagram to impart more clarity to data and to create more sound impact on viewers.
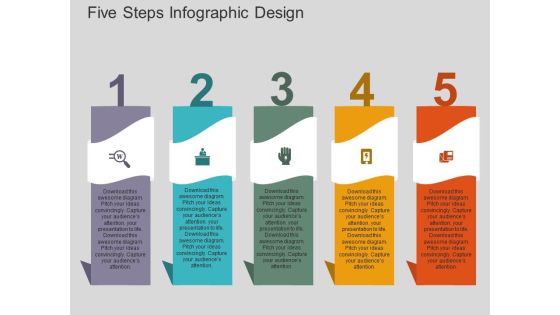
Five Steps Infographic Design Powerpoint Templates
Our above slide contains graphics of six hands around bulb. It helps to display steps of idea planning. Use this diagram to impart more clarity to data and to create more sound impact on viewers.

Global Shipping And Finance Services Powerpoint Templates
Our above PPT slide contains triangles infographic. It helps to display outline of business plan. Use this diagram to impart more clarity to data and to create more sound impact on viewers.
Compressed Air Powerpoint Templates Microsoft
This is a compressed air powerpoint templates microsoft. This is a six stage process. The stages in this process are data flow diagram, compressed air, coalescer section, fresh caustic prewash, jet fuel feed, spent caustic drain.

3D Man Moving Toward Arrow Powerpoint Template
Our above PPT slide contains graphics of 3d man moving towards arrow. This PowerPoint template helps to exhibit finding possible solutions. Use this diagram to impart more clarity to data and to create more sound impact on viewers.
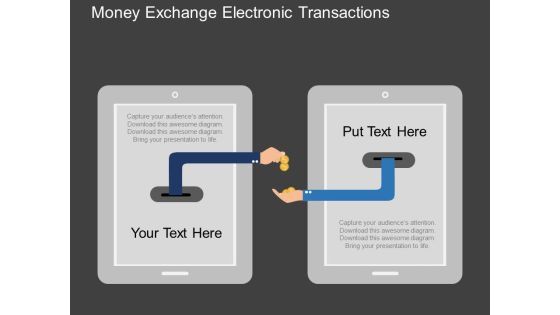
Money Exchange Electronic Transactions Powerpoint Templates
Our above slide contains illustration of money exchange. It helps to display electronic transactions. Use this diagram to impart more clarity to data and to create more sound impact on viewers.

Business Man On Road With Question Mark Powerpoint Template
Our above PPT slide contains road graphics with business man and question mark. It helps to exhibit finding possible solutions. Use this diagram to impart more clarity to data and to create more sound impact on viewers.

Financial Enterprise Technology Solutions Framework Diagrams PDF
This slide represents financial enterprise technology framework such as enterprise calculation engine, modeling, reporting, smart data integration etc that helps business in decision making. Showcasing this set of slides titled Financial Enterprise Technology Solutions Framework Diagrams PDF. The topics addressed in these templates are Business Apps, Platform Tools, Data Sources. All the content presented in this PPT design is completely editable. Download it and make adjustments in color, background, font etc. as per your unique business setting.

Information Security Prepare And Deploy Strong IT Policies Ppt Gallery Images PDF
This slide represents the value of having strong IT policies within an organization regarding software, hardware, passwords, and data transfer. Deliver an awe inspiring pitch with this creative information security prepare and deploy strong it policies ppt gallery images pdf bundle. Topics like management, network, device, data can be discussed with this completely editable template. It is available for immediate download depending on the needs and requirements of the user.

Cyber Safety Incident Management Statistics Associated To Workplace Threats Elements PDF
This slide provides details regarding statistics associated to workplace threats that firms face in terms of data records theft, workplace violence, financial phishing, etc. Deliver and pitch your topic in the best possible manner with this cyber safety incident management statistics associated to workplace threats elements pdf. Use them to share invaluable insights on cyber attacks costs, organizations, organizations have, organizations face, data records and impress your audience. This template can be altered and modified as per your expectations. So, grab it now.
 Home
Home