Data Governance Icon

Bar Chart For Data Analytics Ppt Examples
This is a bar chart for data analytics ppt examples. This is a five stage process. The stages in this process are category.

Data Driven Analytics Chart Powerpoint Presentation Templates
This is a data driven analytics chart powerpoint presentation templates. This is a five stage process. The stages in this process are category.

Data Analytics Bar Chart Ppt Sample Presentations
This is a data analytics bar chart ppt sample presentations. This is a five stage process. The stages in this process are category.

Quarterly Business And Data Management Roadmap Microsoft
We present our five years business and data management roadmap background. This PowerPoint layout is easy-to-edit so you can change the font size, font type, color, and shape conveniently. In addition to this, the PowerPoint layout is Google Slides compatible, so you can share it with your audience and give them access to edit it. Therefore, download and save this well-researched five years business and data management roadmap background in different formats like PDF, PNG, and JPG to smoothly execute your business plan.

Big Data Application Sample Diagram Powerpoint Presentation
This is a big data application sample diagram powerpoint presentation. This is a six stage process. The stages in this process are telecoms, healthcare, marketing, insurance, engineering, science.
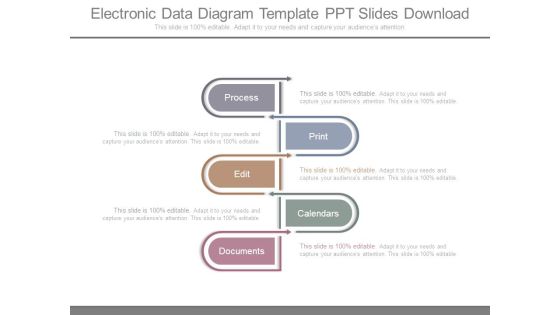
Electronic Data Diagram Template Ppt Slides Download
This is a electronic data diagram template ppt slides download. This is a five stage process. The stages in this process are process, print, calendars, edit, documents.

Industries Using Computer Data Applications Professional PDF
The following slide exhibits statistics related to big data usage in various industries to satisfy their particular needs. Most active industries in big data adoption are telecommunications, healthcare, and financial services. Presenting Industries Using Computer Data Applications Professional PDF to dispense important information. This template comprises four stages. It also presents valuable insights into the topics including Telecoms, Financial Services, Healthcare. This is a completely customizable PowerPoint theme that can be put to use immediately. So, download it and address the topic impactfully.

Data Mining Dashboard Diagram Powerpoint Slides
This is a data mining dashboard diagram powerpoint slides. This is a four stage process. The stages in this process are very active min, distance, calories, activity.
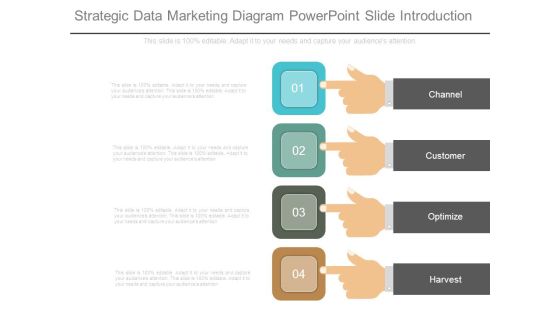
Strategic Data Marketing Diagram Powerpoint Slide Introduction
This is a strategic data marketing diagram powerpoint slide introduction. This is a four stage process. The stages in this process are channel, customer, optimize, harvest.

Binary Numbers Big Data Processing Powerpoint Template
This PowerPoint template has been designed with diagram of binary system. Download this PPT slide to display big data processing. Download this diagram slide for technology related presentations.

Data Management Ppt Diagram Powerpoint Layout
This is a data management ppt diagram powerpoint layout. This is a five stage process. The stages in this process are security service, organizational skills, business skills, backup and recovery, performance tuning.

data collection histograms ppt powerpoint presentation example
This is a data collection histograms ppt powerpoint presentation example. This is a six stage process. The stages in this process are business, planning, marketing, histograms, graph.

Department Wise Recruitment Plan Data Ppt Infographics
This is a department wise recruitment plan data ppt infographics. This is a five stage process. The stages in this process are finance, support, product, marketing, sales, engineering.
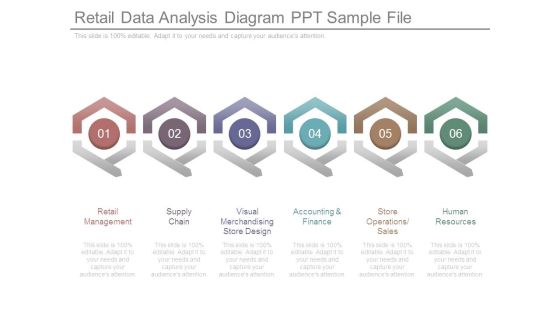
Retail Data Analysis Diagram Ppt Sample File
This is a retail data analysis diagram ppt sample file. This is a six stage process. The stages in this process are retail management, supply chain, visual merchandising store design, accounting and finance, store operations sales, human resources.
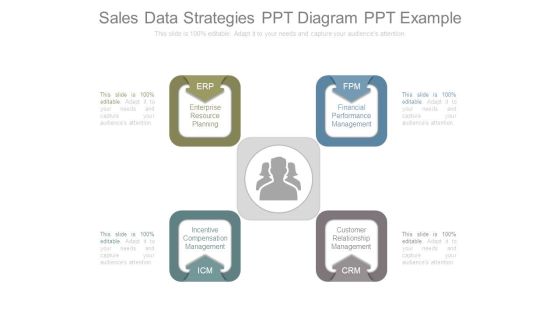
Sales Data Strategies Ppt Diagram Ppt Example
This is a sales data strategies ppt diagram ppt example. This is a four stage process. The stages in this process are enterprise resource planning, financial performance management, incentive compensation management, customer relationship management.

Data Visualization For Market Ppt Example
This is a data visualization for market ppt example. This is a six stage process. The stages in this process are tree map chart, exploded pie chart, semi circle chart, bubble chart, line chart, stacked chart, series.
Information Security Compliance Dashboard Of Data Security Ppt Icon Vector PDF
This slide depicts the data security compliance report on how data and hardware are monitored in different categories such as standard, regulation, and asset type control. Deliver an awe inspiring pitch with this creative information security compliance dashboard of data security ppt icon vector pdf bundle. Topics like asset type control, control issues by standard, control issues by regulation can be discussed with this completely editable template. It is available for immediate download depending on the needs and requirements of the user.

Data Driven Marketing Algorithm Structure Topics PDF
This slide represents the structure to effectively apply data driven marketing for effectively targeting most receptive customers and communicating relevant messages to them. It includes details related to procedure to apply data algorithm such as data collection culture, data collection etc. This Data Driven Marketing Algorithm Structure Topics PDF from Slidegeeks makes it easy to present information on your topic with precision. It provides customization options, so you can make changes to the colors, design, graphics, or any other component to create a unique layout. It is also available for immediate download, so you can begin using it right away. Slidegeeks has done good research to ensure that you have everything you need to make your presentation stand out. Make a name out there for a brilliant performance.
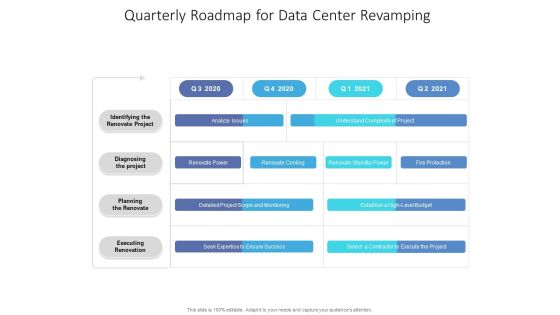
Quarterly Roadmap For Data Center Revamping Sample
We present our quarterly roadmap for data center revamping sample. This PowerPoint layout is easy to edit so you can change the font size, font type, color, and shape conveniently. In addition to this, the PowerPoint layout is Google Slides compatible, so you can share it with your audience and give them access to edit it. Therefore, download and save this well researched quarterly roadmap for data center revamping sample in different formats like PDF, PNG, and JPG to smoothly execute your business plan.

Oracle Data Integration Strategic Architecture Formats PDF
PresentingOracle Data Integration Strategic Architecture Formats PDF to dispense important information. This template comprises Three stages. It also presents valuable insights into the topics including Oracle Data Integration, Strategic Architecture. This is a completely customizable PowerPoint theme that can be put to use immediately. So, download it and address the topic impactfully.

Data Processing System Input And Output Ppt PowerPoint Presentation Icon Information
This is a data processing system input and output ppt powerpoint presentation icon information. This is a four stage process. The stages in this process are data flow, data management, big data.

Half Yearly Data Management Roadmap Structure Demonstration
We present our half yearly data management roadmap structure demonstration. This PowerPoint layout is easy-to-edit so you can change the font size, font type, color, and shape conveniently. In addition to this, the PowerPoint layout is Google Slides compatible, so you can share it with your audience and give them access to edit it. Therefore, download and save this well-researched half yearly data management roadmap structure demonstration in different formats like PDF, PNG, and JPG to smoothly execute your business plan.

Decision Support System Data Warehouse Is Time Variant Ppt Icon Smartart
This slide describes the time-variant feature of data warehouses and how they can store years-old information, and users can easily access that information. This is a Decision Support System Data Warehouse Is Time Variant Ppt Icon Smartart template with various stages. Focus and dispense information on four stages using this creative set, that comes with editable features. It contains large content boxes to add your information on topics like Data Warehouse, Data Provides Information, Historical Standpoint. You can also showcase facts, figures, and other relevant content using this PPT layout. Grab it now.

Data Structure IT Swot Analysis Diagrams PDF
Presenting this PowerPoint presentation, titled Data Structure IT Swot Analysis Diagrams PDF, with topics curated by our researchers after extensive research. This editable presentation is available for immediate download and provides attractive features when used. Download now and captivate your audience. Presenting this Data Structure IT Swot Analysis Diagrams PDF. Our researchers have carefully researched and created these slides with all aspects taken into consideration. This is a completely customizable Data Structure IT Swot Analysis Diagrams PDF that is available for immediate downloading. Download now and make an impact on your audience. Highlight the attractive features available with our PPTs.

Audit Officer Icon For Performing Data Quality Investigation Ppt PowerPoint Presentation File Templates PDF
Presenting this set of slides with name audit officer icon for performing data quality investigation ppt powerpoint presentation file templates pdf. This is a three stage process. The stages in this process are audit officer icon for performing data quality investigation. This is a completely editable PowerPoint presentation and is available for immediate download. Download now and impress your audience.
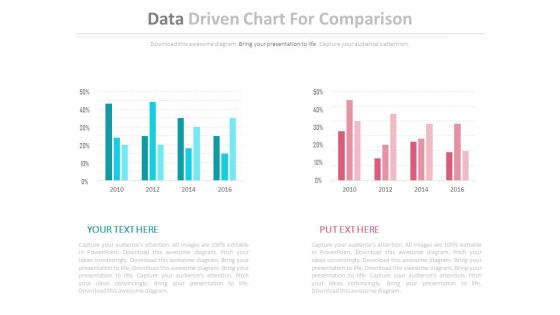
Two Data Driven Comparison Charts Powerpoint Slides
This PowerPoint template contains diagram of two data driven charts. You may use this PPT slide to depict strategic analysis for business. The color coding of this template is specifically designed to highlight you points.

Global Tiktok Users Statistical Data Portrait PDF
This slide shows the statistical data representing the analysis of global TikTok users on TikTok to help marketers to analyze and identify target audience. It shows data related to users of TikTok are youths and millennials. If you are looking for a format to display your unique thoughts, then the professionally designed Global Tiktok Users Statistical Data Portrait PDF is the one for you. You can use it as a Google Slides template or a PowerPoint template. Incorporate impressive visuals, symbols, images, and other charts. Modify or reorganize the text boxes as you desire. Experiment with shade schemes and font pairings. Alter, share or cooperate with other people on your work. Download Global Tiktok Users Statistical Data Portrait PDF and find out how to give a successful presentation. Present a perfect display to your team and make your presentation unforgettable.

Data Safety Risk Management Checklist Information PDF
Mentioned slide shows checklist which can be used for information security risk management. The checklist covers multiple points such as security audit, establishing physical security, limit user permission, run regular software update etc. Presenting data safety risk management checklist information pdf to dispense important information. This template comprises one stage. It also presents valuable insights into the topics including data safety risk management checklist. This is a completely customizable PowerPoint theme that can be put to use immediately. So, download it and address the topic impactfully.

Data Driven Control Chat Powerpoint Slide Themes
This is a data driven control chat powerpoint slide themes. This is a one stage process. The stages in this process are process output, upper control limit, statistical process control, lower control limit.

Market Research Data Collection Chart Presentation
This is a market research data collection chart presentation. This is a five stage process. The stages in this process are concept testing, customer satisfaction, pricing research, market segmentation, awareness usage.

Big Data Technology Diagram Powerpoint Slides Design
This is a big data technology diagram powerpoint slides design. This is a four stage process. The stages in this process are querying and reporting, decision support and modeling, analytics, infrastructure.
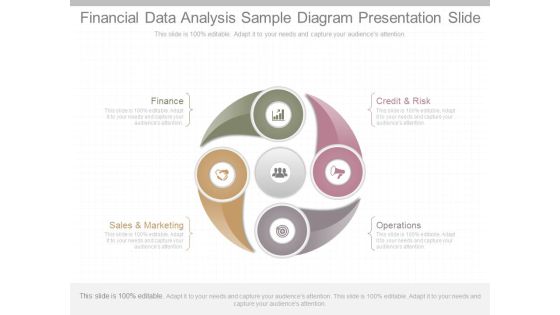
Financial Data Analysis Sample Diagram Presentation Slide
This is a financial data analysis sample diagram presentation slide. This is a four stage process. The stages in this process are finance, sales and marketing, operations, credit and risk.

Data Performance Ppt Diagram Sample File
This is a data performance ppt diagram sample file. This is a five stage process. The stages in this process are classification, analysis, domain expertise, tool and technology, engine performance.

Data Science Learning Use For Business Enhancement Ppt Icon Vector PDF
This slide contains the different uses of AI, ML, and DL for enhancing the business process and making the workflow easy. It facilitate businesses to collect, analyze, and use data. Persuade your audience using this Data Science Learning Use For Business Enhancement Ppt Icon Vector PDF. This PPT design covers three stages, thus making it a great tool to use. It also caters to a variety of topics including Artificial intelligence, Machine learning, Deep learning. Download this PPT design now to present a convincing pitch that not only emphasizes the topic but also showcases your presentation skills.

Agenda For Data Analytics Management Diagrams PDF
Presenting Agenda For Data Analytics Management Diagrams PDF to provide visual cues and insights. Share and navigate important information on five stages that need your due attention. This template can be used to pitch topics like Agenda. In addtion, this PPT design contains high resolution images, graphics, etc, that are easily editable and available for immediate download.

Big Data Ecosystem Sample Diagram Ppt Slides
This is a big data ecosystem sample diagram ppt slides. This is a two stage process. The stages in this process are apps, devices, apis, sources, business, experience, exits, research.
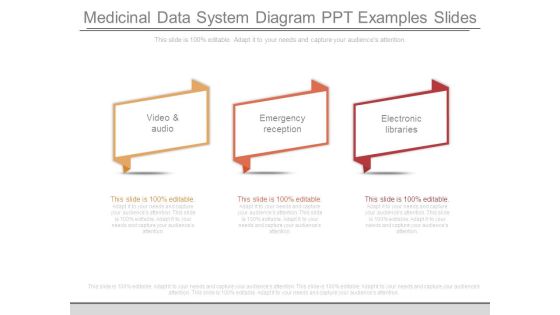
Medicinal Data System Diagram Ppt Examples Slides
This is a medicinal data system diagram ppt examples slides. This is a three stage process. The stages in this process are video and audio, emergency reception, electronic libraries.

Data Mining Dashboard Diagram Example Ppt Presentation
This is a data mining dashboard diagram example ppt presentation. This is a six stage process. The stages in this process are select a region, nuclear power plants in the state of illinois.

Data Loggers Template Diagram Powerpoint Ideas
This is a data loggers template diagram powerpoint ideas. This is a four stage process. The stages in this process are daq device, physical system, a d converter, computer.

Data Collection Histograms Ppt PowerPoint Presentation Diagrams
This is a data collection histograms ppt powerpoint presentation diagrams. This is a seven stage process. The stages in this process are business, strategy, growth strategy, marketing, histogram, finance.
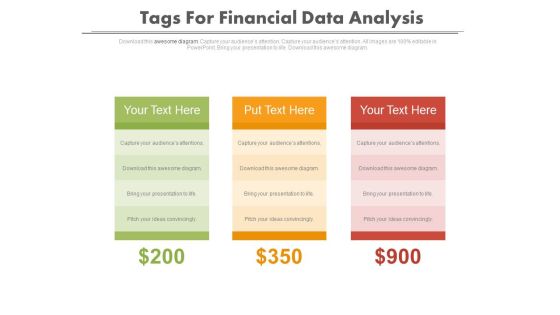
Tags For Financial Data Comparison Powerpoint Slides
Graphic of three text tag with dollar values has been used to design this power point template. This diagram may be used for financial data comparison. Use this diagram to build a professional presentation.

Data Storage And Server Network Ppt Powerpoint Presentation Icon Design Inspiration
This is a data storage and server network ppt powerpoint presentation icon design inspiration. This is a four stage process. The stages in this process are data management, data centre, storage system.

Infographic Cycle Of Data Communication Powerpoint Template
Our above PPT slide contains graphics of circular diagram. This business diagram helps to display outline of business plan. Use this template to impart more clarity to data and to create more sound impact on viewers.

Quarterly Organizational Data Capture Management Roadmap Portrait
We present our quarterly organizational data capture management roadmap portrait. This PowerPoint layout is easy to edit so you can change the font size, font type, color, and shape conveniently. In addition to this, the PowerPoint layout is Google Slides compatible, so you can share it with your audience and give them access to edit it. Therefore, download and save this well researched quarterly organizational data capture management roadmap portrait in different formats like PDF, PNG, and JPG to smoothly execute your business plan.

Data Visualization Vector Icon With Text Holders Ppt Powerpoint Presentation Summary Design Inspiration
This is a data visualization vector icon with text holders ppt powerpoint presentation summary design inspiration. The topics discussed in this diagram are data management icon, big data icon. This is a completely editable PowerPoint presentation, and is available for immediate download.

Healthcare Big Data Assessment Dashboard Portrait PDF
This slide displays the data of healthcare sector showing the total number of patients in the hospital, average treatment cost and waiting time. It also shows the outpatient and impatient trends. Pitch your topic with ease and precision using this Healthcare Big Data Assessment Dashboard Portrait PDF. This layout presents information on Patient Status, Treatment Costs. It is also available for immediate download and adjustment. So, changes can be made in the color, design, graphics or any other component to create a unique layout.

Data Management Vector Icon Ppt PowerPoint Presentation File Visual Aids PDF
Presenting this set of slides with name data management vector icon ppt powerpoint presentation file visual aids pdf. This is a three stage process. The stages in this process are data management vector icon. This is a completely editable PowerPoint presentation and is available for immediate download. Download now and impress your audience.

Illustrative Data Structure Implementation Quarterly Roadmap Slides
We present our illustrative data structure implementation quarterly roadmap slides. This PowerPoint layout is easy-to-edit so you can change the font size, font type, color, and shape conveniently. In addition to this, the PowerPoint layout is Google Slides compatible, so you can share it with your audience and give them access to edit it. Therefore, download and save this well-researched illustrative data structure implementation quarterly roadmap slides in different formats like PDF, PNG, and JPG to smoothly execute your business plan.

Half Yearly Data Analytics Implementation Roadmap Demonstration
We present our half yearly data analytics implementation roadmap demonstration. This PowerPoint layout is easy-to-edit so you can change the font size, font type, color, and shape conveniently. In addition to this, the PowerPoint layout is Google Slides compatible, so you can share it with your audience and give them access to edit it. Therefore, download and save this well-researched half yearly data analytics implementation roadmap demonstration in different formats like PDF, PNG, and JPG to smoothly execute your business plan.

Big Data Opportunities And Challenges Template 2 Ppt PowerPoint Presentation Icon Background
This is a big data opportunities and challenges template 2 ppt powerpoint presentation icon background. This is a two stage process. The stages in this process are managing data quality, data integration.

Business Data Analysis Media Themes PDF
This is a business data analysis media themes pdf template with various stages. Focus and dispense information on one stage using this creative set, that comes with editable features. It contains large content boxes to add your information on topics like media is the most popular source of big data, as it provides valuable insights on consumer preferences and changing trends, media includes social media and interactive platforms, like google, facebook, twitter, youtube, instagram. You can also showcase facts, figures, and other relevant content using this PPT layout. Grab it now.

Business Data Analysis Social Influencers Diagrams PDF
Deliver an awe inspiring pitch with this creative business data analysis social influencers diagrams pdf bundle. Topics like analyst reports, subject matter experts, blog comments review sites, user forums can be discussed with this completely editable template. It is available for immediate download depending on the needs and requirements of the user.
Magnifying Glass And Data Assessment Vector Icon Ppt PowerPoint Presentation Styles Themes PDF
Presenting magnifying glass and data assessment vector icon ppt powerpoint presentation styles themes pdf to dispense important information. This template comprises three stages. It also presents valuable insights into the topics including magnifying glass and data assessment vector icon. This is a completely customizable PowerPoint theme that can be put to use immediately. So, download it and address the topic impactfully.
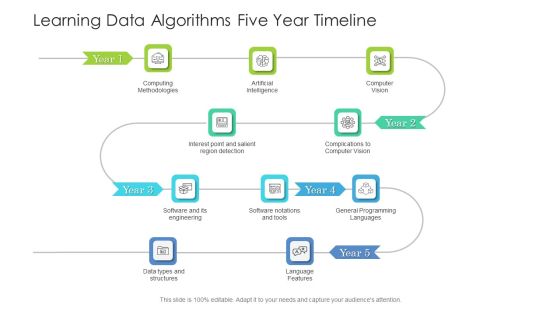
Learning Data Algorithms Five Year Timeline Structure
We present our learning data algorithms five year timeline structure. This PowerPoint layout is easy to edit so you can change the font size, font type, color, and shape conveniently. In addition to this, the PowerPoint layout is Google Slides compatible, so you can share it with your audience and give them access to edit it. Therefore, download and save this well researched learning data algorithms five year timeline structure in different formats like PDF, PNG, and JPG to smoothly execute your business plan.

Data Algorithm And Storage Management Ppt PowerPoint Presentation Icon Background Images
This is a data algorithm and storage management ppt powerpoint presentation icon background images. This is a four stage process. The stages in this process are data, analysis, data science, information science.
Meta Data Inventory Management Vector Icon Ppt PowerPoint Presentation Layouts Designs Download PDF
Presenting meta data inventory management vector icon ppt powerpoint presentation layouts designs download pdf to dispense important information. This template comprises three stages. It also presents valuable insights into the topics including meta data inventory management vector icon. This is a completely customizable PowerPoint theme that can be put to use immediately. So, download it and address the topic impactfully.
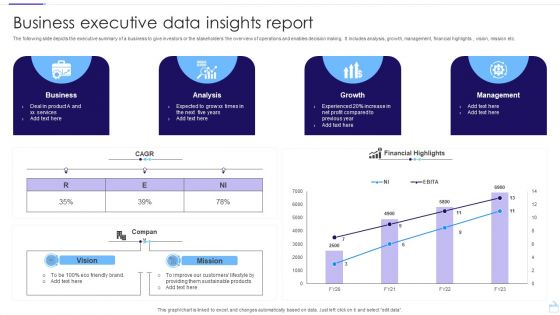
Business Executive Data Insights Report Pictures PDF
The following slide depicts the executive summary of a business to give investors or the stakeholders the overview of operations and enables decision making. It includes analysis, growth, management, financial highlights , vision, mission etc. Pitch your topic with ease and precision using this Business Executive Data Insights Report Pictures PDF. This layout presents information on Business, Analysis, Growth. It is also available for immediate download and adjustment. So, changes can be made in the color, design, graphics or any other component to create a unique layout.

Data Identification And Information Analysis Vector Icon Ppt PowerPoint Presentation Gallery Example PDF
Presenting data identification and information analysis vector icon ppt powerpoint presentation gallery example pdf to dispense important information. This template comprises three stages. It also presents valuable insights into the topics including data identification and information analysis vector icon. This is a completely customizable PowerPoint theme that can be put to use immediately. So, download it and address the topic impactfully.

Data Analysis With Bar Chart In Magnifying Glass Vector Icon Ppt PowerPoint Presentation File Model PDF
Presenting this set of slides with name data analysis with bar chart in magnifying glass vector icon ppt powerpoint presentation file model pdf. This is a one stage process. The stages in this process is data analysis with bar chart in magnifying glass vector icon. This is a completely editable PowerPoint presentation and is available for immediate download. Download now and impress your audience.

Data Quality Evaluation Vector Icon Ppt PowerPoint Presentation File Example PDF
Persuade your audience using this data quality evaluation vector icon ppt powerpoint presentation file example pdf. This PPT design covers three stages, thus making it a great tool to use. It also caters to a variety of topics including data quality evaluation vector icon. Download this PPT design now to present a convincing pitch that not only emphasizes the topic but also showcases your presentation skills.

 Home
Home