Data Flow

Circle Of Five Business Ideas PowerPoint Templates
Create visually amazing presentations with this circular diagram. Use this business slide to depict circular flow of activities. You may use this slide to share a plan to achieve the desired goals.

Notes On Laptop For Marketing Plan Example Powerpoint Template
This PowerPoint slide displays graphics of laptop with four sticky notes. This diagram is suitable to present marketing plan example. Visual effect of this diagram helps in maintaining the flow of the discussion and provides more clarity to the subject.

Pencils Round Bulb For Growth Strategies Powerpoint Template
This PowerPoint slide displays graphics of pencils around bulb. This diagram is suitable present growth strategies. Visual effect of this diagram helps in maintaining the flow of the discussion and provides more clarity to the subject.

Circular Infographic For Team Planning Powerpoint Templates
This business slide contains diagram of circular infographic. This circular diagram is suitable to present team planning concept. Visual effect of this diagram helps in maintaining the flow of the discussion and provides more clarity to the subject.
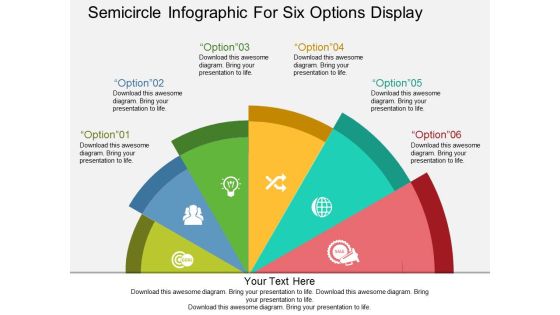
Semicircle Infographic For Six Options Display Powerpoint Templates
This business slide displays semicircle infographic. This PowerPoint template has been designed to display six business options. Visual effect of this diagram helps in maintaining the flow of the discussion and provides more clarity to the subject.

Six Stage Hexagonal Infographic Powerpoint Template
This PowerPoint template contains graphics of hexagonal infographic. This diagram is useful to display communication steps. Visual effect helps in maintaining the flow of the discussion and provides more clarity to the subject.

Cycle Diagram For Online Marketing Plans Powerpoint Template
This PowerPoint template contains graphics of circular diagram. This PPT slide is suitable to present marketing plans. Visual effect helps in maintaining the flow of the discussion and provides more clarity to the subject.
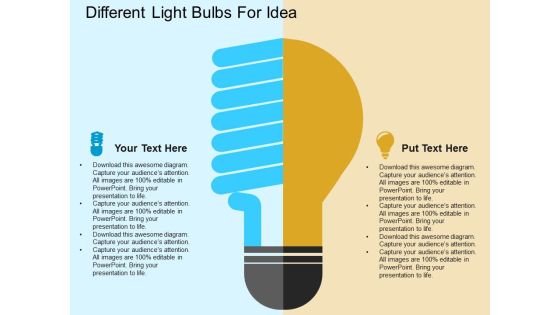
Different Light Bulbs For Idea Powerpoint Template
This business slide contains design of light bulbs. This diagram is suitable to present comparing and contrasting ideas. Visual effect of this diagram helps in maintaining the flow of the discussion and provides more clarity to the subject.

Order Fulfilment Presentation Powerpoint Templates
This is a order fulfilment presentation powerpoint templates. This is a six stage process. The stages in this process are manufacturing flow and scheduling, customer relationship management, order fulfilment, customer service, inventory control, demand forecasting.
Five Hexagons With Business Icons Powerpoint Templates
This PowerPoint template contains graphics of hexagons with business icons. This layout helps you to portray concepts teamwork, idea sharing and business analysis. Streamline the flow of information across the board using this diagram.
Business Diagram Icons For Supply Chain Logistics Presentation Template
This diagram slide has been designed with business flow chart. This slide can be used as framework to analyze level of competition within an industry and business strategy development. Mesmerize your audience with this slide.
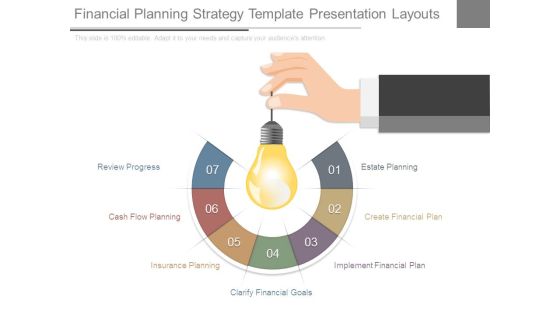
Financial Planning Strategy Template Presentation Layouts
This is a Financial Planning Strategy Template Presentation Layouts. This is a seven stage process. The stages in this process are review progress, cash flow planning, insurance planning, clarify financial goals, implement financial plan, create financial plan, estate planning.

Business Framework Strategy Making Processes PowerPoint Presentation
This business framework power point diagram template has been designed for business strategy making process flow representations. This diagram has been designed with text boxes graphic in a linear sequence. Display linear processes for any business and management related topics.

Business Diagram Five Staged Timeline For Business Agendas Presentation Template
Five staged text boxes has been used to craft this power point template. This PPT contains the business process flow and business agenda. Use this PPT for your business related topics in any presentation.
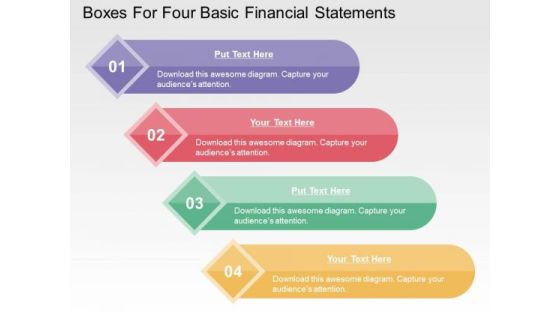
Boxes For Four Basic Financial Statements PowerPoint Templates
This business slide contains graphics of four text boxes. This diagram is suitable to present four basic financial statements. Visual effect of this diagram helps in maintaining the flow of the discussion and provides more clarity to the subject.
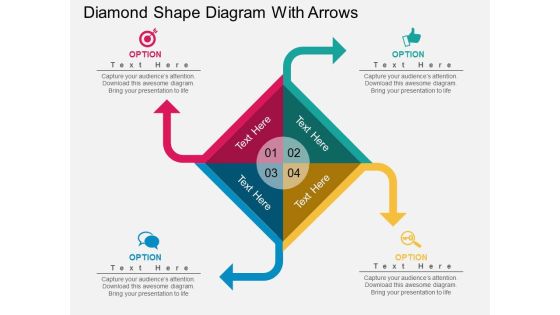
Diamond Shape Diagram With Arrows Powerpoint Template
Develop competitive advantage with our above template which contains diamond shape diagram with arrows. This diagram helps to display flow of business steps. You can edit text, color, shade and style as per you need.

Four Steps To Property Investment Success Powerpoint Template
This business slide contains four text tags in house shape. This diagram is suitable to present concepts of property investment. Visual effect helps in maintaining the flow of the discussion and provides more clarity to the subject.

Ideas For Business Partnership And Improvement Powerpoint Template
This business slide contains graphics of handshake with idea text. This diagram is suitable to present business partnership for improvement. Visual effect helps in maintaining the flow of the discussion and provides more clarity to the subject.
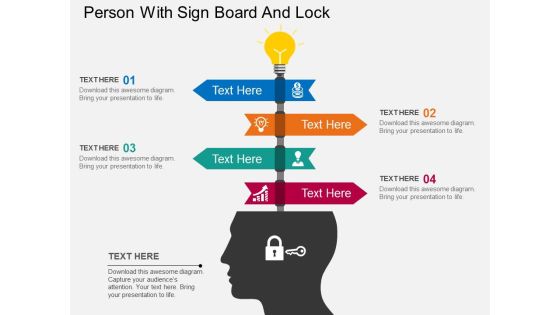
Person With Sign Board And Lock Powerpoint Template
This business slide contains person with sign board of his head and lock on face. This diagram is suitable to present strategic planning. Visual effect helps in maintaining the flow of the discussion and provides more clarity to the subject.
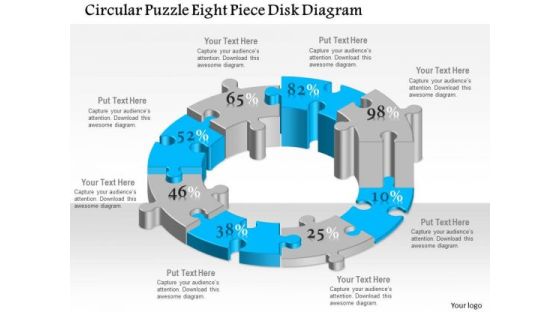
Business Diagram Circular Puzzle Eight Piece Disk Diagram Presentation Template
This business plan power point template has been designed with six staged circular puzzle diagram. This diagram template contains the concept of business process flow and result analysis representation. Use this diagram in your presentation and show these concepts.
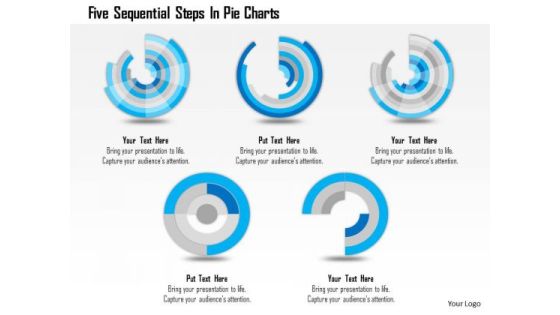
Business Diagram Five Sequential Steps In Pie Charts Presentation Template
Five sequential pie charts are used to craft this power point template. This PPT contains the concept of process flow and result analysis. Use this PPT for your business and sales related presentations and build quality presentation for your viewers.

Circular Process Arrows Infographic Diagram Powerpoint Template
This power point template has been designed with graphics of circular arrow flow diagram. This PPT diagram may be used to display marketing analysis. Use this PPT diagram for business presentations.

DNA Design Infographics For Research Powerpoint Slides
This business slide contains four DNA infographic structure. This diagram is suitable to present business research and analysis. Visual effect of this diagram helps in maintaining the flow of the discussion and provides more clarity to the subject.

Organizational Structure Presentation Powerpoint Example
This is an organizational structure presentation powerpoint example. This is a six stage process. The stages in this process are organizational structure, roles and responsibilities, leadership team roles, work flow analysis, productivity measures, valuing diverse contributions.
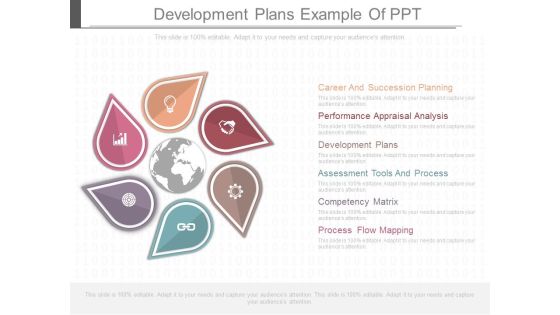
Development Plans Example Of Ppt
This is a development plans example of ppt. This is a six stage process. The stages in this process are career and succession planning, performance appraisal analysis, development plans, assessment tools and process, competency matrix, process flow mapping.
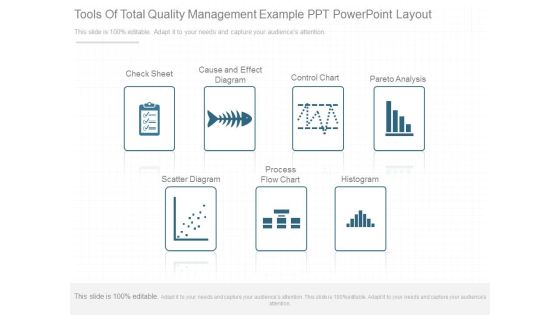
Tools Of Total Quality Management Example Ppt Powerpoint Layout
This is a tools of total quality management example ppt powerpoint layout. This is a seven stage process. The stages in this process are check sheet, cause and effect diagram, control chart, pareto analysis, scatter diagram, process flow chart, histogram.
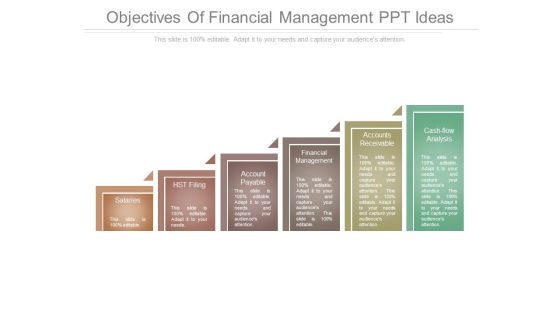
Objectives Of Financial Management Ppt Ideas
This is a objectives of financial management ppt ideas. This is a six stage process. The stages in this process are salaries, hst filing, account payable, financial management, accounts receivable, cash flow analysis.
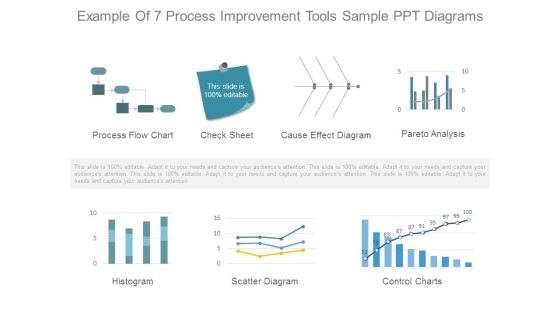
Example Of 7 Process Improvement Tools Sample Ppt Diagrams
This is a example of 7 process improvement tools sample ppt diagrams. This is a seven stage process. The stages in this process are process flow chart, check sheet, cause effect diagram, pareto analysis, histogram, scatter diagram, control charts.

Activity Network Diagram Ppt PowerPoint Presentation Deck
This is a activity network diagram ppt powerpoint presentation deck. This is a five stage process. The stages in this process are business, strategy, analysis, marketing, hexagon, flow process.

Stock Photo Blue Sphere On Chess Board PowerPoint Slide
The above image shows graphic of blue sphere on chess board. This image is designed with blue sphere on chess board to define concepts like Leadership and strategy. Streamline the flow of information across the board.

Stock Photo Euro Symbol On Missing Puzzle Piece PowerPoint Slide
This image slide contains graphic of euro symbol on missing puzzle piece. This layout helps you to portray concepts related to finance, money, and business strategy. Streamline the flow of information across the board.

Business Framework Brand Equity Development PowerPoint Presentation
This power point diagram slide has been crafted with graphic of two axial flow chart. This chart refers to the concept of brand equity development. Display this concept in your presentations and get detailed information about brand architecture.
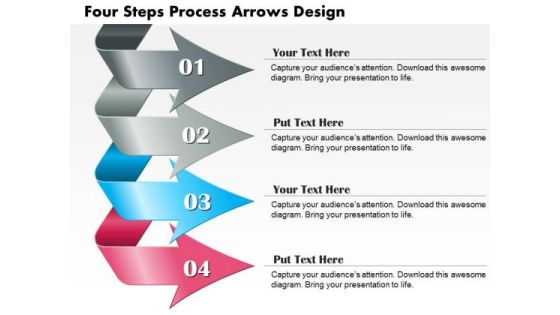
Business Diagram Four Steps Process Arrows Design Presentation Template
This Business diagram contains graphic of arrows representing steps of a process. This layout helps you to bring some important aspects of your business process to the notice of all concerned. Streamline the flow of information across the board.

Circle Of Ribbon Tags And Six Icons Powerpoint Template
This business slide contains circle of ribbon tags with six icons. This diagram provides schematic representation of any information. Visual effect this slide helps in maintaining the flow of the discussion and provides more clarity to the subject.

Diagram Of Business Infographic Powerpoint Template
This PowerPoint template has been designed with infographic diagram. This diagram provides schematic representation of any information. Visual effect this slide helps in maintaining the flow of the discussion and provides more clarity to the subject.

Eight Petals Circular Infographic Diagram Powerpoint Template
This business slide contains eight petals circular infographic diagram. This diagram provides schematic representation of any information. Visual effect this slide helps in maintaining the flow of the discussion and provides more clarity to the subject.
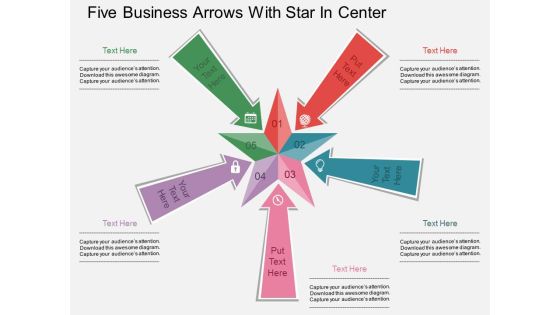
Five Business Arrows With Star In Center Powerpoint Template
This business slide contains circle of five arrows around star. This diagram provides schematic representation of any information. Visual effect this slide helps in maintaining the flow of the discussion and provides more clarity to the subject.

Arrow Made Of Circles With Icons Powerpoint Templates
This business slide contains diagram of arrow infographic. Download this diagram to display information in visual manner. Visual effect of this diagram helps in maintaining the flow of the discussion and provides more clarity to the subject.

Colorful Infographics For Corporate Financing Powerpoint Template
This business slide contains five steps circular infographic design. This diagram provides schematic representation of any information. Visual effect this slide helps in maintaining the flow of the discussion and provides more clarity to the subject.

Circular Alphabetic Steps For Educational Strategy Powerpoint Slides
This business slide contains circular infographic design. This diagram provides schematic representation of any information. Visual effect this slide helps in maintaining the flow of the discussion and provides more clarity to the subject.

Circular Banners With Business Icons Powerpoint Slides
This business slide contains circular infographic design. This diagram provides schematic representation of any information. Visual effect this slide helps in maintaining the flow of the discussion and provides more clarity to the subject.

Circular Petal Chart With Icons Powerpoint Slides
This business slide contains circular infographic design. This diagram provides schematic representation of any information. Visual effect this slide helps in maintaining the flow of the discussion and provides more clarity to the subject.

Eight Steps Circle Infographic Chart Powerpoint Slides
This business slide contains circular infographic design. This diagram provides schematic representation of any information. Visual effect this slide helps in maintaining the flow of the discussion and provides more clarity to the subject.
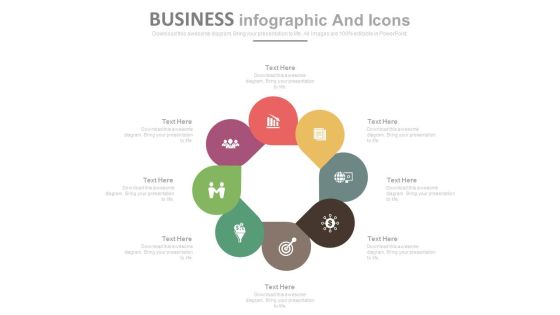
Eight Steps Circular Business Infographics Powerpoint Slides
This business slide contains circular infographic design. This diagram provides schematic representation of any information. Visual effect this slide helps in maintaining the flow of the discussion and provides more clarity to the subject.

Six Steps Circular Chart For Workflow Powerpoint Slides
This business slide contains circular infographic design. This diagram provides schematic representation of any information. Visual effect this slide helps in maintaining the flow of the discussion and provides more clarity to the subject.

Six Steps Circular Puzzle Timeline Chart Powerpoint Slides
This business slide contains circular infographic design. This diagram provides schematic representation of any information. Visual effect this slide helps in maintaining the flow of the discussion and provides more clarity to the subject.
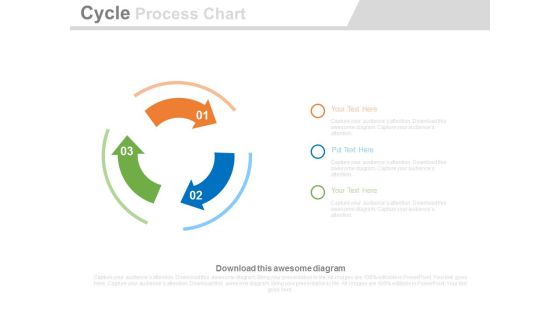
Three Arrows Cycles Process Chart Powerpoint Slides
This business slide contains three arrows cycle chart. This diagram provides schematic representation of any information. Visual effect this slide helps in maintaining the flow of the discussion and provides more clarity to the subject.
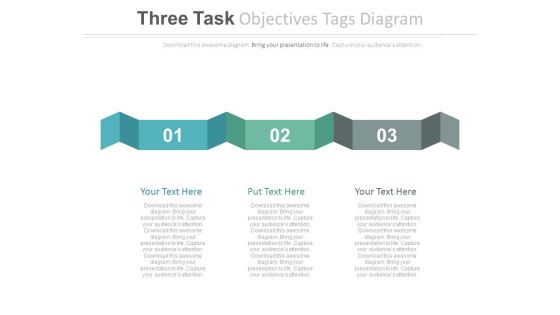
Three Business Steps Curved Tag Powerpoint Slides
This business slide contains three business steps curved tags. This diagram provides schematic representation of any information. Visual effect this slide helps in maintaining the flow of the discussion and provides more clarity to the subject.

Circle Diagram For Business Communication Powerpoint Template
This business slide contains circle process diagram with icons. This diagram provides schematic representation of any information. Visual effect this slide helps in maintaining the flow of the discussion and provides more clarity to the subject.

Circles Infographics For Business Services Powerpoint Template
This business slide contains five circles process diagram. This diagram provides schematic representation of any information. Visual effect this slide helps in maintaining the flow of the discussion and provides more clarity to the subject.
Pentagon With Arrows With Team Icon Powerpoint Template
This business slide contains five arrows pentagon chart. This diagram provides schematic representation of any information. Visual effect this slide helps in maintaining the flow of the discussion and provides more clarity to the subject.

Six Steps Hexagon For Underlying Assumptions Powerpoint Template
This business slide contains diagram of six steps hexagon. This diagram provides schematic representation of any information. Visual effect this slide helps in maintaining the flow of the discussion and provides more clarity to the subject.

Missing Puzzle Business Plan Diagram Powerpoint Slides
This PowerPoint template has been designed with puzzle layout and missing piece. This diagram provides schematic representation of any information. Visual effect this slide helps in maintaining the flow of the discussion and provides more clarity to the subject.

Puzzle Design With Missing Piece Powerpoint Slides
This PowerPoint template has been designed with puzzle layout and missing piece. This diagram provides schematic representation of any information. Visual effect this slide helps in maintaining the flow of the discussion and provides more clarity to the subject.
Six Icons Diagram For Business Process Powerpoint Slides
This PowerPoint template has been designed with infographic diagram. This diagram provides schematic representation of any information. Visual effect this slide helps in maintaining the flow of the discussion and provides more clarity to the subject.
Target Board With Planning Icons Powerpoint Slides
This PowerPoint template has been designed with target board and planning icons. This diagram provides schematic representation of any information. Visual effect this slide helps in maintaining the flow of the discussion and provides more clarity to the subject.

Social Media Communication Techniques And Strategy Powerpoint Template
This business slide displays social media communication techniques. Download this diagram to display information in visual manner. Visual effect of this diagram helps in maintaining the flow of the discussion and provides more clarity to the subject.
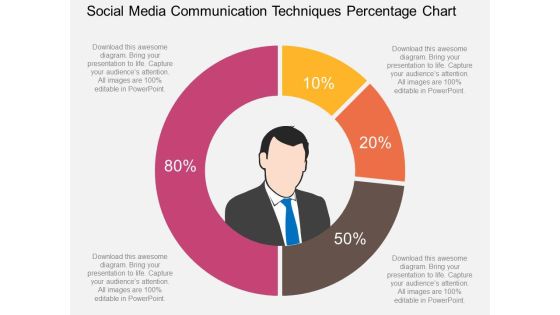
Social Media Communication Techniques Percentage Chart Powerpoint Template
This business slide displays percentage chart of social media communication techniques. Download this diagram to display information in visual manner. Visual effect of this diagram helps in maintaining the flow of the discussion and provides more clarity to the subject.

Social Network Communication Strategy Powerpoint Template
This business slide displays diagram of social network and communication strategy. Download this diagram to display information in visual manner. Visual effect of this diagram helps in maintaining the flow of the discussion and provides more clarity to the subject.
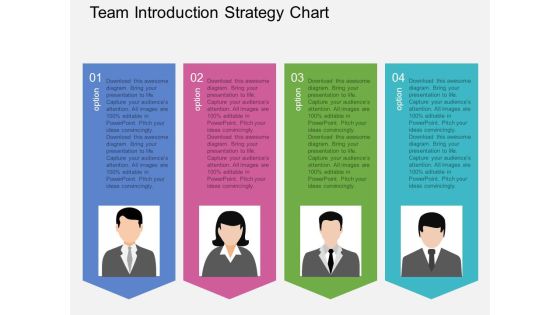
Team Introduction Strategy Chart Powerpoint Template
This business slide displays graphics of team introduction strategy chart. Download this diagram to display information in visual manner. Visual effect of this diagram helps in maintaining the flow of the discussion and provides more clarity to the subject.
 Home
Home