Data Flow

Business Portal Statistical Assessment For Project Completion Ppt Layouts Format Ideas PDF
Presenting business portal statistical assessment for project completion ppt layouts format ideas pdf to dispense important information. This template comprises five stages. It also presents valuable insights into the topics including exploration, analysis, repository, projects, conduct analysis. This is a completely customizable PowerPoint theme that can be put to use immediately. So, download it and address the topic impactfully.
Ppt Slides With 5 Stages Semicircle Chart PowerPoint Templates
PPT Slides with 5 Stages SemiCircle Chart PowerPoint templates-These high quality powerpoint pre-designed slides and powerpoint templates have been carefully created by our professional team to help you impress your audience. All slides have been created and are 100% editable in powerpoint. Each and every property of any graphic - color, size, orientation, shading, outline etc. can be modified to help you build an effective powerpoint presentation. Any text can be entered at any point in the powerpoint template or slide. Simply DOWNLOAD, TYPE and PRESENT!-These PowerPoint presentation slides can be used to represent concepts relating to--Abstract, action, analysis, blank, business, chart, clipart, commerce, concept, conceptual, design, diagram, direction, flow, generic, goals, guide, guidelines, heirarchy, icon, idea, illustration, lingakes, links, manage, management, mba, model, organization, performance, plan, process, project, relationship, representation, resource, steps, strategy, success, tactics, theoretical, theory, tool, workflow-PPT Slides with 5 Stages SemiCircle Chart PowerPoint templates

Process Diagram Chart With 4 Spherical Stages PowerPoint Templates
Process Diagram Chart with 4 Spherical Stages PowerPoint templates-These high quality powerpoint pre-designed slides and powerpoint templates have been carefully created by our professional team to help you impress your audience. All slides have been created and are 100% editable in powerpoint. Each and every property of any graphic - color, size, orientation, shading, outline etc. can be modified to help you build an effective powerpoint presentation. Any text can be entered at any point in the powerpoint template or slide. Simply DOWNLOAD, TYPE and PRESENT!-These PowerPoint presentation slides can be used to represent concepts relating to--Abstract, action, analysis, blank, business, chart, clipart, commerce, concept, conceptual, design, diagram, direction, flow, generic, goals, guide, guidelines, heirarchy, icon, idea, illustration, lingakes, links, manage, management, mba, model, organization, performance, plan, process, project, relationship, representation, resource, steps, strategy, success, tactics, theoretical, theory, tool, workflow-Process Diagram Chart with 4 Spherical Stages PowerPoint templates
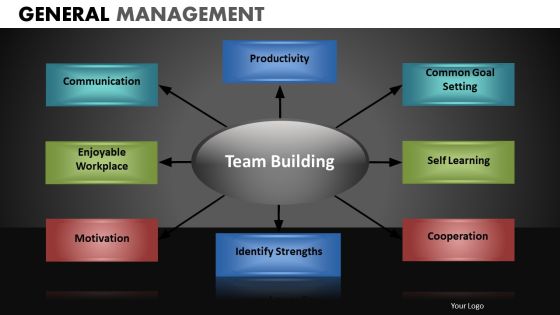
Process Flowchart Arrows PowerPoint Ppt Templates
Process FlowChart Arrows PowerPoint PPT templates-These high quality powerpoint pre-designed slides and powerpoint templates have been carefully created by our professional team to help you impress your audience. All slides have been created and are 100% editable in powerpoint. Each and every property of any graphic - color, size, orientation, shading, outline etc. can be modified to help you build an effective powerpoint presentation. Any text can be entered at any point in the powerpoint template or slide. Simply DOWNLOAD, TYPE and PRESENT!-These PowerPoint presentation slides can be used to represent concepts relating to--Abstract, action, analysis, blank, business, chart, clipart, commerce, concept, conceptual, design, diagram, direction, flow, generic, goals, guide, guidelines, heirarchy, icon, idea, illustration, lingakes, links, manage, management, mba, model, organization, performance, plan, process, project, relationship, representation, resource, steps, strategy, success, tactics, theoretical, theory, tool, workflow-Process FlowChart Arrows PowerPoint PPT templates
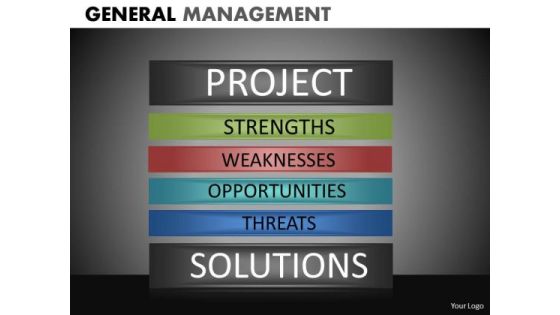
Project Solutions PowerPoint Templates Editable Ppt Slides
Project Solutions PowerPoint templates Editable PPT Slides-These high quality powerpoint pre-designed slides and powerpoint templates have been carefully created by our professional team to help you impress your audience. All slides have been created and are 100% editable in powerpoint. Each and every property of any graphic - color, size, orientation, shading, outline etc. can be modified to help you build an effective powerpoint presentation. Any text can be entered at any point in the powerpoint template or slide. Simply DOWNLOAD, TYPE and PRESENT!-These PowerPoint presentation slides can be used to represent concepts relating to--Abstract, action, analysis, blank, business, chart, clipart, commerce, concept, conceptual, design, diagram, direction, flow, generic, goals, guide, guidelines, heirarchy, icon, idea, illustration, lingakes, links, manage, management, mba, model, organization, performance, plan, process, project, relationship, representation, resource, steps, strategy, success, tactics, theoretical, theory, tool, workflow-Project Solutions PowerPoint templates Editable PPT Slides
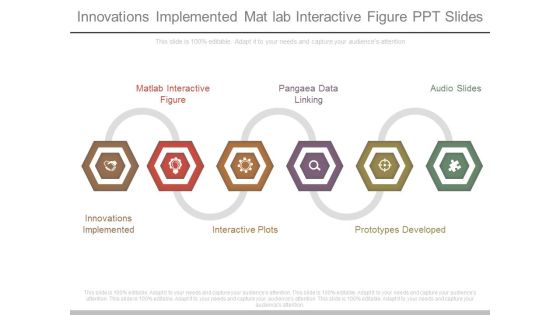
Innovations Implemented Mat Lab Interactive Figure Ppt Slides
This is a innovations implemented mat lab interactive figure ppt slides. This is a six stage process. The stages in this process are mat lab interactive figure, pangaea data linking, audio slides, innovations implemented, interactive plots, prototypes developed.

Statistical Assessment Process With Collection And Distribution Ppt File Introduction PDF
Presenting statistical assessment process with collection and distribution ppt file introduction pdf to dispense important information. This template comprises eight stages. It also presents valuable insights into the topics including concept, processing, distribution, archiving, repurposing. This is a completely customizable PowerPoint theme that can be put to use immediately. So, download it and address the topic impactfully.

Business Diagram Statistical Process Control And Quality Improvement PowerPoint Ppt Presentation
Edit Your Work With Our Business Diagram statistical process control and quality improvement PowerPoint PPT Presentation Powerpoint Templates. They Will Help You Give The Final Form.

Administrative Regulation Promoting And Distributing Ppt PowerPoint Presentation Infographics Professional PDF
This is a administrative regulation promoting and distributing ppt powerpoint presentation infographics professional pdf template with various stages. Focus and dispense information on five stages using this creative set, that comes with editable features. It contains large content boxes to add your information on topics like product flow, negotiation flow, ownership flow, information flow, promotion flow. You can also showcase facts, figures, and other relevant content using this PPT layout. Grab it now.
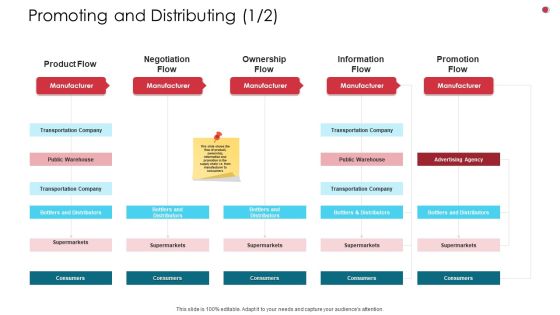
Promoting And Distributing Consumer Business Analysis Method Ppt Ideas Graphics PDF
This is a promoting and distributing consumer business analysis method ppt ideas graphics pdf template with various stages. Focus and dispense information on one stages using this creative set, that comes with editable features. It contains large content boxes to add your information on topics like manufacturer, negotiation flow, ownership flow, transportation company. You can also showcase facts, figures, and other relevant content using this PPT layout. Grab it now.

Business Diagram Five Staged Pencil Style Text Boxes Presentation Template
Our above slide displays five staged pencil style text boxes. Download our above diagram to express information in a visual way. Use this diagram and get good comments for data related presentations.
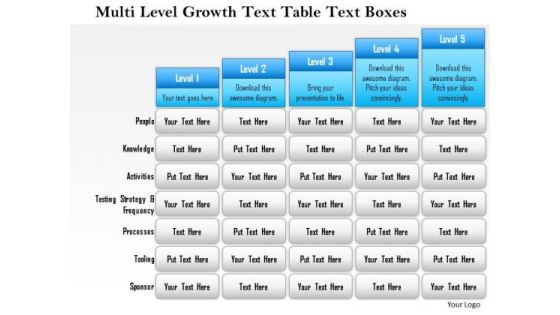
Business Framework Multi Level Growth Text Table Text Boxes 2 PowerPoint Presentation
Five staged text box style chart in bar graph design has been used to decorate this power point template slide. This diagram slide contains the multilevel growth concept. Use this PPT slide for financial growth and result analysis related topics.

Business Diagram Three Colored Text Boxes Representation PowerPoint Template
Three colored text boxes diagram has been used to design this power point template. This PPT contains the concept of process based data representation. This PPT is suitable for business and sales related presentations.

Business Framework Abc Analysis PowerPoint Presentation
Download this abc analysis diagram for business presentations. Use this business framework diagram to show the influence, flow, or progression of steps in a process or event.
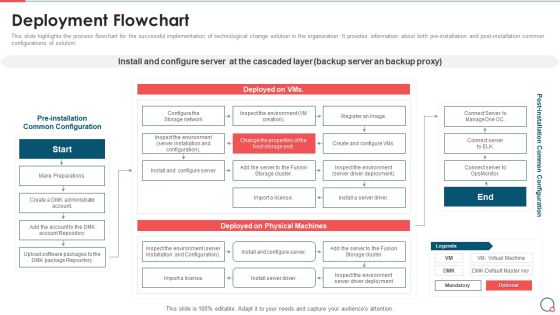
Information Technology Change Implementation Plan Deployment Flowchart Introduction PDF
This slide highlights the process flowchart for the successful implementation of technological change solution in the organization. It provides information about both pre-installation and post-installation common configurations of solution. This is a Information Technology Change Implementation Plan Deployment Flowchart Introduction PDF template with various stages. Focus and dispense information on three stages using this creative set, that comes with editable features. It contains large content boxes to add your information on topics like Pre installation Common Configuration, Make Preparations, Deployed on Physical Machines. You can also showcase facts, figures, and other relevant content using this PPT layout. Grab it now.

Business Analysis Tools Presentation Images
This is a business analysis tools presentation images. This is a eight stage process. The stages in this process are actionable insights and outcomes, management, organization, strategy, marketing, analysis, information and data assets, business contact and user experience.
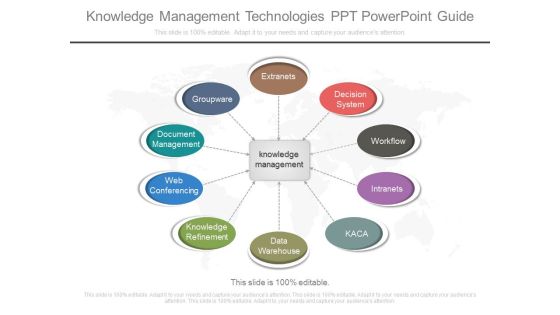
Knowledge Management Technologies Ppt Powerpoint Guide
This is a knowledge management technologies ppt powerpoint guide. This is a ten stage process. The stages in this process are extranets, groupware, document management, web conferencing, knowledge refinement, data warehouse, decision system, workflow, intranets, kaca, knowledge management.

Various Information Technology Departments In Company Slides PDF
This slide shows the IT department structure in the company that includes various division such as Research and Development, Product Development, Administration Development, Support and Security Department and IT Services Development. This is a various information technology departments in company slides pdf template with various stages. Focus and dispense information on four stages using this creative set, that comes with editable features. It contains large content boxes to add your information on topics like product development, administration department, research and development, support and security department. You can also showcase facts, figures, and other relevant content using this PPT layout. Grab it now.

User Experience Management With Database Diagram Slides
This is a user experience management with database diagram slides. This is a six stage process. The stages in this process are web, harvesting, text database, linguistic analysis, refinement, fact database, data analysis, web ui, alerts, api, user experience.

Product Profitability Comparison Matrix Table PowerPoint Templates
Product Profitability Comparison Matrix Table PowerPoint Templates-These high quality powerpoint pre-designed slides and powerpoint templates have been carefully created by our professional team to help you impress your audience. All slides have been created and are 100% editable in powerpoint. Each and every property of any graphic - color, size, orientation, shading, outline etc. can be modified to help you build an effective powerpoint presentation. Any text can be entered at any point in the powerpoint template or slide. Simply DOWNLOAD, TYPE and PRESENT!-These PowerPoint presentation slides can be used to represent concepts relating to--abstract, achievement, aim, arrow, background, business, chart, communication, company, competition, concept, design, development, diagram, direction, finance, financial, forecast, forward, goal, graph, graphic, growth, icon, illustration, increase, investment, leader, leadership, marketing, motion, moving, orange, path, price, process, profit, progress, shape, sign, success, symbol, target, team, teamwork, up, upwards-Product Profitability Comparison Matrix Table PowerPoint Templates
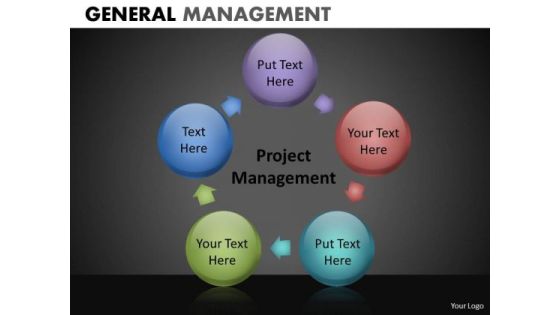
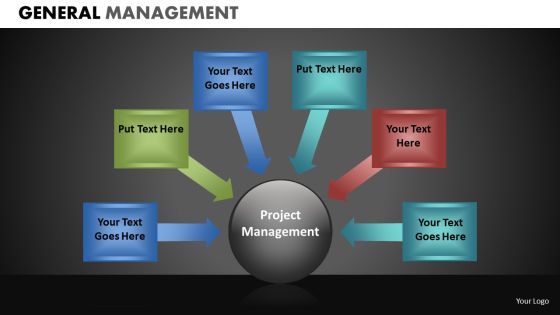
Project Management Circle Chart With Spherical Stages PowerPoint Slides Download
Project Management Circle Chart with Spherical Stages PowerPoint Slides Download-These high quality powerpoint pre-designed slides and powerpoint templates have been carefully created by our professional team to help you impress your audience. All slides have been created and are 100% editable in powerpoint. Each and every property of any graphic - color, size, orientation, shading, outline etc. can be modified to help you build an effective powerpoint presentation. Any text can be entered at any point in the powerpoint template or slide. Simply DOWNLOAD, TYPE and PRESENT!-These PowerPoint presentation slides can be used to represent concepts relating to--abstract, achievement, aim, arrow, background, business, chart, communication, company, competition, concept, design, development, diagram, direction, finance, financial, forecast, forward, goal, graph, graphic, growth, icon, illustration, increase, investment, leader, leadership, marketing, motion, moving, orange, path, price, process, profit, progress, shape, sign, success, symbol, target, team, teamwork, up, upwards-Project Management Circle Chart with Spherical Stages PowerPoint Slides Download
Five Banners With Communication And Technology Icons Powerpoint Template
This PowerPoint template has been designed with five banners and communication technology icons. This diagram is excellent visual tools for business presentations. Download this PPT slide to explain complex data immediately and clearly.

Market Research And Analysis Diagram Ppt Sample
This is a market research and analysis diagram ppt sample. This is a five stage process. The stages in this process are location analysis, data mining, sowt analysis, market research and analysis, competition analysis, marketing potential.

Market Competitive Analysis Powerpoint Slide Deck
This is a market competitive analysis powerpoint slide deck. This is a six stage process. The stages in this process are customer analysis, true capabilities analysis, market competitive analysis, positioning and differentiating, segmenting and targeting, data mining and profiting.
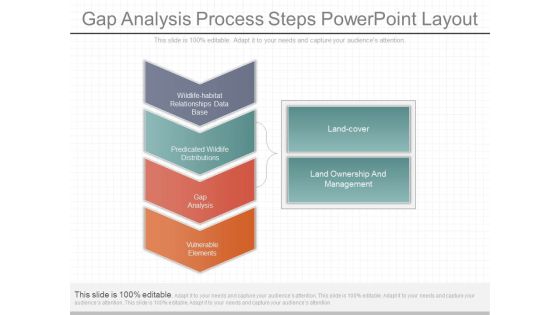
Gap Analysis Process Steps Powerpoint Layout
This is a gap analysis process steps powerpoint layout. This is a six stage process. The stages in this process are wildlife habitat relationships data base, predicated wildlife distributions, gap analysis, vulnerable elements, land cover, land ownership and management.

Financial Analysis Basics Ppt Slide Examples
This is a financial analysis basics ppt slide examples. This is a three stage process. The stages in this process are reduce uncertainty, apply analytical tools, involves data transform.
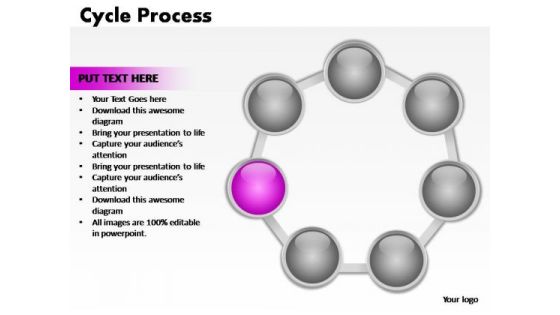
PowerPoint Slides Company Cycle Process Ppt Design
PowerPoint Slides Company Cycle Process PPT Design-Cycle Diagrams are a type of graphics that shows how items are related to one another in a repeating cycle. In a cycle diagram, you can explain the main events in the cycle, how they interact, and how the cycle repeats. These Diagrams can be used to interact visually and logically with audiences. -PowerPoint Slides Company Cycle Process PPT Design

Business Diagram Four Design For Concept Coding Presentation Template
Four colorful text boxes has been used to craft this power point template. This PPT diagram contains the concept of coding and data representation. Use this PPT for business and technology related presentations.

Business Diagram Three Different Pie Charts For Result Analysis Presentation Template
Three different pie charts are used to designed this power point template slide. This PPT slide contains the concept of result analysis. Use this PPT slide for your data and process related presentations.
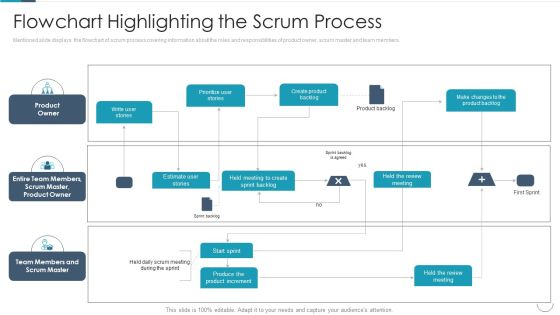
Professional Agile Master Certification Procedure Information Technology Flowchart Highlighting The Scrum Information PDF
Mentioned slide displays the flowchart of scrum process covering information about the roles and responsibilities of product owner, scrum master and team members. This is a professional agile master certification procedure information technology flowchart highlighting the scrum information pdf template with various stages. Focus and dispense information on three stages using this creative set, that comes with editable features. It contains large content boxes to add your information on topics like product owner, entire team members, scrum master, product owner, team members and scrum master. You can also showcase facts, figures, and other relevant content using this PPT layout. Grab it now.
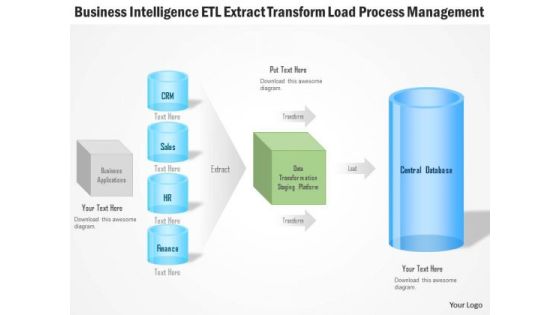
Business Diagram Business Intelligence Etl Extract Transform Load Process Management Ppt Slide
Explain the load process management and ETL extract transform with this unique PPT. This PPT contains the graphic of computer server and data base with connectivity. This PPT can be used for business intelligence related topics in any presentation.
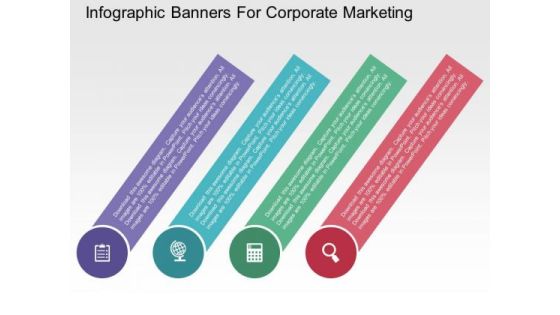
Infographic Banners For Corporate Marketing PowerPoint Templates
Our above PPT slide contains diagram of infographic banners. It helps to display steps of corporate marketing. Use this diagram to impart more clarity to data and to create more sound impact on viewers.
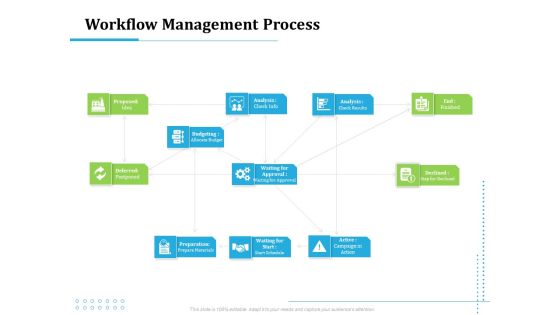
Information Technology Functions Management Workflow Management Process Ppt Layouts Introduction PDF
This is a information technology functions management workflow management process ppt layouts introduction pdf template with various stages. Focus and dispense information on eleven stages using this creative set, that comes with editable features. It contains large content boxes to add your information on topics like proposed, idea, preparation, waiting, active, declined, analysis, waiting approval, budgeting. You can also showcase facts, figures, and other relevant content using this PPT layout. Grab it now.
Business Diagram Three Staged Gear Diagram With Icons PowerPoint Template
Graphic of three staged gear and icons diagram has been used to craft this power point template diagram. This PPT contains the concept of data and text representation. Use this PPT diagram for your marketing and management related presentations.

Business Diagram Colorful Boxes For Business Options Presentation Template
Graphics of colorful text boxes have been used to design this power point template. This diagram contains the concept of data representation. Illustrate your ideas and imprint them in the minds of your team with this template.
Six Staged Infographics Square With Business Icons Powerpoint Templates
This business diagram displays circular puzzle infographic. This editable slide is suitable to present global communication. Use this diagram for business and finance related topics and display complete data analysis in your presentation.
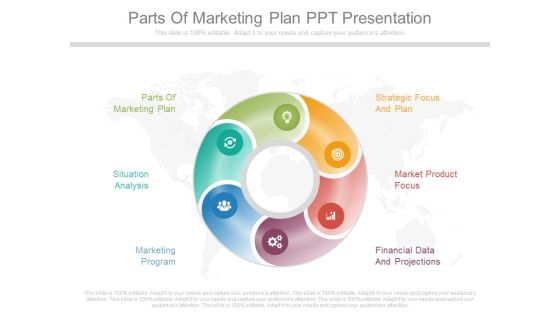
Parts Of Marketing Plan Ppt Presentation
This is a parts of marketing plan ppt presentation. This is a six stage process. The stages in this process are parts of marketing plan, strategic focus and plan, situation analysis, market product focus, marketing program, financial data and projections.

Email Survey Service Diagram Ppt Slide Design
This is a email survey service diagram ppt slide design. This is a four stage process. The stages in this process are design, administration, data collection, report and analysis.

Storage Resource Management Ppt Slides
This is a storage resource management ppt slides. This is a one stage process. The stages in this process are data collection, analysis report generation, qsm repository, threshold checker, presentation.\n\n\n\n\n\n

Key Elements Of Effective Ip Portfolio Management Powerpoint Ideas
This is a key elements of effective ip portfolio management powerpoint ideas. This is a three stage process. The stages in this process are communication, continuous improvement, ip analysis, ip database system, ip data mining.

Strategic Sourcing Implementation Ppt Presentation Pictures
This is a strategic sourcing implementation ppt presentation pictures. This is a seven stage process. The stages in this process are data collection and analysis, sensor supplier, resister supplier, connectors supplier, switches supplier, cable supplier, costumer.
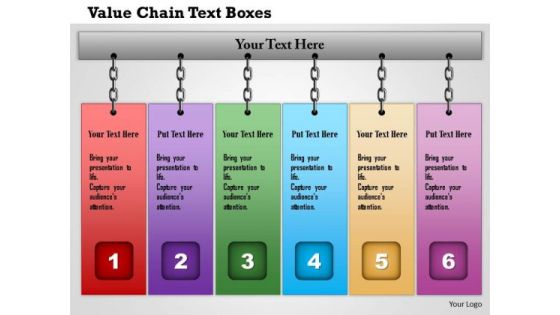
Business Framework Value Chain Text Boxes PowerPoint Presentation
This business diagram displays framework for value chain. This slide contains graphic of colorful tags in linear order. This editable diagram may be used for business and sales related presentations.

Cloud Based Marketing Services Powerpoint Slides
This is a cloud based marketing services powerpoint slides. This is a seven stage process. The stages in this process are content marketing, social marketing, targeting and segmentation, multi channel campaign management, data management, sales enablement, reporting and analytics.

Benefits Of Marketing Automation And Advertising Ppt Powerpoint Presentation
This is a benefits of marketing automation and advertising ppt powerpoint presentation. This is a six stage process. The stages in this process are data integration, map customers journey, engaging content, build targeted lists, execute campaigns, responsive design.
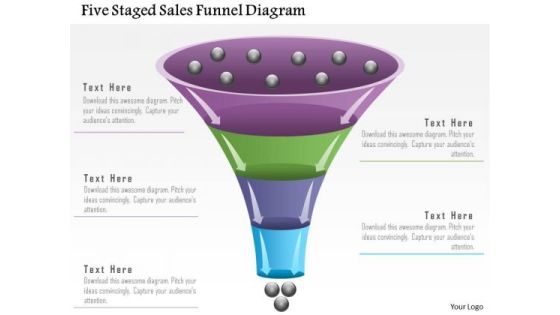
Business Diagram Five Staged Sales Funnel Diagram Presentation Template
Our above slide displays five staged sales funnel diagram. Download our above diagram to express information in a visual way. Use this diagram and get good comments for data related presentations.
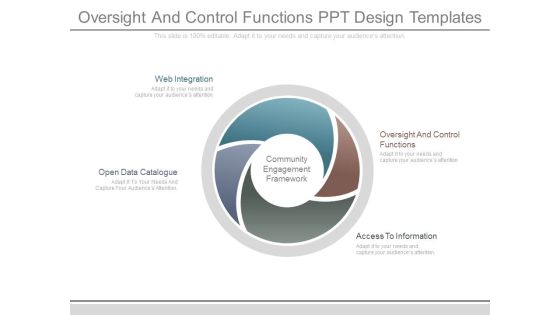
Oversight And Control Functions Ppt Design Templates
This is a oversight and control functions ppt design templates. This is a four stage process. The stages in this process are web integration, oversight and control functions, access to information, open data catalogue, community engagement framework.

PowerPoint Design Cycle Process Chart Ppt Design
PowerPoint Design Cycle Process Chart PPT Design-This Cycle process diagram depicts process stages in a more understandable and vivid manner. Use this diagram to represent data that is easy to comprehend and analyze.-PowerPoint Design Cycle Process Chart PPT Design
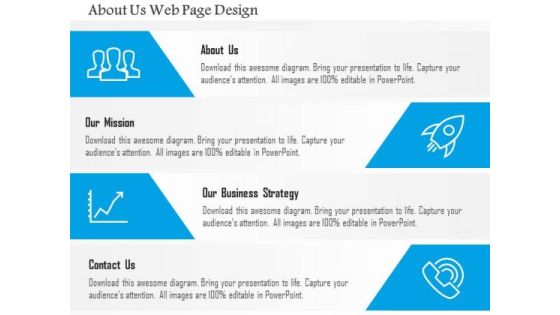
Business Diagram About Us Web Page Design Presentation Template
This power point template diagram has been designed with graphic of four icons. This PPT can represent the concept of building about us. This PPT is suitable for business and data related presentations.
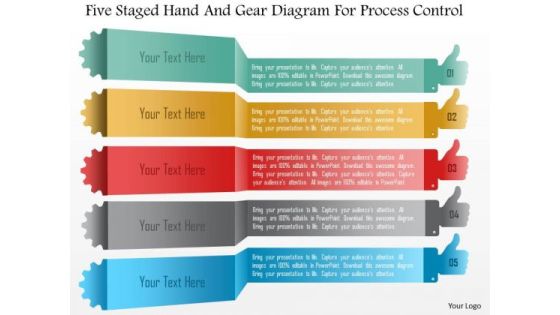
Business Diagram Five Staged Hand And Gear Diagram For Process Control PowerPoint Template
Five staged hand and gear diagram has been used to design this power point template. This PPT contains the concept of data representation and process control. Use this PPT slide for your marketing and business process related presentations.

Business Diagram Three Circular Financial Pie Chart PowerPoint Template
This power point template has been designed with graphic of three circular pie chart. This pie chart is suitable for financial data representation. Use this PPt for your business and finance related presentations.
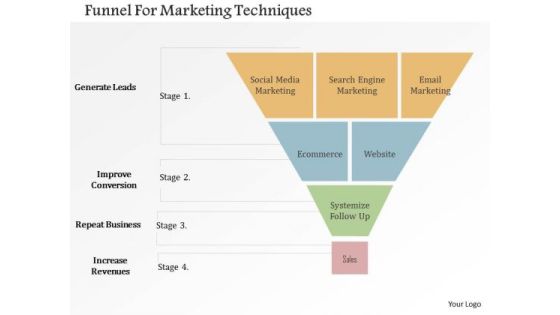
Business Diagram Funnel For Marketing Techniques Presentation Template
Our above slide contains graphics of funnel diagram. It helps to exhibit marketing techniques. Use this diagram to impart more clarity to data and to create more sound impact on viewers.
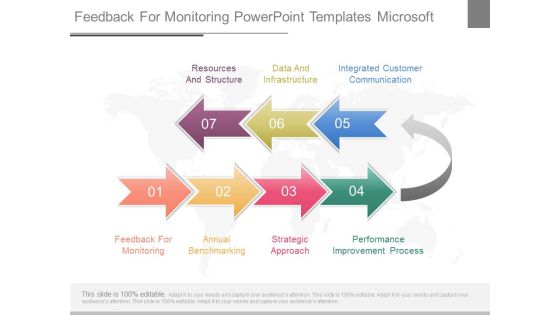
Feedback For Monitoring Powerpoint Templates Microsoft
This is a feedback for monitoring powerpoint templates microsoft. This is a seven stage process. The stages in this process are resources and structure, data and infrastructure, integrated customer communication, feedback for monitoring, annual benchmarking, strategic approach, performance improvement process.\n\n\n

Representation To Other Executives Ppt Presentation
This is a representation to other executives ppt presentation. This is a four stage process. The stages in this process are data collection clerks, strong people skills, clear understand of overall change initiative, representation to other executives.

Technical Specifications Powerpoint Slide Presentation Tips
This is a technical specifications powerpoint slide presentation tips. This is a seven stage process. The stages in this process are discovery planning and development, project brief, user profiles, assets inventory, technical specifications, data entry.

Web Acceleration Security Software Example Of Ppt
This is a web acceleration security software example of ppt. This is a four stage process. The stages in this process are web acceleration, security software, shopping carts, data services.

Sample Of Dbms Model Diagram Powerpoint Slides
This is a sample of dbms model diagram powerpoint slides. This is a one stage process. The stages in this process are applications, sql, query processor, buffer manager, disk space and io manage, data files, logs, index structure.

Best Practices In Market Risk Ppt Sample
This is a best practices in market risk ppt sample. This is a five stage process. The stages in this process are trade management, risk management, physical operation, financial, market data and analytics.

Database Layout Tool Diagram Presentation Visuals
This is a database layout tool diagram presentation visuals. This is a three stage process. The stages in this process are database concepts, data modeling, database layout tool, database design.\n\n\n\n

Outputs And Methodology Ppt Background
This is a outputs and methodology ppt background. This is a six stage process. The stages in this process are jump start, preliminary insights, cautions and anomalies, learning moments, outputs and methodology, data checks and suggestions.

Customer Experience Management Strategy Ppt Powerpoint Image
This is a customer experience management strategy ppt powerpoint image. This is a eight stage process. The stages in this process are customer touch point, segment mg, billing, tariffs and pricing, social media, network, big data analytics, crm.

 Home
Home