Data Engineering
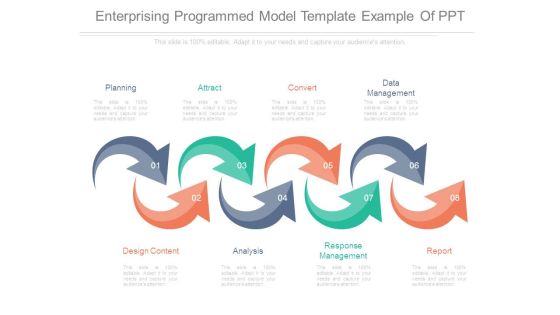
Enterprising Programmed Model Template Example Of Ppt
This is a enterprising programmed model template example of ppt. This is a eight stage process. The stages in this process are `planning, attract, convert, data management, report, response management, analysis, design content.

CRM Transformation Toolkit Analysing CRM Business Functional Requirements Professional PDF
This slide provides information regarding the analysis of key business functional requirements based on degree of compliance associated to CRM. Deliver an awe inspiring pitch with this creative CRM Transformation Toolkit Analysing CRM Business Functional Requirements Professional PDF bundle. Topics like Functional Requirements, Data Modelling Requirements, Data Sources can be discussed with this completely editable template. It is available for immediate download depending on the needs and requirements of the user.

1 Weekly Schedule Of Tape Backup Showing Timeline Of Retention Dates And Times Ppt Slides
This Powerpoint image slide has been designed with graphic of magnetic tapes. These tapes are used to take data backups and to create records. This PPT slide may be used to display weekly schedule of tape backup with timeline representation.

Business Diagram Examples Of Traditional Virtual Architecture With Virtualized Environment Ppt Slide
This PowerPoint template has been designed with graphic of two servers. This slide contains the example of traditional virtual architecture and environment. This diagram slide is suitable to represent data and cloud structure related topics.
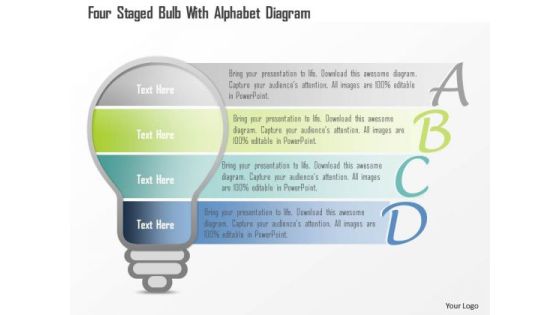
Business Diagram Four Staged Bulb With Alphabet Diagram PowerPoint Template
Four staged bulb with alphabet diagram has been used to design this power point template. This PPT diagram contains the concept of educational data representation. Use this PPT and build an exclusive presentation for education related topics.
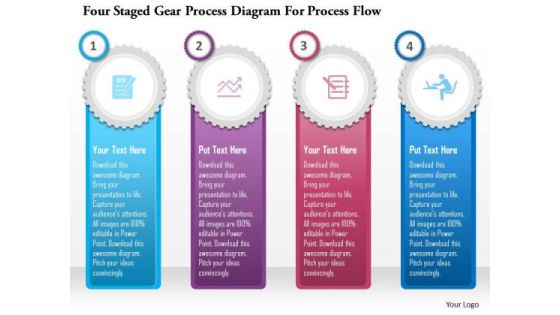
Business Diagram Four Staged Gear Process Diagram For Process Flow Presentation Template
Graphic of four staged gear process diagram has been used to design this power point template diagram. This PPT diagram contains the concept of data and process flow. Use this PPT for marketing and sales related presentations.

Circular Diagram Of Cfl Bulbs Powerpoint Templates
This PowerPoint template has been designed with circular diagram of CFL bulbs. It helps to exhibit business strategies and ideas. Use this diagram to impart more clarity to data and to create more sound impact on viewers.
Business Diagram Three Arrows With Human Icons Presentation Template
This power point template diagram has been designed with graphic of three arrows. This PPT contains the concept of text representation. Use this PPT for business and marketing data related presentations.

Business Diagram Circles With Pencils For Business Structures Presentation Template
This business diagram has been designed with graphic of pencils with text circles. This slide helps to depict business data and process. Use this slide to build quality presentations for your viewers.

Business Diagram Colorful Boxes For Business Options Presentation Template
Graphics of colorful text boxes have been used to design this power point template. This diagram contains the concept of data representation. Illustrate your ideas and imprint them in the minds of your team with this template.

Illustration Of Save Money Concept Powerpoint Templates
This business slide has been designed with infographic square. These text boxes can be used for data representation. Use this diagram for your business presentations. Build a quality presentation for your viewers with this unique diagram.

Five Banners For Management Development Process Powerpoint Template
This PowerPoint template has been designed with graphics of five text banners and icons. This diagram may be sued to display management development process. Download this PPT slide to explain complex data immediately and clearly.

Stock Photo Black Brown Pie Chart For Business Result PowerPoint Slide
This high quality image is designed with pie chart. Use this image to make business reports. Use this outstanding image in presentations relating to data analysis and reports. Go ahead and add charm to your presentations.
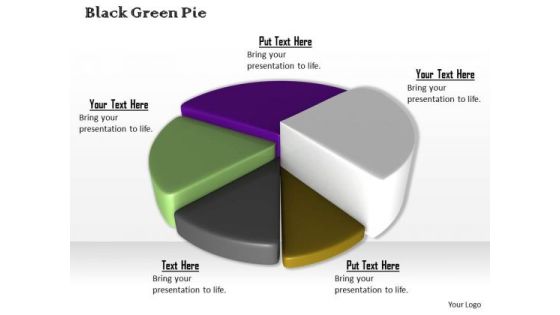
Stock Photo Colorful 3d Pie Chart For Business Result PowerPoint Slide
This high quality image is designed with pie chart. Use this image to make business reports. Use this outstanding image in presentations relating to data analysis and reports. Go ahead and add charm to your presentations.
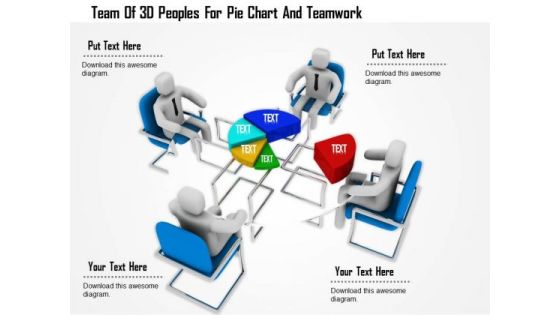
Team Of 3d Peoples For Pie Chart And Teamwork
This Power Point template has been designed with graphic of 3d team forming a pie chart. In this slide team is displaying data analysis. Use this editable slide to build innovative presentation for your viewers.

Team With Bar Graph And Teamwork
This Power Point template has been designed with graphic of 3d team forming a pie chart. In this slide team is displaying data analysis and comparison. Use this editable slide to build innovative presentation for your viewers.

Business Framework 10 Percent To 90 Percent PowerPoint Presentation
This business diagram has been designed with graphic of multiple pie graphs. This diagram slide contains the concept of result analysis with percentage values. Use this diagram to present and compare data in an impressive manner

Business Framework Golden Circle PowerPoint Presentation
This business diagram has been designed with graphic of blue colored circle. This business slide is suitable to display data analysis in any business presentation. Use this slide to build a unique presentations for your viewers

Business Diagram Business People Over Bar Chart PowerPoint Template
This Power Point template has been designed with graphic of business people and bar chart. This PPT contains the concept of result analysis and business data display. Use this PPT slide for your business and marketing related presentations.

Four Tags For Strategy Planning Process Powerpoint Template
Steps for strategy planning can be explained with this diagram. This PowerPoint template contains diagram of four infographic tags. You can also use this design for data analysis in business presentations

Bar Graph For Marketing Research Process Powerpoint Slides
This PowerPoint template has been designed with diagram of bar graph. This PPT slide can be used to prepare presentations for profit growth report and also for financial data analysis. You can download finance PowerPoint template to prepare awesome presentations.

Circle Diagram For Business Marketing Mix Powerpoint Slides
This PowerPoint template has been designed with nine steps circle chart. This PPT slide can be used to prepare presentations for profit growth report and also for financial data analysis. You can download finance PowerPoint template to prepare awesome presentations.
Four Circles Venn Diagram With Icons Powerpoint Slides
Four circles Venn diagram has been used to design this power point template. This PPT helps to portray the concept of business data analysis. Use this PPT for your business and marketing related presentations.
Two Circles Venn Diagram With Icons Powerpoint Slides
Venn diagram of two circles has been used to design this power point template. This PPT helps to portray the concept of business data analysis. Use this PPT for your business and marketing related presentations.

Benefits Of Marketing Automation And Advertising Ppt Powerpoint Presentation
This is a benefits of marketing automation and advertising ppt powerpoint presentation. This is a six stage process. The stages in this process are data integration, map customers journey, engaging content, build targeted lists, execute campaigns, responsive design.

Arrows Infographic For Strategic Management Concept Powerpoint Template
Our above PPT slide contains four curved arrows infographic design. This business diagram helps to depict business information for strategic management. Use this diagram to impart more clarity to data and to create more sound impact on viewers.

Dashboard With Increasing Values Powerpoint Slides
This innovative, stunningly beautiful dashboard has been designed for data visualization. It contains pie charts with increasing percentage values. This PowerPoint template helps to display your information in a useful, simple and uncluttered way.

Dashboard With Low High Medium Indication Powerpoint Slides
This innovative, stunningly beautiful dashboard has been designed for data visualization. It contains dashboard with low, high and medium indication. This PowerPoint template helps to display your information in a useful, simple and orderly way.

Team Pictures With Names And Profile Powerpoint Slides
This PowerPoint template has been designed with team pictures and profile information. This diagram is excellent visual tools to present team profile. Download this PPT slide to explain complex data immediately and clearly.
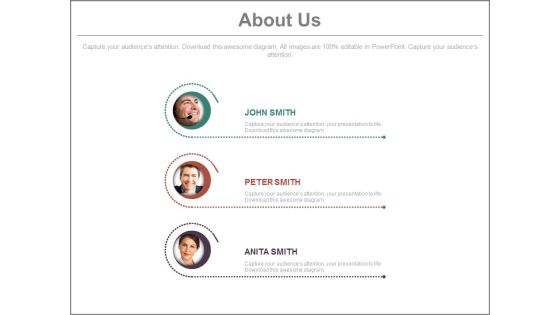
Team Profiles For About Us Slide Powerpoint Slides
This PowerPoint template has been designed with team pictures and profile information. This diagram is excellent visual tools to present team profile. Download this PPT slide to explain complex data immediately and clearly.

Business People Profile For Social Media Powerpoint Slides
This PowerPoint template has been designed with business people profile information. This diagram is excellent visual tools to present team profile with social media. Download this PPT slide to explain complex data immediately and clearly.

Five Staged Vertical Process Diagram Presentation Template
Five staged vertical process diagram has been used to design this power point template. This PPT contains the concept of dependent data representation. Use this PPT and build presentation for business and marketing related topics.
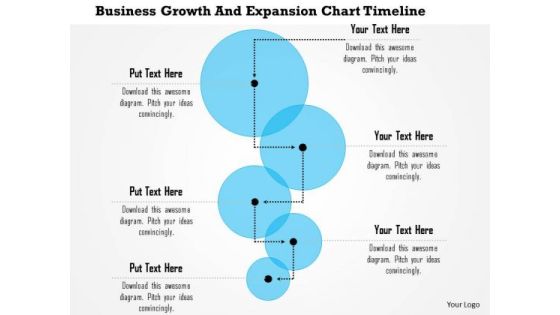
Business Framework Business Growth And Expansion Chart Timeline PowerPoint Presentation
Six staged process flow linear diagram is used to design this Power Point template. This PPT slide contains the concept of data and process flow. This exclusive PPT can be used for linear process flow representation in any presentation.

Business Diagram Seven Staged Concentric Diagram For Global Agenda Presentation Template
This Power Point template slide has been designed with graphic of seven staged concentric diagram. This PPT slide contains the concept of global agenda. Use this PPT slide for business and global data related presentation.
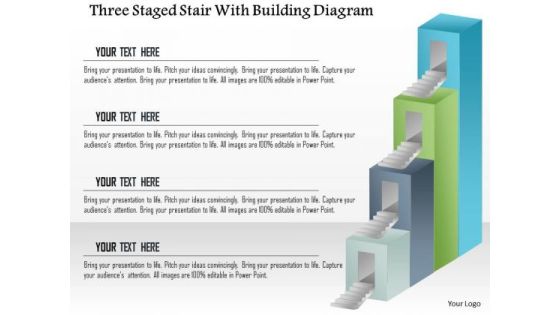
Business Diagram Three Staged Stair With Building Diagram Presentation Template
This Power Point template slide has been designed with graphic of three staged stair diagram. This PPT slide contains the concept of data representation. Use this PPt slide and build innovative presentation for your viewers.
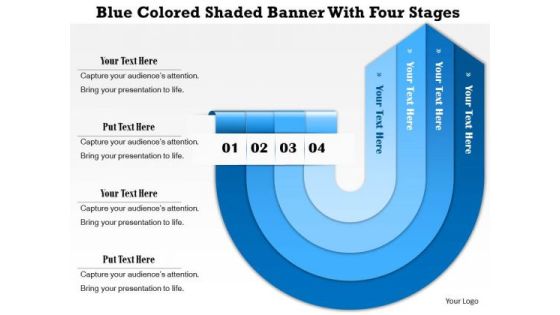
Business Diagram Blue Colored Shaded Banner With Four Stages Presentation Template
Blue colored twisted arrows are used to design this business diagram. These arrows are in banner style with four stages. Use this amazing slide for your data representation in effective manner. Build a unique presentation for your viewers
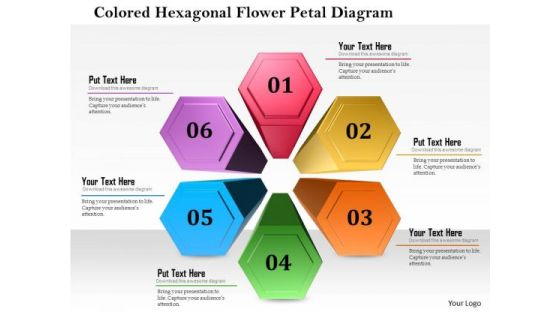
Business Diagram Colored Hexagon Flower Petal Diagram Presentation Template
This business diagram displays colored hexagon flower petal design. This Power Point slide can be used for data representation. Use this PPT slide to show flow of activities in circular manner. Get professional with this exclusive business slide.
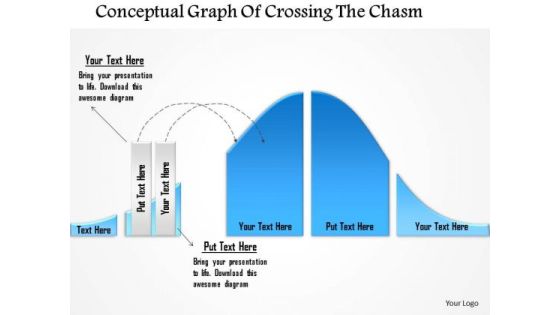
Business Diagram Conceptual Graph Of Crossing The Chasm Presentation Template
This business diagram has been designed with graphic of 3d graph. This slide contains the concept of chasm and data calculation. Use this slide to display chasm crossing condition. This business diagram adds value to your ideas.
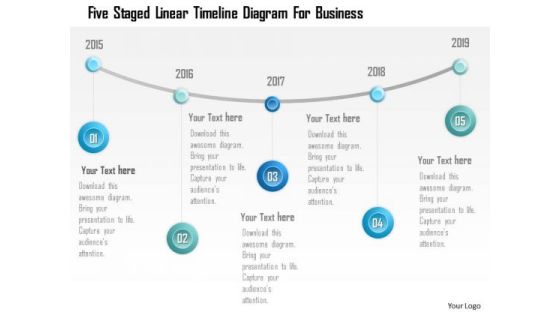
Business Diagram Five Staged Linear Timeline Diagram For Business PowerPoint Template
Five staged linear timeline diagram has been used to design this power point template. This diagram template contains the concept of business data and success strategy representation. Use this PPT for your business and sales related presentations.

Business Diagram Four Staged Stair Diagram With Foot Print PowerPoint Template
Four staged stair diagram with foot print has been used to design this power point template. This diagram template contains the concept of success and data flow. Use this PPT for your business and sales related presentations.
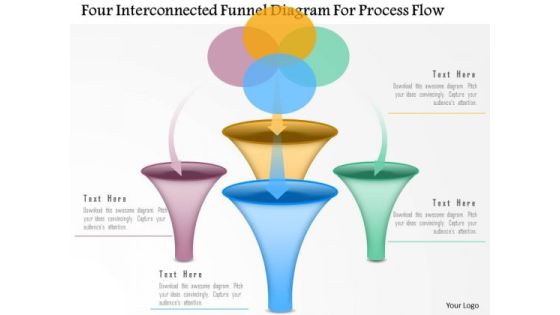
Business Diagram Four Interconnected Funnel Diagram For Process Flow Presentation Template
Graphic of four interconnected funnel diagram has been used to design this power point template diagram. This PPT diagram contains the concept of data and process flow. Use this PPT for marketing and business related presentations.

Business Diagram Three Interconnected Funnel Diagram Presentation Template
Graphic of three interconnected funnel diagram has been used to design this power point template diagram. This PPT diagram contains the concept of data and process flow. Use this PPT for marketing and business related presentations.
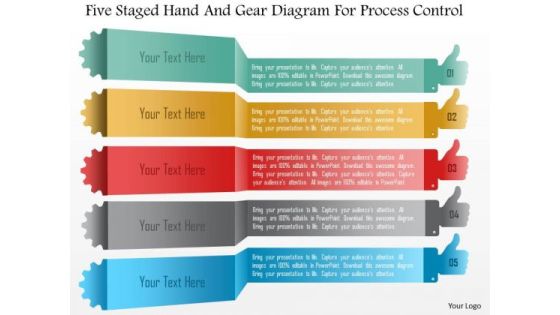
Business Diagram Five Staged Hand And Gear Diagram For Process Control PowerPoint Template
Five staged hand and gear diagram has been used to design this power point template. This PPT contains the concept of data representation and process control. Use this PPT slide for your marketing and business process related presentations.

Business Diagram Three Circular Financial Pie Chart PowerPoint Template
This power point template has been designed with graphic of three circular pie chart. This pie chart is suitable for financial data representation. Use this PPt for your business and finance related presentations.
Cloud Icons With Paper Clips PowerPoint Template
Visually support your presentation with our above template showing cloud icons with paper clips. This slide has been professionally designed to portray concepts like cloud computing and data storage. This template offers an excellent background to build impressive presentation.

Colorful Circle Arrow Diagram Powerpoint Template
Our above PPT slide contains circular arrow design. This business diagram helps to exhibit process flow. Use this diagram to impart more clarity to data and to create more sound impact on viewers.

Colorful Circular Arrows Diagram Powerpoint Template
Our above PPT slide contains circular arrow design. This business diagram helps to exhibit process flow. Use this diagram to impart more clarity to data and to create more sound impact on viewers.
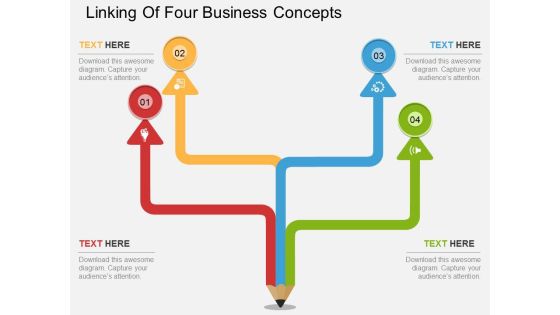
Linking Of Four Business Concepts Powerpoint Template
This PowerPoint template has been designed with four steps pencil diagram. This diagram is excellent visual tools to present link of steps. Download this PPT slide to explain complex data immediately and clearly.
Navigation Point Four Banners And Icons Powerpoint Template
This PowerPoint template has been designed with four banners icons. This diagram is excellent visual tools for business presentations. Download this PPT slide to explain complex data immediately and clearly.

Diagram Of Colorful Circular Arrows Powerpoint Template
Our above PPT slide contains circular arrow design. This business diagram helps to exhibit process flow. Use this diagram to impart more clarity to data and to create more sound impact on viewers.
Four Sequential Boxes And Icons Diagram Powerpoint Template
This PowerPoint template has been designed with four sequential boxes and icons. This diagram is excellent visual tools for business presentations. Download this PPT slide to explain complex data immediately and clearly.
Four Staged Numeric Banners With Icons Powerpoint Template
This PowerPoint template has been designed with four staged numeric banners icons. This diagram is excellent visual tools for business presentations. Download this PPT slide to explain complex data immediately and clearly.
Linear Arrow Process Diagram With Icons Powerpoint Template
This business slide has been designed with infographic of linear arrow. This arrow infographic can be used for data representation. Use this diagram for your business presentations. Build a quality presentation for your viewers with this unique diagram.

Three Arrow For Team Members Profile Powerpoint Slides
This PowerPoint template has been designed with three arrows and team pictures. This diagram is excellent visual tools for business presentations. Download this PPT slide to explain complex data immediately and clearly.
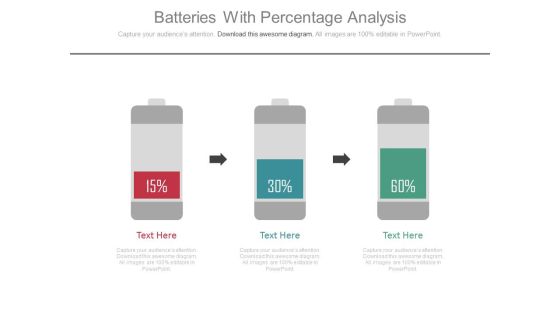
Three Batteries As Growth Steps Powerpoint Slides
This PowerPoint template has been designed with graphics of three batteries. Download this PPT slide for data comparisons or it may be used to display growth steps. Add this slide to your presentation and impress your superiors.

Business Team About Us Page Powerpoint Slides
This PowerPoint template has been designed with team pictures and business icons. This diagram is excellent visual tools to present teams strategic planning. Download this PPT slide to explain complex data immediately and clearly.
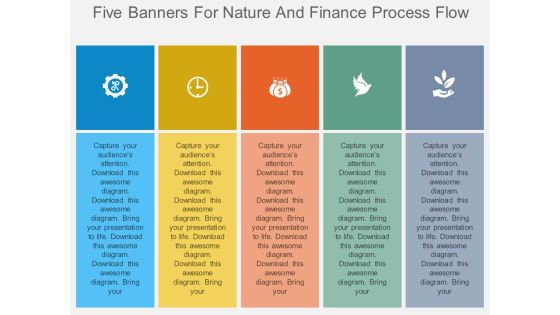
Five Banners For Nature And Finance Process Flow Powerpoint Template
This PowerPoint template has been designed with five banners nature, finance icons. This diagram is excellent visual tools for business presentations. Download this PPT slide to explain complex data immediately and clearly.
Four Arrows For Different Process Representation Powerpoint Template
This PowerPoint template has been designed with graphics of four arrows This diagram is excellent visual tools for business presentations. Download this PPT slide to explain complex data immediately and clearly.

Future Of Ecommerce Diagram Ppt Example File
This is a future of ecommerce diagram ppt example file. This is a six stage process. The stages in this process are responsive design, rich functionalities, social media, omni channel, mobile, data segmentation.

E Commerce Circle Examples Ppt Powerpoint Slides
This is a e commerce circle examples ppt powerpoint slides. This is a seven stage process. The stages in this process are business e commerce, security services, web hosting, shopping cart, web design, merchant processing, online marketing, data storage.
 Home
Home