Data Engineering
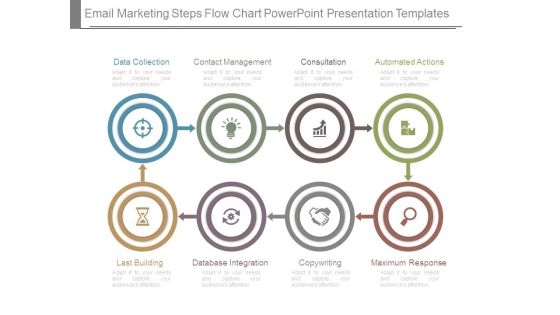
Email Marketing Steps Flow Chart Powerpoint Presentation Templates
This is a email marketing steps flow chart powerpoint presentation templates. This is a eight stage process. The stages in this process are data collection, contact management, consultation, automated actions, last building, database integration, copywriting, maximum response.
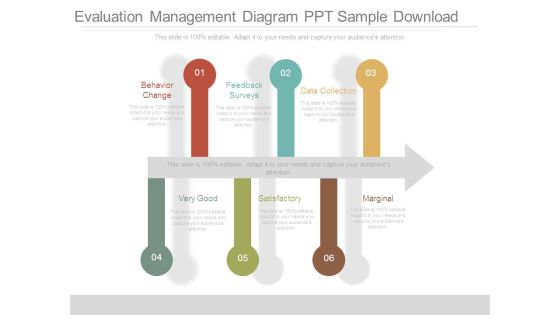
Evaluation Management Diagram Ppt Sample Download
This is a evaluation management diagram ppt sample download. This is a six stage process. The stages in this process are behavior change, feedback surveys, data collection, very good, satisfactory, marginal.
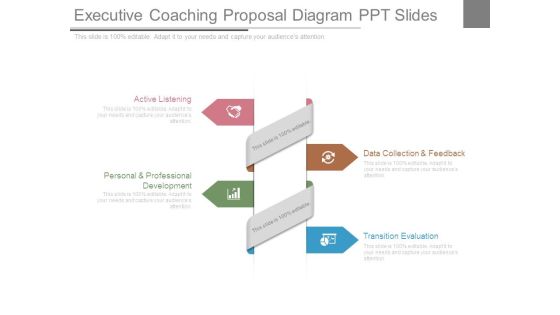
Executive Coaching Proposal Diagram Ppt Slides
This is a executive coaching proposal diagram ppt slides. This is a four stage process. The stages in this process are active listening, personal and professional development, data collection and feedback, transition evaluation.

Movement Strategy Ppt Layout Ppt Examples Slides
This is a movement strategy ppt layout ppt examples slides. This is a five stage process. The stages in this process are action plans, data collection, activity prep, improvements, project planning.

Sample For Strategic Plan Review Ppt Slides
This is a sample for strategic plan review ppt slides. This is a five stage process. The stages in this process are predictions, experiments, data collection, pattern recognition, effective execution.
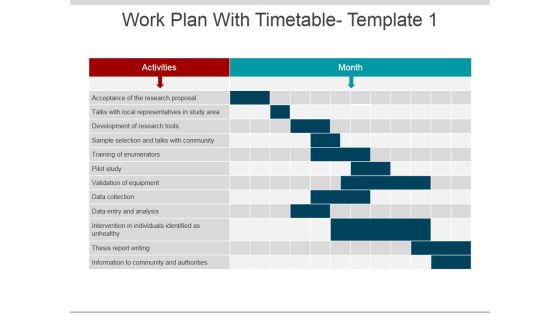
Work Plan With Timetable Template 1 Ppt PowerPoint Presentation Layouts Example File
This is a work plan with timetable template 1 ppt powerpoint presentation layouts example file. This is a two stage process. The stages in this process are activities, month, thesis report writing, data collection, pilot study.

Quality Control Check Sheet Ppt PowerPoint Presentation Gallery Microsoft
This is a quality control check sheet ppt powerpoint presentation gallery microsoft. This is a nine stage process. The stages in this process are dates, defect type event occurrence, location, data collection date.
Quality Control Check Sheet Template 2 Ppt PowerPoint Presentation Inspiration Icon
This is a quality control check sheet template 2 ppt powerpoint presentation inspiration icon. This is a seven stage process. The stages in this process are description, dates, data collection, location, total.

Datafy Phases Of Datafication As A Use Perspective Ideas PDF
This slide represents the phases of datafication from a use perspective and the stages include domain, data generation, analyzing data and generating output, and data-driven interventions. Each phase includes four steps, such as step counter, webshop, Schiphol-asito, and predictive policing. The Datafy Phases Of Datafication As A Use Perspective Ideas PDF is a compilation of the most recent design trends as a series of slides. It is suitable for any subject or industry presentation, containing attractive visuals and photo spots for businesses to clearly express their messages. This template contains a variety of slides for the user to input data, such as structures to contrast two elements, bullet points, and slides for written information. Slidegeeks is prepared to create an impression.

Concept Of Ontology In The Semantic Web Timeline For Semantic Web Deployment Topics PDF
This slide represents the timeline for semantic web deployment and development, including the steps to be performed at each months interval. The steps include discovering data, integrating data with meaningful labels, validating, and exploring methods for data transformation. The Concept Of Ontology In The Semantic Web Timeline For Semantic Web Deployment Topics PDF is a compilation of the most recent design trends as a series of slides. It is suitable for any subject or industry presentation, containing attractive visuals and photo spots for businesses to clearly express their messages. This template contains a variety of slides for the user to input data, such as structures to contrast two elements, bullet points, and slides for written information. Slidegeeks is prepared to create an impression.

Tools For HR Business Analytics Four Stages Of Business Intelligence Process Rules PDF
This slide represents the procedure to help corporate executives and business managers to make better and informed business decisions. It includes four stages of business intelligence process such as identifying various data sources, data collection, data staging and cleansing and data visualizing. Formulating a presentation can take up a lot of effort and time, so the content and message should always be the primary focus. The visuals of the PowerPoint can enhance the presenters message, so our Tools For HR Business Analytics Four Stages Of Business Intelligence Process Rules PDF was created to help save time. Instead of worrying about the design, the presenter can concentrate on the message while our designers work on creating the ideal templates for whatever situation is needed. Slidegeeks has experts for everything from amazing designs to valuable content, we have put everything into Tools For HR Business Analytics Four Stages Of Business Intelligence Process Rules PDF.

Business Diagram Four Thermometer For Entrepreneurship Statistics Presentation Template
Graphic of thermometers have been used to design this business diagram. Thermometers can be used to display entrepreneurship statistics. Use this diagram your data and information related topics in any presentation.

PowerPoint Designs Process Chart Strategy Ppt Slide
PowerPoint Designs process Chart Strategy PPT Slide-This Process Chart can be used as data flow diagram to show the flow of the data as it moves from beginning process to end result.-3d, arrow, art, business, chart, circle, concept, connection, cycle, development, diagram, direction, element, environment, finance, financial, flow, graphic, group, investment, isolated, market,, movement, organization, passive income, perspective, presentation, process chart, recycle, report, sign, step, success, symbol, teamwork-PowerPoint Designs process Chart Strategy PPT Slide

Human Resource Analytics Key Business Intelligence Trends For 2022 Elements PDF
This slide represents the current trends of the process through which enterprises uses technologies to analyze current and historical data for improving decision making and having competitive advantage. It includes BI trends for 2022 such as AI, data security, data visualization, data quality management etc. Welcome to our selection of the Human Resource Analytics Key Business Intelligence Trends For 2022 Elements PDF. These are designed to help you showcase your creativity and bring your sphere to life. Planning and Innovation are essential for any business that is just starting out. This collection contains the designs that you need for your everyday presentations. All of our PowerPoints are 100 percent editable, so you can customize them to suit your needs. This multi-purpose template can be used in various situations. Grab these presentation templates today.

Business Analytics Application Four Stages Of Business Intelligence Process Microsoft PDF
This slide represents the procedure to help corporate executives and business managers to make better and informed business decisions. It includes four stages of business intelligence process such as identifying various data sources, data collection, data staging and cleansing and data visualizing. Coming up with a presentation necessitates that the majority of the effort goes into the content and the message you intend to convey. The visuals of a PowerPoint presentation can only be effective if it supplements and supports the story that is being told. Keeping this in mind our experts created Business Analytics Application Four Stages Of Business Intelligence Process Microsoft PDF to reduce the time that goes into designing the presentation. This way, you can concentrate on the message while our designers take care of providing you with the right template for the situation.

BI Implementation To Enhance Hiring Process Four Stages Of Business Intelligence Process Brochure PDF
This slide represents the procedure to help corporate executives and business managers to make better and informed business decisions. It includes four stages of business intelligence process such as identifying various data sources, data collection, data staging and cleansing and data visualizing.Coming up with a presentation necessitates that the majority of the effort goes into the content and the message you intend to convey. The visuals of a PowerPoint presentation can only be effective if it supplements and supports the story that is being told. Keeping this in mind our experts created BI Implementation To Enhance Hiring Process Four Stages Of Business Intelligence Process Brochure PDF to reduce the time that goes into designing the presentation. This way, you can concentrate on the message while our designers take care of providing you with the right template for the situation.
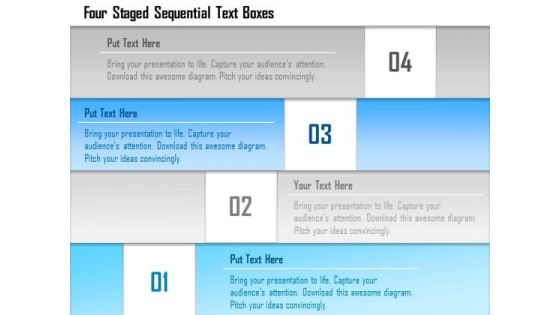
Business Diagram Four Staged Sequential Text Boxes Presentation Template
Four staged sequential stair designed text boxes are used to design this power point template. This PPT contains the concept of data flow. Use this PPT for your business and finance related presentations.

Business Diagram Three Paper Clips For Text Representation Presentation Template
Three paper clips are used to design this power point template slide. This PPT slide has been crafted for data representation techniques. Use this PPT slide for your business and marketing related presentations.

Business Diagram Four Colored Tablets With Text Boxes Presentation Template
Graphic of four colored tablets has been used to design this power point template diagram. This PPT diagram contains the concept of data and text representation. Use this PPT for marketing and business related presentations.

Business Diagram Four Balloons With Text Boxes PowerPoint Template
Graphic of four balloons style text box diagram has been used to design this power point template slide. This PPT slide contains the concept of business data flow. Use this PPT for your business and marketing related presentations.

Four Horizontal Text Banners Powerpoint Template
This PowerPoint template has been designed with four horizontal text banners. This diagram is excellent visual tools for business presentations. Download this PPT slide to explain complex data immediately and clearly.

Executive Information Database System Extract Transform Load Etl Introduction PDF
This slide represents the extract transform and load tools of the data warehouse and how they perform their jobs on the stored information in the data warehouse.Deliver an awe inspiring pitch with this creative Executive Information Database System Extract Transform Load Etl Introduction PDF bundle. Topics like Extract Transform, Cobol Programs, Warehouse Regularly can be discussed with this completely editable template. It is available for immediate download depending on the needs and requirements of the user.
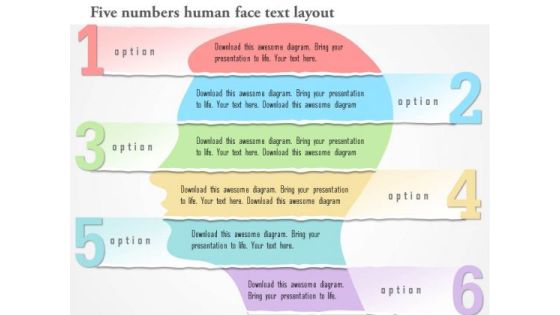
Business Diagram Six Numbers Human Face Text Layout Presentation Template
Graphic of six numeric tags and human face has been used to design this business diagram. Download our above diagram to express information in a visual way. Use this diagram and get good comments for data related presentations.

Business Diagram Four Staged Semicircular Text Box Diagram PowerPoint Template
Four staged semicircular text boxes diagram has been used to design this power point template. This diagram template contains the concept of data and process flow. Use this PPT for your business and marketing related presentations.

Business Diagram Three Colored Text Boxes Representation PowerPoint Template
Three colored text boxes diagram has been used to design this power point template. This PPT contains the concept of process based data representation. This PPT is suitable for business and sales related presentations.
Four Sequential Text Banners With Icons Powerpoint Template
This PowerPoint template has been designed with four sequential text banners and icons. This diagram is excellent visual tools for business presentations. Download this PPT slide to explain complex data immediately and clearly.
Four Colored Text Boxes With Icons Powerpoint Slides
This PowerPoint template has been designed with graphics of four text boxes. Download this PPT slide to display percentage data display. Use this professional template to build an exclusive presentation.

Business Diagram Six Staged Ribbon Style Text Boxes Presentation Template
Graphic of four staged diagram has been used to design this power point template slide. This PPT slide contains the data flow. This PPT slide can be used for business and marketing related presentations.

Business Diagram Three Darts For Text Representation Presentation Template
Graphic of three darts has been used to design this power point template. This PPT contains the concept of data representation. Use this PPT and build an exclusive presentation for your viewers.

Flower Diagram For Educational Training Powerpoint Template
Colorful flowers have been used to design this PowerPoint diagram. This colorful PPT slide may be used for educational training. You can use this design for data analysis in business presentations

Traditional Assessment Template Ppt Examples
This is a traditional assessment template ppt examples. This is a six stage process. The stages in this process are analysis, requirement specification, design, testing and integration, operation and maintenance, data design.
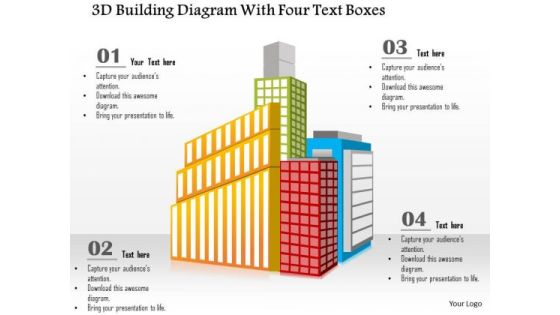
Busines Diagram 3d Building Diagram With Four Text Boxes Presentation Template
This business diagram has been designed with graphic of 3d building diagram and four text boxes. This business slide is useful for data representation. Use this diagram to make professional presentations.

Business Diagram Four Staged Road Sign Diagram For Text Representation Presentation Template
Four staged road sign diagram has been used to design this power point template. This PPT contains the concept of text and data representation. Use this PPT and build quality presentation for your viewers.

Four Steps Circular Infographic Powerpoint Slides
This innovative, stunningly beautiful dashboard has been designed for data visualization. It contains circular infographic design. This PowerPoint template helps to display your information in a useful, simple and orderly way.

Pyramid For Financial Accounting Information Powerpoint Slides
This PowerPoint template has been designed with graphics of pyramid chart. This PPT slide can be used to prepare presentations for profit growth report and also for financial data analysis. You can download finance PowerPoint template to prepare awesome presentations.
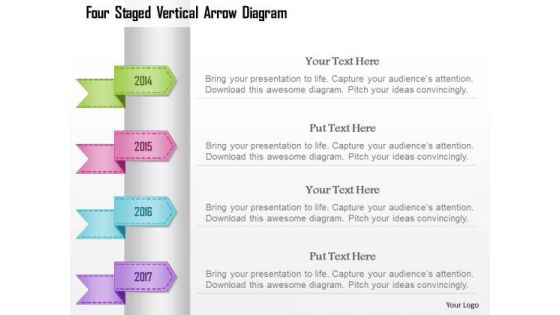
Busines Diagram Four Staged Vertical Arrow Diagram Presentation Template
Four staged vertical arrow diagram has been used to design this business diagram. This business diagram contains the concept of data representation. This pre designed high quality image slide will make your presentations simply the best.
Business Diagram Navigation Icon Around Circle Presentation Template
Five staged business info graphics been used to design this power point template. This diagram contains the concept of data representation. Use this diagram for business and finance related presentations
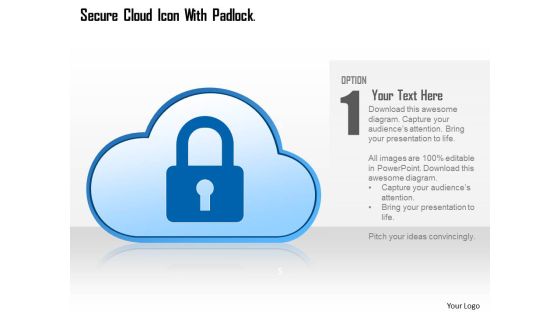
Cloud With Lock For Cloud Technology Powerpoint Template
This PowerPoint template contains graphics of cloud with lock. This PPT slide helps to portray concepts of cloud computing and data protection. Use this technology template design to illustrate your ability.
Five Banners With Communication And Technology Icons Powerpoint Template
This PowerPoint template has been designed with five banners and communication technology icons. This diagram is excellent visual tools for business presentations. Download this PPT slide to explain complex data immediately and clearly.
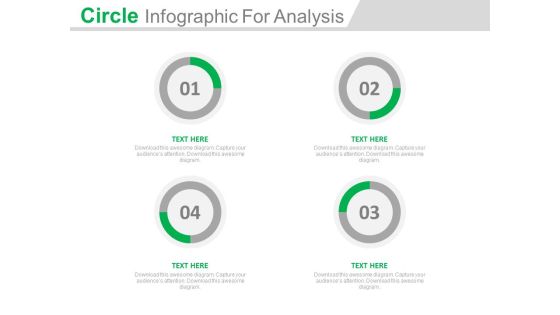
Four Circle Steps For Process Analysis Powerpoint Slides
This innovative, stunningly beautiful dashboard has been designed for data visualization. It contains four circles steps for process analysis. This PowerPoint template helps to display your information in a useful, simple and orderly way.
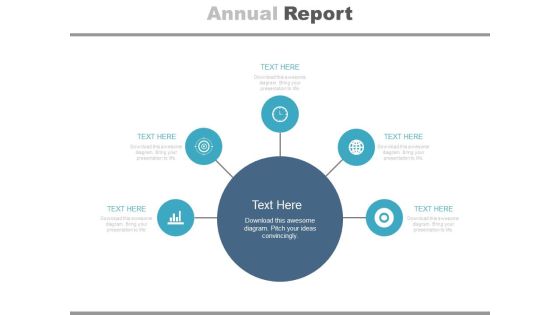
Diagram For Market Research Analysis Powerpoint Slides
This PowerPoint template has been designed with circular infographic diagram. It can be used to display steps for market research and also for financial data analysis. You can download finance PowerPoint template to prepare awesome presentations.
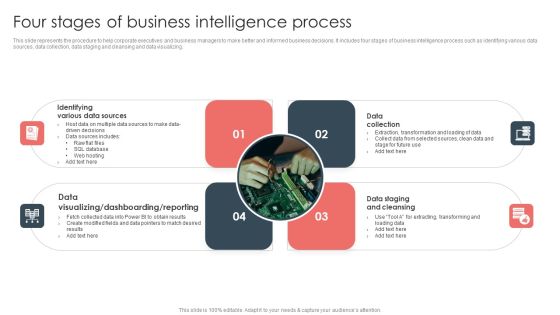
Overview Of BI For Enhanced Decision Making Four Stages Of Business Intelligence Process Template PDF
This slide represents the procedure to help corporate executives and business managers to make better and informed business decisions. It includes four stages of business intelligence process such as identifying various data sources, data collection, data staging and cleansing and data visualizing. Present like a pro with Overview Of BI For Enhanced Decision Making Four Stages Of Business Intelligence Process Template PDF Create beautiful presentations together with your team, using our easy to use presentation slides. Share your ideas in real time and make changes on the fly by downloading our templates. So whether you are in the office, on the go, or in a remote location, you can stay in sync with your team and present your ideas with confidence. With Slidegeeks presentation got a whole lot easier. Grab these presentations today.

Constituting Components Of Strategic Frameworks For Digital Transformation Diagrams PDF
This slide includes five constituting elements of digital transformation framework. These components are customer engagement, data and analytics, social communities, CRM and emerging technologies. Presenting Constituting Components Of Strategic Frameworks For Digital Transformation Diagrams PDF to dispense important information. This template comprises five stages. It also presents valuable insights into the topics including Social Communities, Data Analytics, Customer Engagement. This is a completely customizable PowerPoint theme that can be put to use immediately. So, download it and address the topic impactfully.

Pie Charts For Financial Ratio Analysis Powerpoint Slides
This PowerPoint template has been designed with diagram of pie charts. This PPT slide can be used to prepare presentations for profit growth report and also for financial data analysis. You can download finance PowerPoint template to prepare awesome presentations.

Battery Icons For Business Growth Levels Powerpoint Template
Levels of business growth can be displayed with this diagram. This PowerPoint template contains graphics of seven battery icons. You can use this design for data analysis in business presentations
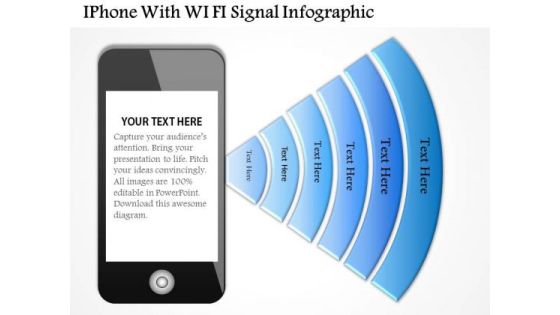
Business Diagram Iphone With Wi Fi Signal Infographic Presentation Template
This business diagram has been designed with graphic of iphone and wi-fi symbol. This diagram template contains the concept of data communication and technology. Use this diagram template for your business and technology related presentations.

Stock Photo Blue Cloud With Code Lock PowerPoint Slide
Graphic of blue cloud and code lock has been used to design this PPT. This PPT contains the concept data safety on cloud technology. Use this image template for your cloud technology related presentation.

Cloud Computing Wifi Safety Upload Social Network Ppt Slides Graphics
This power point icon template has been designed with graphic of cloud computing, wifi and social network. These icons can be used for data upload safety features and social networking. Use these icons for social network and technology related presentations.

Business Diagram Three Different Pie Charts For Result Analysis Presentation Template
Three different pie charts are used to designed this power point template slide. This PPT slide contains the concept of result analysis. Use this PPT slide for your data and process related presentations.
Business Diagram Loudspeaker With Icons Dialogue Box Presentation Template
Graphic of loudspeaker and icons of dialogue box has been used to design this business diagram. This diagram contains the concept of business information communication. Use this diagram for data communication related presentation.
Business Diagram Loudspeaker With Web Icons Dialogue Box Presentation Template
Graphics of loudspeaker and icons of web with dialogue box have been used to design this business diagram. This diagram contains the concept of business information communication. Use this diagram for data communication related presentation.

Stock Photo 3d Laptops Graphic Connected With Server PowerPoint Slide
Graphic of 3d laptop and servers has been used to design this power point template. This image template contains the concept of data transfer with networking. This image template can be used to show the networking related presentations.
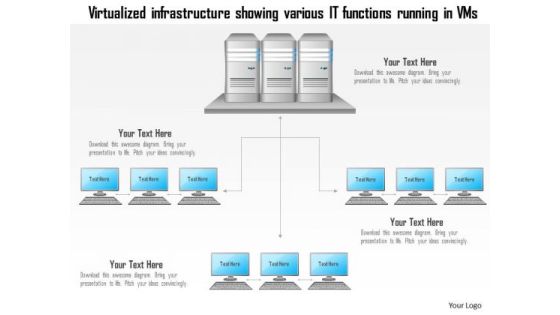
Business Diagram Virtualized Infrastructure Showing Various It Functions Running In Vms Ppt Slide
Graphic of data base server and VMS has been used to design this technology diagram. This slide contains the virtualized infrastructure for various functions. Use this diagram for technology related presentations.

Business Diagram Geographically Distributed Public Cloud Connected To Cities Around World Map Ppt Sl
This technology diagram has been designed with graphic of world map and cloud. In this diagram, cloud is connected to the multiple cities around the world. Use this diagram slide for your data distribution related topics in any presentation.
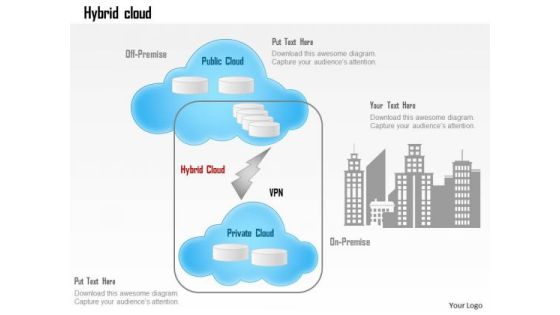
Business Diagram Hybrid Cloud Off Premise Public Cloud Office Connectivity Ppt Slide
This technology diagram slide has been designed with graphic of hybrids cloud. This diagram displays the connectivity of cloud in private and public premise. Use this graphics for your data transfer related presentations.
Stock Photo Graphics Of Laptop With Cloud Icon Pwerpoint Slide
This image has been designed with graphic of laptop and cloud icon. This image shows the concept of cloud computing and data communication. Build a presentation for cloud computing and networking related presentations.
Stock Photo Laptop With Blue Cloud Icon Pwerpoint Slide
This image has been designed with graphic of laptop and blue colored cloud icon. This image shows the concept of cloud computing and data communication. Build a presentation for cloud computing and networking related presentations.
Stock Photo Red Upload Arrow On Blue Cloud Icon PowerPoint Slide
This technical image slide has been designed with graphic of red upload arrow on cloud. This image slide explains the concept of data upload techniques with in the cloud service. Use this image slide for cloud computing related presentations.
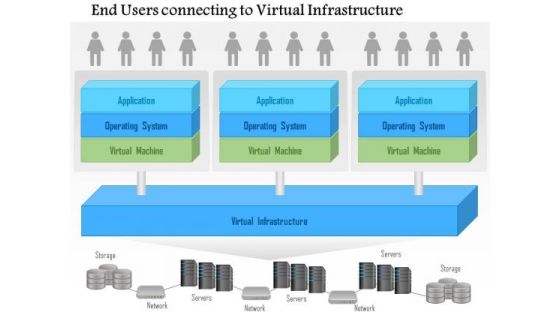
Business Diagram End Users Connecting To A Virtual Infrastructure Ppt Slide
This PowerPoint template has been designed with graphic of computer network. This slide depicts concept of end user connectivity and virtual infrastructure. This diagram is suitable to represent data and cloud structure related topics.
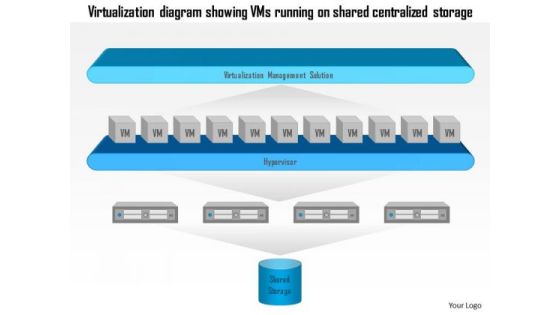
Business Diagram Virtualization Diagram Showing Vms Running On Shared Centralized Storage Ppt Slide
This diagram has been designed with graphic of virtualization diagram. This diagram is representing the VMS running on shared and centralized storage. This diagram may be used for data storage related presentations.
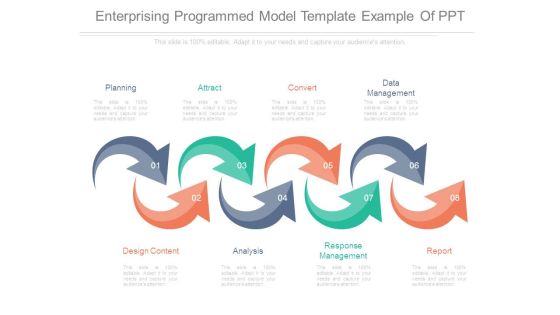
Enterprising Programmed Model Template Example Of Ppt
This is a enterprising programmed model template example of ppt. This is a eight stage process. The stages in this process are `planning, attract, convert, data management, report, response management, analysis, design content.

CRM Transformation Toolkit Analysing CRM Business Functional Requirements Professional PDF
This slide provides information regarding the analysis of key business functional requirements based on degree of compliance associated to CRM. Deliver an awe inspiring pitch with this creative CRM Transformation Toolkit Analysing CRM Business Functional Requirements Professional PDF bundle. Topics like Functional Requirements, Data Modelling Requirements, Data Sources can be discussed with this completely editable template. It is available for immediate download depending on the needs and requirements of the user.

1 Weekly Schedule Of Tape Backup Showing Timeline Of Retention Dates And Times Ppt Slides
This Powerpoint image slide has been designed with graphic of magnetic tapes. These tapes are used to take data backups and to create records. This PPT slide may be used to display weekly schedule of tape backup with timeline representation.

Business Diagram Examples Of Traditional Virtual Architecture With Virtualized Environment Ppt Slide
This PowerPoint template has been designed with graphic of two servers. This slide contains the example of traditional virtual architecture and environment. This diagram slide is suitable to represent data and cloud structure related topics.
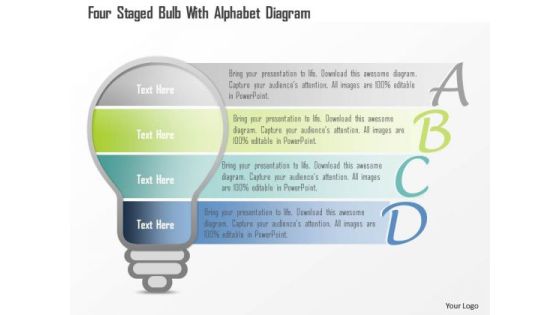
Business Diagram Four Staged Bulb With Alphabet Diagram PowerPoint Template
Four staged bulb with alphabet diagram has been used to design this power point template. This PPT diagram contains the concept of educational data representation. Use this PPT and build an exclusive presentation for education related topics.
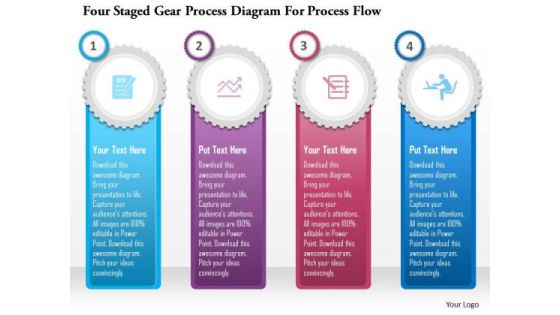
Business Diagram Four Staged Gear Process Diagram For Process Flow Presentation Template
Graphic of four staged gear process diagram has been used to design this power point template diagram. This PPT diagram contains the concept of data and process flow. Use this PPT for marketing and sales related presentations.

Circular Diagram Of Cfl Bulbs Powerpoint Templates
This PowerPoint template has been designed with circular diagram of CFL bulbs. It helps to exhibit business strategies and ideas. Use this diagram to impart more clarity to data and to create more sound impact on viewers.
Business Diagram Three Arrows With Human Icons Presentation Template
This power point template diagram has been designed with graphic of three arrows. This PPT contains the concept of text representation. Use this PPT for business and marketing data related presentations.

Business Diagram Circles With Pencils For Business Structures Presentation Template
This business diagram has been designed with graphic of pencils with text circles. This slide helps to depict business data and process. Use this slide to build quality presentations for your viewers.

Business Diagram Colorful Boxes For Business Options Presentation Template
Graphics of colorful text boxes have been used to design this power point template. This diagram contains the concept of data representation. Illustrate your ideas and imprint them in the minds of your team with this template.

Illustration Of Save Money Concept Powerpoint Templates
This business slide has been designed with infographic square. These text boxes can be used for data representation. Use this diagram for your business presentations. Build a quality presentation for your viewers with this unique diagram.

Five Banners For Management Development Process Powerpoint Template
This PowerPoint template has been designed with graphics of five text banners and icons. This diagram may be sued to display management development process. Download this PPT slide to explain complex data immediately and clearly.

Stock Photo Black Brown Pie Chart For Business Result PowerPoint Slide
This high quality image is designed with pie chart. Use this image to make business reports. Use this outstanding image in presentations relating to data analysis and reports. Go ahead and add charm to your presentations.
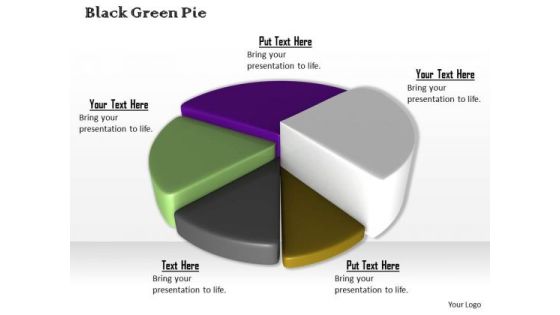
Stock Photo Colorful 3d Pie Chart For Business Result PowerPoint Slide
This high quality image is designed with pie chart. Use this image to make business reports. Use this outstanding image in presentations relating to data analysis and reports. Go ahead and add charm to your presentations.
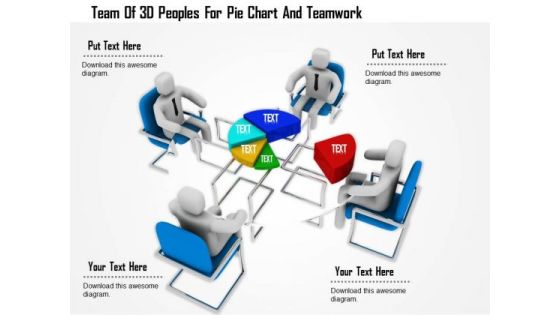
Team Of 3d Peoples For Pie Chart And Teamwork
This Power Point template has been designed with graphic of 3d team forming a pie chart. In this slide team is displaying data analysis. Use this editable slide to build innovative presentation for your viewers.

Team With Bar Graph And Teamwork
This Power Point template has been designed with graphic of 3d team forming a pie chart. In this slide team is displaying data analysis and comparison. Use this editable slide to build innovative presentation for your viewers.

Business Framework 10 Percent To 90 Percent PowerPoint Presentation
This business diagram has been designed with graphic of multiple pie graphs. This diagram slide contains the concept of result analysis with percentage values. Use this diagram to present and compare data in an impressive manner

Business Framework Golden Circle PowerPoint Presentation
This business diagram has been designed with graphic of blue colored circle. This business slide is suitable to display data analysis in any business presentation. Use this slide to build a unique presentations for your viewers

Business Diagram Business People Over Bar Chart PowerPoint Template
This Power Point template has been designed with graphic of business people and bar chart. This PPT contains the concept of result analysis and business data display. Use this PPT slide for your business and marketing related presentations.

Four Tags For Strategy Planning Process Powerpoint Template
Steps for strategy planning can be explained with this diagram. This PowerPoint template contains diagram of four infographic tags. You can also use this design for data analysis in business presentations

Bar Graph For Marketing Research Process Powerpoint Slides
This PowerPoint template has been designed with diagram of bar graph. This PPT slide can be used to prepare presentations for profit growth report and also for financial data analysis. You can download finance PowerPoint template to prepare awesome presentations.

Circle Diagram For Business Marketing Mix Powerpoint Slides
This PowerPoint template has been designed with nine steps circle chart. This PPT slide can be used to prepare presentations for profit growth report and also for financial data analysis. You can download finance PowerPoint template to prepare awesome presentations.
Four Circles Venn Diagram With Icons Powerpoint Slides
Four circles Venn diagram has been used to design this power point template. This PPT helps to portray the concept of business data analysis. Use this PPT for your business and marketing related presentations.
Two Circles Venn Diagram With Icons Powerpoint Slides
Venn diagram of two circles has been used to design this power point template. This PPT helps to portray the concept of business data analysis. Use this PPT for your business and marketing related presentations.

Benefits Of Marketing Automation And Advertising Ppt Powerpoint Presentation
This is a benefits of marketing automation and advertising ppt powerpoint presentation. This is a six stage process. The stages in this process are data integration, map customers journey, engaging content, build targeted lists, execute campaigns, responsive design.

Arrows Infographic For Strategic Management Concept Powerpoint Template
Our above PPT slide contains four curved arrows infographic design. This business diagram helps to depict business information for strategic management. Use this diagram to impart more clarity to data and to create more sound impact on viewers.

Dashboard With Increasing Values Powerpoint Slides
This innovative, stunningly beautiful dashboard has been designed for data visualization. It contains pie charts with increasing percentage values. This PowerPoint template helps to display your information in a useful, simple and uncluttered way.

Dashboard With Low High Medium Indication Powerpoint Slides
This innovative, stunningly beautiful dashboard has been designed for data visualization. It contains dashboard with low, high and medium indication. This PowerPoint template helps to display your information in a useful, simple and orderly way.

Team Pictures With Names And Profile Powerpoint Slides
This PowerPoint template has been designed with team pictures and profile information. This diagram is excellent visual tools to present team profile. Download this PPT slide to explain complex data immediately and clearly.
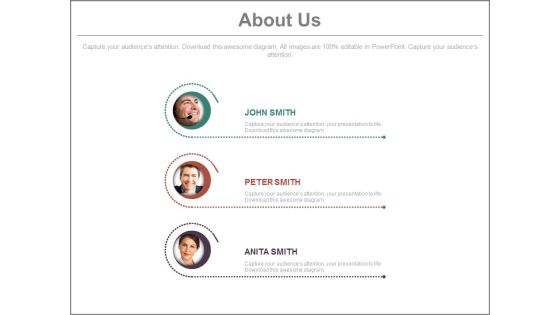
Team Profiles For About Us Slide Powerpoint Slides
This PowerPoint template has been designed with team pictures and profile information. This diagram is excellent visual tools to present team profile. Download this PPT slide to explain complex data immediately and clearly.

Business People Profile For Social Media Powerpoint Slides
This PowerPoint template has been designed with business people profile information. This diagram is excellent visual tools to present team profile with social media. Download this PPT slide to explain complex data immediately and clearly.

Five Staged Vertical Process Diagram Presentation Template
Five staged vertical process diagram has been used to design this power point template. This PPT contains the concept of dependent data representation. Use this PPT and build presentation for business and marketing related topics.
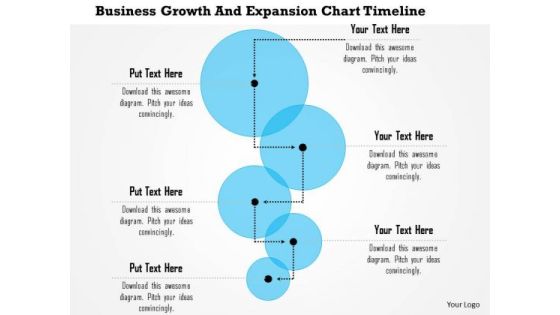
Business Framework Business Growth And Expansion Chart Timeline PowerPoint Presentation
Six staged process flow linear diagram is used to design this Power Point template. This PPT slide contains the concept of data and process flow. This exclusive PPT can be used for linear process flow representation in any presentation.

Business Diagram Seven Staged Concentric Diagram For Global Agenda Presentation Template
This Power Point template slide has been designed with graphic of seven staged concentric diagram. This PPT slide contains the concept of global agenda. Use this PPT slide for business and global data related presentation.
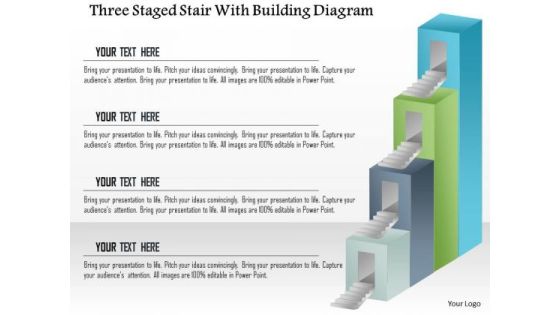
Business Diagram Three Staged Stair With Building Diagram Presentation Template
This Power Point template slide has been designed with graphic of three staged stair diagram. This PPT slide contains the concept of data representation. Use this PPt slide and build innovative presentation for your viewers.
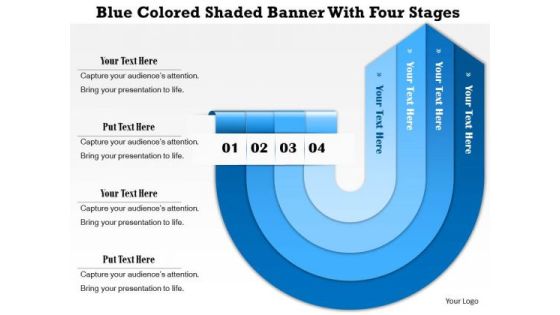
Business Diagram Blue Colored Shaded Banner With Four Stages Presentation Template
Blue colored twisted arrows are used to design this business diagram. These arrows are in banner style with four stages. Use this amazing slide for your data representation in effective manner. Build a unique presentation for your viewers
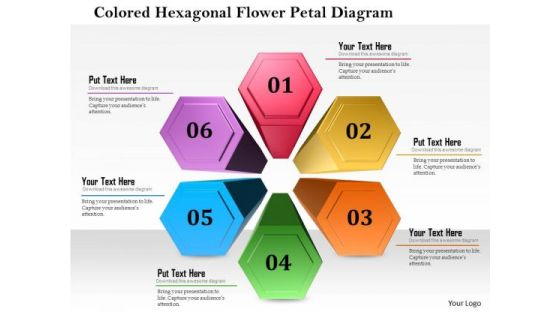
Business Diagram Colored Hexagon Flower Petal Diagram Presentation Template
This business diagram displays colored hexagon flower petal design. This Power Point slide can be used for data representation. Use this PPT slide to show flow of activities in circular manner. Get professional with this exclusive business slide.
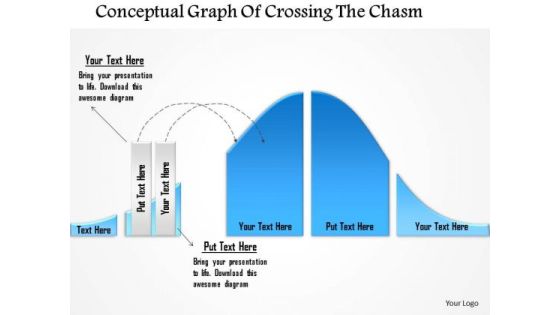
Business Diagram Conceptual Graph Of Crossing The Chasm Presentation Template
This business diagram has been designed with graphic of 3d graph. This slide contains the concept of chasm and data calculation. Use this slide to display chasm crossing condition. This business diagram adds value to your ideas.
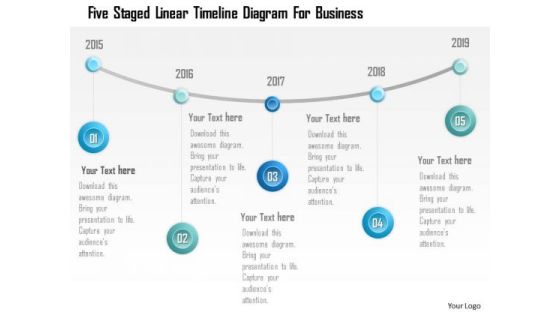
Business Diagram Five Staged Linear Timeline Diagram For Business PowerPoint Template
Five staged linear timeline diagram has been used to design this power point template. This diagram template contains the concept of business data and success strategy representation. Use this PPT for your business and sales related presentations.

Business Diagram Four Staged Stair Diagram With Foot Print PowerPoint Template
Four staged stair diagram with foot print has been used to design this power point template. This diagram template contains the concept of success and data flow. Use this PPT for your business and sales related presentations.
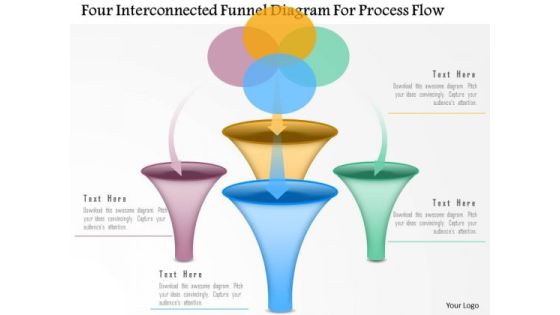
Business Diagram Four Interconnected Funnel Diagram For Process Flow Presentation Template
Graphic of four interconnected funnel diagram has been used to design this power point template diagram. This PPT diagram contains the concept of data and process flow. Use this PPT for marketing and business related presentations.

Business Diagram Three Interconnected Funnel Diagram Presentation Template
Graphic of three interconnected funnel diagram has been used to design this power point template diagram. This PPT diagram contains the concept of data and process flow. Use this PPT for marketing and business related presentations.
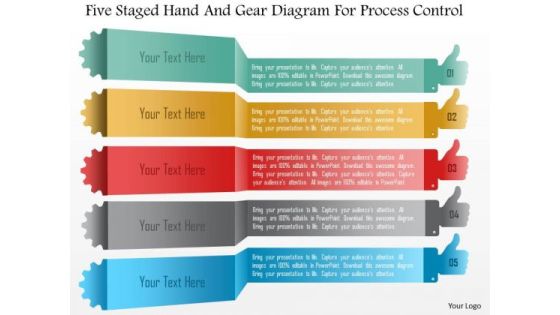
Business Diagram Five Staged Hand And Gear Diagram For Process Control PowerPoint Template
Five staged hand and gear diagram has been used to design this power point template. This PPT contains the concept of data representation and process control. Use this PPT slide for your marketing and business process related presentations.

Business Diagram Three Circular Financial Pie Chart PowerPoint Template
This power point template has been designed with graphic of three circular pie chart. This pie chart is suitable for financial data representation. Use this PPt for your business and finance related presentations.
Cloud Icons With Paper Clips PowerPoint Template
Visually support your presentation with our above template showing cloud icons with paper clips. This slide has been professionally designed to portray concepts like cloud computing and data storage. This template offers an excellent background to build impressive presentation.

Colorful Circle Arrow Diagram Powerpoint Template
Our above PPT slide contains circular arrow design. This business diagram helps to exhibit process flow. Use this diagram to impart more clarity to data and to create more sound impact on viewers.

Colorful Circular Arrows Diagram Powerpoint Template
Our above PPT slide contains circular arrow design. This business diagram helps to exhibit process flow. Use this diagram to impart more clarity to data and to create more sound impact on viewers.
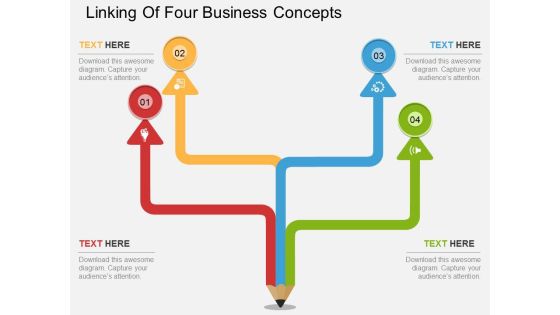
Linking Of Four Business Concepts Powerpoint Template
This PowerPoint template has been designed with four steps pencil diagram. This diagram is excellent visual tools to present link of steps. Download this PPT slide to explain complex data immediately and clearly.
Navigation Point Four Banners And Icons Powerpoint Template
This PowerPoint template has been designed with four banners icons. This diagram is excellent visual tools for business presentations. Download this PPT slide to explain complex data immediately and clearly.

Diagram Of Colorful Circular Arrows Powerpoint Template
Our above PPT slide contains circular arrow design. This business diagram helps to exhibit process flow. Use this diagram to impart more clarity to data and to create more sound impact on viewers.
Four Sequential Boxes And Icons Diagram Powerpoint Template
This PowerPoint template has been designed with four sequential boxes and icons. This diagram is excellent visual tools for business presentations. Download this PPT slide to explain complex data immediately and clearly.
Four Staged Numeric Banners With Icons Powerpoint Template
This PowerPoint template has been designed with four staged numeric banners icons. This diagram is excellent visual tools for business presentations. Download this PPT slide to explain complex data immediately and clearly.
Linear Arrow Process Diagram With Icons Powerpoint Template
This business slide has been designed with infographic of linear arrow. This arrow infographic can be used for data representation. Use this diagram for your business presentations. Build a quality presentation for your viewers with this unique diagram.

Three Arrow For Team Members Profile Powerpoint Slides
This PowerPoint template has been designed with three arrows and team pictures. This diagram is excellent visual tools for business presentations. Download this PPT slide to explain complex data immediately and clearly.
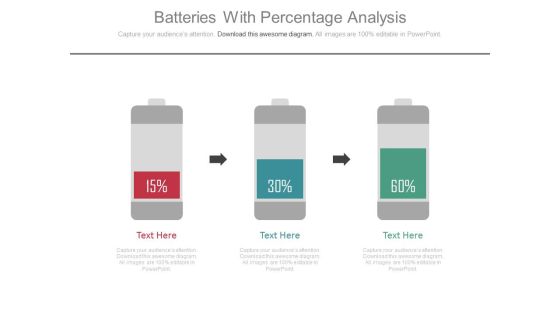
Three Batteries As Growth Steps Powerpoint Slides
This PowerPoint template has been designed with graphics of three batteries. Download this PPT slide for data comparisons or it may be used to display growth steps. Add this slide to your presentation and impress your superiors.

Business Team About Us Page Powerpoint Slides
This PowerPoint template has been designed with team pictures and business icons. This diagram is excellent visual tools to present teams strategic planning. Download this PPT slide to explain complex data immediately and clearly.
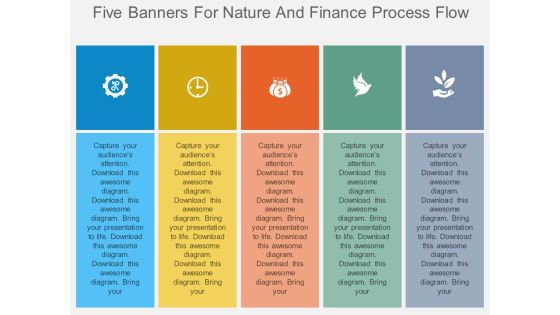
Five Banners For Nature And Finance Process Flow Powerpoint Template
This PowerPoint template has been designed with five banners nature, finance icons. This diagram is excellent visual tools for business presentations. Download this PPT slide to explain complex data immediately and clearly.
Four Arrows For Different Process Representation Powerpoint Template
This PowerPoint template has been designed with graphics of four arrows This diagram is excellent visual tools for business presentations. Download this PPT slide to explain complex data immediately and clearly.

Future Of Ecommerce Diagram Ppt Example File
This is a future of ecommerce diagram ppt example file. This is a six stage process. The stages in this process are responsive design, rich functionalities, social media, omni channel, mobile, data segmentation.

E Commerce Circle Examples Ppt Powerpoint Slides
This is a e commerce circle examples ppt powerpoint slides. This is a seven stage process. The stages in this process are business e commerce, security services, web hosting, shopping cart, web design, merchant processing, online marketing, data storage.
 Home
Home