AI PPT Maker
Templates
PPT Bundles
Design Services
Business PPTs
Business Plan
Management
Strategy
Introduction PPT
Roadmap
Self Introduction
Timelines
Process
Marketing
Agenda
Technology
Medical
Startup Business Plan
Cyber Security
Dashboards
SWOT
Proposals
Education
Pitch Deck
Digital Marketing
KPIs
Project Management
Product Management
Artificial Intelligence
Target Market
Communication
Supply Chain
Google Slides
Research Services
 One Pagers
All Categories
-
Home
- Customer Favorites
- Data Dashboard
Data Dashboard

BPM Tools Application To Increase Revenues And Customers Overview KPI Dashboard For Banks Clipart PDF
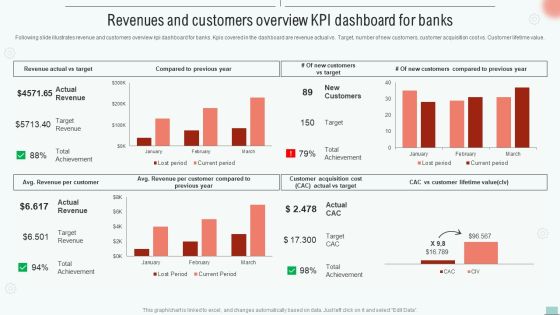
Following slide illustrates revenue and customers overview kip dashboard for banks. KPIs covered in the dashboard are revenue actual vs. target, number of new customers, customer acquisition cost vs. customer lifetime value. Get a simple yet stunning designed BPM Tools Application To Increase Revenues And Customers Overview KPI Dashboard For Banks Clipart PDF. It is the best one to establish the tone in your meetings. It is an excellent way to make your presentations highly effective. So, download this PPT today from Slidegeeks and see the positive impacts. Our easy-to-edit BPM Tools Application To Increase Revenues And Customers Overview KPI Dashboard For Banks Clipart PDF can be your go-to option for all upcoming conferences and meetings. So, what are you waiting for Grab this template today.
Implementing BPM Tool To Enhance Operational Efficiency Revenues And Customers Overview Kpi Dashboard Rules PDF
Following slide illustrates revenue and customers overview kpi dashboard for banks. Kpis covered in the dashboard are revenue actual vs. Target, number of new customers, customer acquisition cost vs. Customer lifetime value.This Implementing BPM Tool To Enhance Operational Efficiency Revenues And Customers Overview Kpi Dashboard Rules PDF is perfect for any presentation, be it in front of clients or colleagues. It is a versatile and stylish solution for organizing your meetings. The Implementing BPM Tool To Enhance Operational Efficiency Revenues And Customers Overview Kpi Dashboard Rules PDF features a modern design for your presentation meetings. The adjustable and customizable slides provide unlimited possibilities for acing up your presentation. Slidegeeks has done all the homework before launching the product for you. So, do not wait, grab the presentation templates today.

Cyber Risks And Incident Response Playbook KPI Dashboard To Track Department Wise Security Incidents Mockup PDF
Mentioned slide portrays KPI dashboard that can be used to monitor department wise security incidents. KPIs covered are new cases, total cases, resolved and pending cases. Presenting this PowerPoint presentation, titled Cyber Risks And Incident Response Playbook KPI Dashboard To Track Department Wise Security Incidents Mockup PDF, with topics curated by our researchers after extensive research. This editable presentation is available for immediate download and provides attractive features when used. Download now and captivate your audience. Presenting this Cyber Risks And Incident Response Playbook KPI Dashboard To Track Department Wise Security Incidents Mockup PDF. Our researchers have carefully researched and created these slides with all aspects taken into consideration. This is a completely customizable Cyber Risks And Incident Response Playbook KPI Dashboard To Track Department Wise Security Incidents Mockup PDF that is available for immediate downloading. Download now and make an impact on your audience. Highlight the attractive features available with our PPTs.

Customer Service Dashboard Strategies To Improve Customer Support Services Sample PDF
This slide showcases support service dashboard to track relevant performance metrics. Major KPIs covered are customer satisfaction, average time to resolve problem, cost per support, customer retention, request volume, etc. Presenting this PowerPoint presentation, titled Customer Service Dashboard Strategies To Improve Customer Support Services Sample PDF, with topics curated by our researchers after extensive research. This editable presentation is available for immediate download and provides attractive features when used. Download now and captivate your audience. Presenting this Customer Service Dashboard Strategies To Improve Customer Support Services Sample PDF. Our researchers have carefully researched and created these slides with all aspects taken into consideration. This is a completely customizable Customer Service Dashboard Strategies To Improve Customer Support Services Sample PDF that is available for immediate downloading. Download now and make an impact on your audience. Highlight the attractive features available with our PPTs.

Kpi Dashboard To Track Safety Program Performance Construction Site Safety Plan Summary PDF
This slide reflects the key performance indicator dashboard to track the performance of safety program. It includes information regarding the total manpower, manhours, unsafe conditions, lost time injuries frequency, injuries severity rate, along with the training hours. The Kpi Dashboard To Track Safety Program Performance Construction Site Safety Plan Summary PDF is a compilation of the most recent design trends as a series of slides. It is suitable for any subject or industry presentation, containing attractive visuals and photo spots for businesses to clearly express their messages. This template contains a variety of slides for the user to input data, such as structures to contrast two elements, bullet points, and slides for written information. Slidegeeks is prepared to create an impression.

Corporate Organization Playbook Key Business Metrics Dashboard Ppt Show Rules PDF
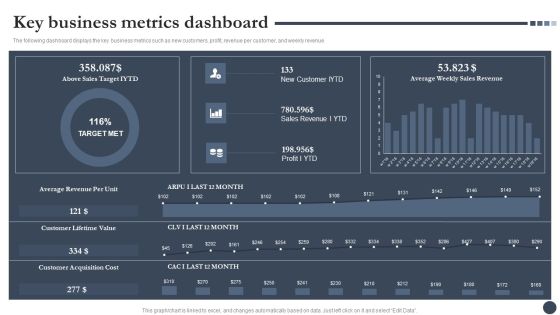
The following dashboard displays the key business metrics such as new customers, profit, revenue per customer, and weekly revenue. Deliver an awe inspiring pitch with this creative corporate organization playbook key business metrics dashboard ppt show rules pdf bundle. Topics like new customer iytd, sales revenue i ytd, profit i ytd can be discussed with this completely editable template. It is available for immediate download depending on the needs and requirements of the user.
Strategic Playbook For Enterprise Administration Key Business Metrics Dashboard Pictures PDF
The following dashboard displays the key business metrics such as new customers, profit, revenue per customer, and weekly revenue. Deliver and pitch your topic in the best possible manner with this Strategic Playbook For Enterprise Administration Key Business Metrics Dashboard Pictures PDF. Use them to share invaluable insights on Average Revenue Per Unit, Customer Lifetime Value, Customer Acquisition Cost and impress your audience. This template can be altered and modified as per your expectations. So, grab it now.

Comprehensive Guide To Enhance Kpi Dashboard To Monitor Sales Opportunities Information PDF
Mentioned slide shows the KPI dashboard that can be used to track win and lost sales opportunities. It includes metrics namely won opportunities, lost opportunities, pipeline by territory, total opportunities. Are you searching for a Comprehensive Guide To Enhance Kpi Dashboard To Monitor Sales Opportunities Information PDF that is uncluttered, straightforward, and original Its easy to edit, and you can change the colors to suit your personal or business branding. For a presentation that expresses how much effort youve put in, this template is ideal With all of its features, including tables, diagrams, statistics, and lists, its perfect for a business plan presentation. Make your ideas more appealing with these professional slides. Download Comprehensive Guide To Enhance Kpi Dashboard To Monitor Sales Opportunities Information PDF from Slidegeeks today.

Digital Marketing Strategy Dashboard To Track Social Media Ads Campaign Results Introduction PDF
This slide showcases dashboard that can help organization to track performance of social media advertising campaigns. Its key components are cost per conversion, CTR, link clicks, impressions, conversion rate, click through rate and cost per click. The Digital Marketing Strategy Dashboard To Track Social Media Ads Campaign Results Introduction PDF is a compilation of the most recent design trends as a series of slides. It is suitable for any subject or industry presentation, containing attractive visuals and photo spots for businesses to clearly express their messages. This template contains a variety of slides for the user to input data, such as structures to contrast two elements, bullet points, and slides for written information. Slidegeeks is prepared to create an impression.
Strategic B2B Marketing Plan Manufacturing Analytics And Reporting Dashboard Rules PDF
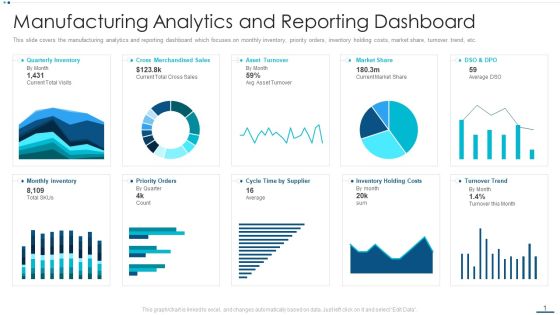
This slide covers the manufacturing analytics and reporting dashboard which focuses on monthly inventory, priority orders, inventory holding costs, market share, turnover trend, etc.Deliver and pitch your topic in the best possible manner with this strategic b2b marketing plan manufacturing analytics and reporting dashboard rules pdf Use them to share invaluable insights on quarterly inventory, monthly inventory, cross merchandised sales and impress your audience. This template can be altered and modified as per your expectations. So, grab it now.

Measuring Net Retention And Revenue Churn With Kpi Dashboard Ideas PDF
Mentioned slide outlines a comprehensive dashboard outlining the results of customer churn prevention strategies. The key performance indicators KPIs covered in the slide are net promoter score NPS, loyal customer rate, customer lifetime value CLV, revenue churn, net retention rate, etc. The Measuring Net Retention And Revenue Churn With Kpi Dashboard Ideas PDF is a compilation of the most recent design trends as a series of slides. It is suitable for any subject or industry presentation, containing attractive visuals and photo spots for businesses to clearly express their messages. This template contains a variety of slides for the user to input data, such as structures to contrast two elements, bullet points, and slides for written information. Slidegeeks is prepared to create an impression.

Automating Key Activities Of HR Manager Dashboard Showing Employee Measurement Metrics Clipart PDF
This slide shows the dashboard that depicts the metrics for measuring employee performance which includes talent satisfaction, talent turnover rate, rating, etc.Deliver and pitch your topic in the best possible manner with this Automating Key Activities Of HR Manager Dashboard Showing Employee Measurement Metrics Clipart PDF Use them to share invaluable insights on Talent Management, Talent Satisfaction, Talent Turnover and impress your audience. This template can be altered and modified as per your expectations. So, grab it now.

Cost Saving With Agile Methodology IT Agile Dashboard For Tracking Sprint Progress Mockup PDF
Mentioned slide displays agile dashboard that can be used by organization to track sprint progress. KPIs covered here are overall sprint progress, statistics by priority and statistics by status.Deliver an awe inspiring pitch with this creative cost saving with agile methodology it agile dashboard for tracking sprint progress mockup pdf bundle. Topics like statistics by priority, contract review, statistics by status can be discussed with this completely editable template. It is available for immediate download depending on the needs and requirements of the user.

Building Innovation Capabilities And USP Detection Marketing KPI And Dashboard Ppt Infographic Template Pictures PDF
Show your sale and financial highlights of through our dashboard. Deliver an awe-inspiring pitch with this creative building innovation capabilities and usp detection marketing kpi and dashboard ppt infographic template pictures pdf bundle. Topics like revenue per acquisition, per acquisition, marketing spend, total revenu, leads, acquisitions, profit, return on investment can be discussed with this completely editable template. It is available for immediate download depending on the needs and requirements of the user.
Unified Business To Consumer Marketing Strategy Marketing Performance Dashboard Introduction PDF
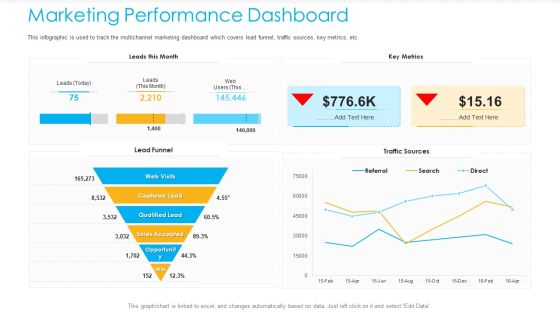
This infographic is used to track the multichannel marketing dashboard which covers lead funnel, traffic sources, key metrics, etc.Deliver an awe-inspiring pitch with this creative unified business to consumer marketing strategy marketing performance dashboard introduction pdf bundle. Topics like captured lead, qualified lead, sales accepted can be discussed with this completely editable template. It is available for immediate download depending on the needs and requirements of the user.
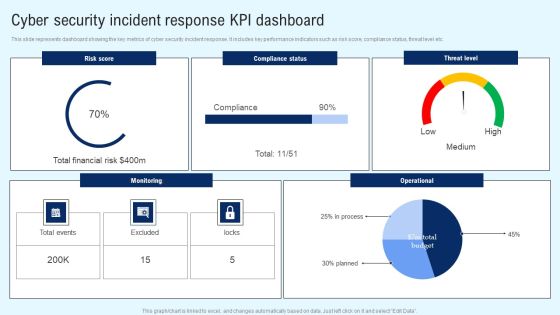
Implementing Cyber Security Incident Cyber Security Incident Response KPI Dashboard Clipart PDF
This slide represents dashboard showing the key metrics of cyber security incident response. It includes key performance indicators such as risk score, compliance status, threat level etc. There are so many reasons you need a Implementing Cyber Security Incident Cyber Security Incident Response KPI Dashboard Clipart PDF. The first reason is you cannot spend time making everything from scratch, Thus, Slidegeeks has made presentation templates for you too. You can easily download these templates from our website easily.

KPI Dashboard For Informational Technology Department To Analyze Key Financials Structure PDF
This slide shows KPI dashboard for informational technology department to analyze key financials of companies which assists in decision making for growth. It also includes information about IT department ROI, expenditure vs. Allocated budget, it cost breakdown and it expenditure vs. Revenue. Pitch your topic with ease and precision using this KPI Dashboard For Informational Technology Department To Analyze Key Financials Structure PDF. This layout presents information on Expenditure Vs Allocated, Budget IT Cost, Break Down IT, Expenditure Vs Revenue, IT Department ROI. It is also available for immediate download and adjustment. So, changes can be made in the color, design, graphics or any other component to create a unique layout.
Mobile User Interface Issue Tracker Dashboard In Information Technology Ideas PDF
This slide shows mobile user interface issue tracker dashboard in information technology which can be referred by software engineers to rectify smartphone issues. It contains information about project, component, generated vs. completed issues, issue by status, issue count by project and component and incomplete issues. Pitch your topic with ease and precision using this Mobile User Interface Issue Tracker Dashboard In Information Technology Ideas PDF. This layout presents information on Issues Count By, Project And Components, Incomplete Issues By, Priority And Project. It is also available for immediate download and adjustment. So, changes can be made in the color, design, graphics or any other component to create a unique layout.
Web App Firewall Services IT Kpis Dashboard For Threat Tracking In WAF Guidelines PDF
This slide depicts how threat risk will be monitored and threat detection will be done in the organization through web application firewall implementation. Deliver and pitch your topic in the best possible manner with this web app firewall services it kpis dashboard for threat tracking in waf guidelines pdf. Use them to share invaluable insights on kpis or dashboard for threat tracking in waf and impress your audience. This template can be altered and modified as per your expectations. So, grab it now.
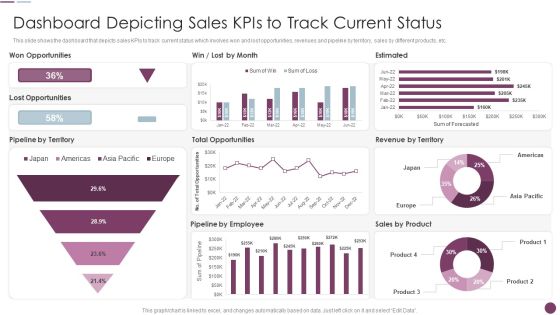
Sales Automation Procedure Dashboard Depicting Sales Kpis To Track Current Status Sample PDF
This slide shows the dashboard that depicts sales KPIs to track current status which involves won and lost opportunities, revenues and pipeline by territory, sales by different products, etc. Deliver an awe inspiring pitch with this creative Sales Automation Procedure Dashboard Depicting Sales Kpis To Track Current Status Sample PDF bundle. Topics like Estimated, Pipeline Employee, Pipeline Territory can be discussed with this completely editable template. It is available for immediate download depending on the needs and requirements of the user.
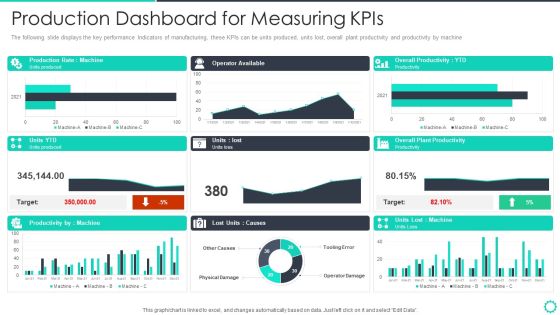
Manufacturing Operation Quality Improvement Practices Tools Templates Production Dashboard For Mockup PDF
The following slide displays the key performance Indicators of manufacturing, these KPIs can be units produced, units lost, overall plant productivity and productivity by machine. Deliver an awe inspiring pitch with this creative manufacturing operation quality improvement practices tools templates production dashboard for mockup pdf bundle. Topics like production dashboard for measuring kpis can be discussed with this completely editable template. It is available for immediate download depending on the needs and requirements of the user.
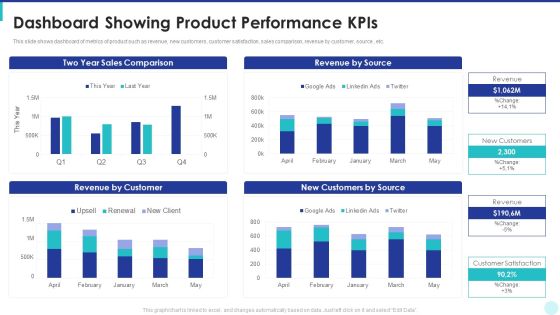
Optimization Of Product Development Life Cycle Dashboard Showing Product Performance Kpis Topics PDF
This slide shows dashboard of metrics of product such as revenue, new customers, customer satisfaction, sales comparison, revenue by customer, source , etc. Deliver an awe inspiring pitch with this creative optimization of product development life cycle dashboard showing product performance kpis topics pdf bundle. Topics like sales comparison, revenue by source, revenue by customer, customers by source can be discussed with this completely editable template. It is available for immediate download depending on the needs and requirements of the user.

Competitive Sales Strategy Development Plan For Revenue Growth Dashboard Depicting Product Sales Kpis Elements PDF
This slide shows the dashboard that depicts product sales metrics which focuses on revenue generated from top products, incremental sales by campaign, cost of goods sold, etc. Deliver an awe inspiring pitch with this creative Competitive Sales Strategy Development Plan For Revenue Growth Dashboard Depicting Product Sales Kpis Elements PDF bundle. Topics like Incremental Sales, Cost, Store Purchases can be discussed with this completely editable template. It is available for immediate download depending on the needs and requirements of the user.

Kpis For Evaluating Business Sustainability Customer Churn Rate Dashboard Guidelines PDF
Mentioned slide covers customer churn rate dashboard. It includes details of monthly customer churn rate, accounts opened, churned accounts demographics and churn heatmap. Deliver an awe inspiring pitch with this creative Kpis For Evaluating Business Sustainability Customer Churn Rate Dashboard Guidelines PDF bundle. Topics like Accounts Opened, Monthly Customer, Churn Rate, Demographics can be discussed with this completely editable template. It is available for immediate download depending on the needs and requirements of the user.

Kpis For Evaluating Business Sustainability Customer Lifetime Value Dashboard Clipart PDF
This slide covers customer lifetime value dashboard. It covers details of average customer lifetime and average lifetime value in a 12 months format. Deliver and pitch your topic in the best possible manner with this Kpis For Evaluating Business Sustainability Customer Lifetime Value Dashboard Clipart PDF. Use them to share invaluable insights on Average Customer Lifetime, Average Lifetime Value and impress your audience. This template can be altered and modified as per your expectations. So, grab it now.
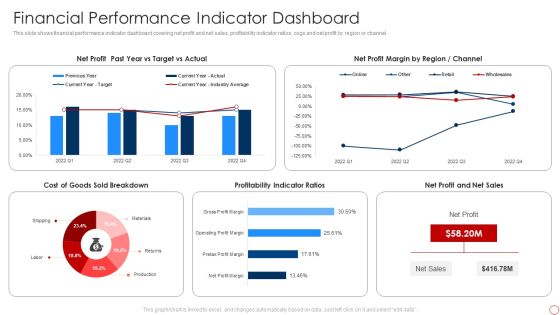
Kpis For Evaluating Business Sustainability Financial Performance Indicator Dashboard Demonstration PDF
This slide shows financial performance indicator dashboard covering net profit and net sales, profitability indicator ratios, cogs and net profit by region or channel. Deliver and pitch your topic in the best possible manner with this Kpis For Evaluating Business Sustainability Financial Performance Indicator Dashboard Demonstration PDF. Use them to share invaluable insights on Net Profit, Net Profit Margin, Profitability Indicator Ratios and impress your audience. This template can be altered and modified as per your expectations. So, grab it now.
WAF Platform Kpis Dashboard For Threat Tracking In WAF Demonstration PDF
This slide depicts how threat risk will be monitored and threat detection will be done in the organization through web application firewall implementation. Deliver an awe inspiring pitch with this creative WAF Platform Kpis Dashboard For Threat Tracking In WAF Demonstration PDF bundle. Topics like Current Risk Status, Threat Dashboard, Risk By Threats can be discussed with this completely editable template. It is available for immediate download depending on the needs and requirements of the user.
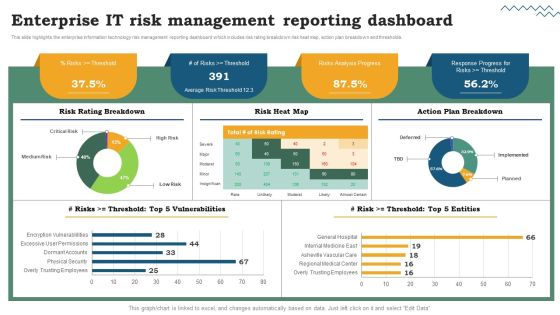
Risk Evaluation Of Information Technology Systems Enterprise IT Risk Management Reporting Dashboard Formats PDF
This slide highlights the enterprise information technology risk management reporting dashboard which includes risk rating breakdown risk heat map, action plan breakdown and thresholds. From laying roadmaps to briefing everything in detail, our templates are perfect for you. You can set the stage with your presentation slides. All you have to do is download these easy-to-edit and customizable templates. Risk Evaluation Of Information Technology Systems Enterprise IT Risk Management Reporting Dashboard Formats PDF will help you deliver an outstanding performance that everyone would remember and praise you for. Do download this presentation today.

Implementing Digital Transformation Kpi Dashboard To Track Digital Transformation Initiatives Structure PDF
Following slide provides dashboard that can be used by the businesses to measure the performance of digital transformation initiatives with the help of different KPIs. KPIs covered are social presence, click through rate, sales revenue, churn amount etc. The Implementing Digital Transformation Kpi Dashboard To Track Digital Transformation Initiatives Structure PDF is a compilation of the most recent design trends as a series of slides. It is suitable for any subject or industry presentation, containing attractive visuals and photo spots for businesses to clearly express their messages. This template contains a variety of slides for the user to input data, such as structures to contrast two elements, bullet points, and slides for written information. Slidegeeks is prepared to create an impression.
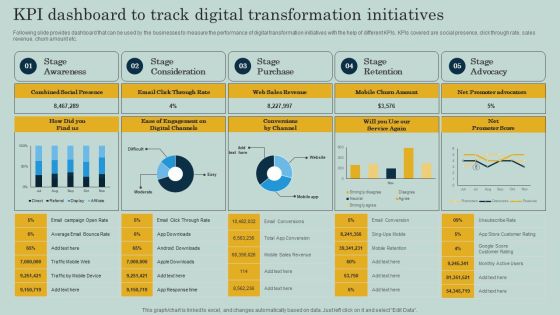
KPI Dashboard To Track Digital Transformation Initiatives Ppt Show Backgrounds PDF
Following slide provides dashboard that can be used by the businesses to measure the performance of digital transformation initiatives with the help of different KPIs. KPIs covered are social presence, click through rate, sales revenue, churn amount etc. The KPI Dashboard To Track Digital Transformation Initiatives Ppt Show Backgrounds PDF is a compilation of the most recent design trends as a series of slides. It is suitable for any subject or industry presentation, containing attractive visuals and photo spots for businesses to clearly express their messages. This template contains a variety of slides for the user to input data, such as structures to contrast two elements, bullet points, and slides for written information. Slidegeeks is prepared to create an impression.

Enhancing Information Technology With Strategic Dashboard To Track IT Security Summary PDF
This slide portrays information regarding the dashboard that firm will track various incidents detected. These incidents will be managed in order to avoid security risks. Slidegeeks is one of the best resources for PowerPoint templates. You can download easily and regulate Enhancing Information Technology With Strategic Dashboard To Track IT Security Summary PDF for your personal presentations from our wonderful collection. A few clicks is all it takes to discover and get the most relevant and appropriate templates. Use our Templates to add a unique zing and appeal to your presentation and meetings. All the slides are easy to edit and you can use them even for advertisement purposes.
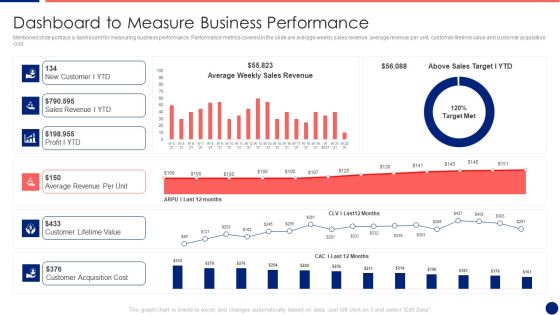
Information Technology Service Integration Post Acquisition Merger Dashboard To Measure Business Pictures PDF
Mentioned slide portrays a dashboard for measuring business performance. Performance metrics covered in the slide are average weekly sales revenue, average revenue per unit, customer lifetime value and customer acquisition cost. Deliver and pitch your topic in the best possible manner with this information technology service integration post acquisition merger dashboard to measure business pictures pdf. Use them to share invaluable insights on sales revenue, average, cost and impress your audience. This template can be altered and modified as per your expectations. So, grab it now.
IT Security Dashboard For Threat Tracking In Information Technology Security Ppt Inspiration Gallery PDF
This slide depicts the dashboard for threat tracking in cyber security by covering monthly threat status, current risk status, threat-based on the role, threats by owners, risk by threats, and threat report. Deliver an awe inspiring pitch with this creative it security dashboard for threat tracking in information technology security ppt inspiration gallery pdf bundle. Topics like current risk status, threat report, risk by threats, threats based on role, threats by owners can be discussed with this completely editable template. It is available for immediate download depending on the needs and requirements of the user.
Information Technology Change Implementation Plan Dashboard For Issues Tracking Clipart PDF
This slide shows the issues tracking the dashboard for the business transition project. It provides details of multiple issues faced by users to keep records for effective management of the project. Deliver an awe inspiring pitch with this creative Information Technology Change Implementation Plan Dashboard For Issues Tracking Clipart PDF bundle. Topics like Issues Failed Verification, Immediate Issues, High Churn Issues, Suspect Requirements, Failed Test Runs can be discussed with this completely editable template. It is available for immediate download depending on the needs and requirements of the user.

Cyber Risks And Incident Response Playbook Real Time Incident Management Dashboard Guidelines PDF
Following slide illustrate KPI dashboard that can be used by organizations to track real time incident data. KPIs covered are number of tickets, average resolution time per customer, incidents registered per month. This Cyber Risks And Incident Response Playbook Real Time Incident Management Dashboard Guidelines PDF from Slidegeeks makes it easy to present information on your topic with precision. It provides customization options, so you can make changes to the colors, design, graphics, or any other component to create a unique layout. It is also available for immediate download, so you can begin using it right away. Slidegeeks has done good research to ensure that you have everything you need to make your presentation stand out. Make a name out there for a brilliant performance.

CYBER Security Breache Response Strategy Cyber Supply Chain Risk Management Dashboard Inspiration PDF
This slide shows the dashboard representing details related to management of supply chain risks by the incident management team. It includes details related to KPIs such as policy and compliance, resource security hygiene etc. The CYBER Security Breache Response Strategy Cyber Supply Chain Risk Management Dashboard Inspiration PDF is a compilation of the most recent design trends as a series of slides. It is suitable for any subject or industry presentation, containing attractive visuals and photo spots for businesses to clearly express their messages. This template contains a variety of slides for the user to input data, such as structures to contrast two elements, bullet points, and slides for written information. Slidegeeks is prepared to create an impression.

Real Time Website Traffic Analysis Dashboard Ppt Inspiration Graphics Download PDF
The following slide depicts real time website traffic analytical dashboard to monitor current events and plan actions accordingly. It includes elements such as traffic sources by location, device type, views per minute, visitor activity status etc. Are you searching for a Real Time Website Traffic Analysis Dashboard Ppt Inspiration Graphics Download PDF that is uncluttered, straightforward, and original Its easy to edit, and you can change the colors to suit your personal or business branding. For a presentation that expresses how much effort you have put in, this template is ideal With all of its features, including tables, diagrams, statistics, and lists, its perfect for a business plan presentation. Make your ideas more appealing with these professional slides. Download Real Time Website Traffic Analysis Dashboard Ppt Inspiration Graphics Download PDF from Slidegeeks today.

Campaign Sessions And Conversion Performance Dashboard Ppt Infographic Template Tips PDF
Following slide illustrates campaign session and conversion performance dashboard. It covers details such as revenues, cost per click, transactions, impressions, sessions and conversion performance. Deliver an awe-inspiring pitch with this creative campaign sessions and conversion performance dashboard ppt infographic template tips pdf. bundle. Topics like revenue, sessions and conversations performance can be discussed with this completely editable template. It is available for immediate download depending on the needs and requirements of the user.

Prevention Of Information KPI Dashboard To Monitor Cyber Security Performance Information PDF
The purpose of this slide is to highlight key performance indicator KPI dashboard which can be used to track the performance of organization cyber security. The KPI metrics covered in the slide are asset type control, control issues by standard AND regulation etc. This Prevention Of Information KPI Dashboard To Monitor Cyber Security Performance Information PDF is perfect for any presentation, be it in front of clients or colleagues. It is a versatile and stylish solution for organizing your meetings. The Prevention Of Information KPI Dashboard To Monitor Cyber Security Performance Information PDF features a modern design for your presentation meetings. The adjustable and customizable slides provide unlimited possibilities for acing up your presentation. Slidegeeks has done all the homework before launching the product for you. So, dont wait, grab the presentation templates today
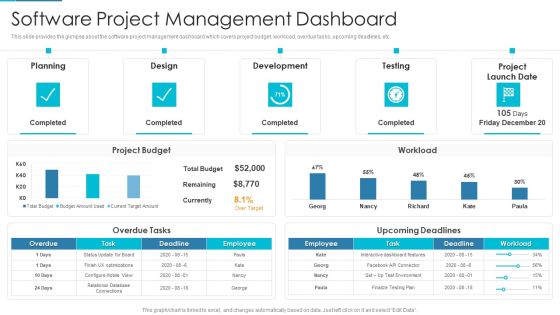
Project Management Outline For Schedule Performance Index Software Project Management Dashboard Infographics PDF
This slide provides the glimpse about the software project management dashboard which covers project budget, workload, overdue tasks, upcoming deadlines, etc. Deliver and pitch your topic in the best possible manner with this project management outline for schedule performance index software project management dashboard infographics pdf. Use them to share invaluable insights on planning, design, development, testing, project launch date and impress your audience. This template can be altered and modified as per your expectations. So, grab it now.
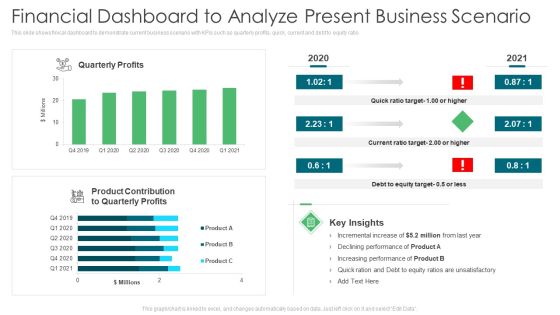
Environmental Assessment Financial Dashboard To Analyze Present Business Scenario Ppt Infographics Ideas PDF
This slide shows finical dashboard to demonstrate current business scenario with KPIs such as quarterly profits, quick, current and debt to equity ratio. Deliver an awe inspiring pitch with this creative environmental assessment financial dashboard to analyze present business scenario ppt infographics ideas pdf bundle. Topics like product contribution, increasing performance, equity target can be discussed with this completely editable template. It is available for immediate download depending on the needs and requirements of the user.
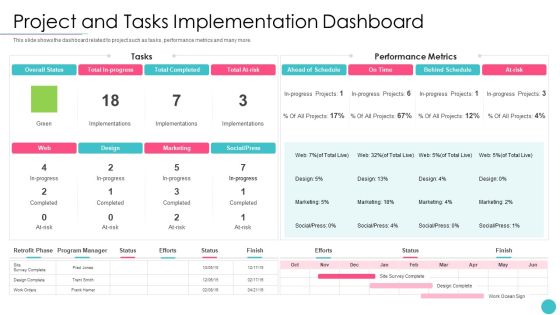
Effective Project Management With Key Milestones Project And Tasks Implementation Dashboard Themes PDF
This slide shows the dashboard related to project such as tasks, performance metrics and many more. Deliver an awe inspiring pitch with this creative effective project management with key milestones project and tasks implementation dashboard themes pdf bundle. Topics like marketing, design, social, risk can be discussed with this completely editable template. It is available for immediate download depending on the needs and requirements of the user.
Half Yearly Content Project Plan Analysis Dashboard Ppt Icon Background Designs PDF
This slide defines the dashboard for 6 month content project plan analysis . it includes information related to the progress, risk , project summary, tasks, etc. Pitch your topic with ease and precision using this Half Yearly Content Project Plan Analysis Dashboard Ppt Icon Background Designs PDF. This layout presents information on Overall Progress, Planning, Risks. It is also available for immediate download and adjustment. So, changes can be made in the color, design, graphics or any other component to create a unique layout.

Optimizing E Business Promotion Plan Dashboard Showing E Marketing Performance Ideas PDF
This slide focuses on the dashboard that shows the e-marketing performance such ad lead funnel, traffic sources, monthly leads and key metrics. Deliver an awe inspiring pitch with this creative Optimizing E Business Promotion Plan Dashboard Showing E Marketing Performance Ideas PDF bundle. Topics like Lead Funnel, Key Metrics, Traffic Sources can be discussed with this completely editable template. It is available for immediate download depending on the needs and requirements of the user.
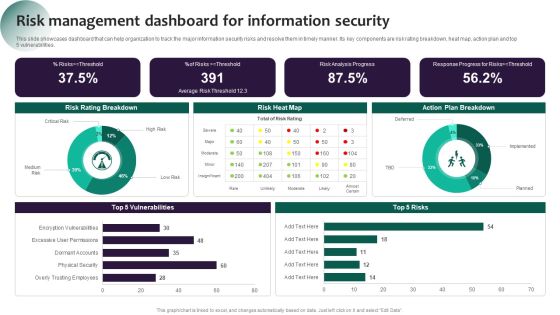
Information Systems Security And Risk Management Plan Risk Management Dashboard For Information Security Pictures PDF
This slide showcases dashboard that can help organization to track the major information security risks and resolve them in timely manner. Its key components are risk rating breakdown, heat map, action plan and top 5 vulnerabilities. The best PPT templates are a great way to save time, energy, and resources. Slidegeeks have 100 percent editable powerpoint slides making them incredibly versatile. With these quality presentation templates, you can create a captivating and memorable presentation by combining visually appealing slides and effectively communicating your message. Download Information Systems Security And Risk Management Plan Risk Management Dashboard For Information Security Pictures PDF from Slidegeeks and deliver a wonderful presentation.

Online Customer Interaction Dashboard For Tracking Social Media Platforms Infographics PDF
This slide covers the KPI dashboard for analyzing social media channels. It includes metrics such as social media followers, Facebook daily reach, Facebook engaged users and page impressions, etc. Deliver and pitch your topic in the best possible manner with this Online Customer Interaction Dashboard For Tracking Social Media Platforms Infographics PDF. Use them to share invaluable insights on Awareness, Daily Reach, Impression Final and impress your audience. This template can be altered and modified as per your expectations. So, grab it now.

Unified Business To Consumer Marketing Strategy Lead Generation Dashboard Template PDF
This infographic is used to track the multichannel marketing dashboard which covers lead breakdown, different social media channels, conversion metrics.Deliver and pitch your topic in the best possible manner with this unified business to consumer marketing strategy lead generation dashboard template pdf. Use them to share invaluable insights on key conversion metrics, today lead by program, leads this month and impress your audience. This template can be altered and modified as per your expectations. So, grab it now.

Dashboard For Tracking Customer Service Team Performance Consumer Contact Point Guide Diagrams PDF
This slide covers the KPI dashboard for analyzing the performance of client support department. It includes metrics such as first call resolution, unresolved calls, average response rate, the best day to call, average time to solve issues, etc. The Dashboard For Tracking Customer Service Team Performance Consumer Contact Point Guide Diagrams PDF is a compilation of the most recent design trends as a series of slides. It is suitable for any subject or industry presentation, containing attractive visuals and photo spots for businesses to clearly express their messages. This template contains a variety of slides for the user to input data, such as structures to contrast two elements, bullet points, and slides for written information. Slidegeeks is prepared to create an impression.

Dashboard For Tracking Brand Communication Campaign Results Executing Brand Communication Strategy Clipart PDF
This slide covers the dashboard for monitoring various audience segments. It includes metrics such as ad mentions, engagement, top occupation of the audience, top interest of the audience, age, language, etc. The Dashboard For Tracking Brand Communication Campaign Results Executing Brand Communication Strategy Clipart PDF is a compilation of the most recent design trends as a series of slides. It is suitable for any subject or industry presentation, containing attractive visuals and photo spots for businesses to clearly express their messages. This template contains a variety of slides for the user to input data, such as structures to contrast two elements, bullet points, and slides for written information. Slidegeeks is prepared to create an impression.

Dashboard For Tracking Business And IT Alignment Ppt PowerPoint Presentation File Background Images PDF
This slide depicts the dashboard for business and IT alignment by covering details of total sales, customer support service, percentage of business operations aligned IT, usage of communication channels, and top performer associates. The Dashboard For Tracking Business And IT Alignment Ppt PowerPoint Presentation File Background Images PDF is a compilation of the most recent design trends as a series of slides. It is suitable for any subject or industry presentation, containing attractive visuals and photo spots for businesses to clearly express their messages. This template contains a variety of slides for the user to input data, such as structures to contrast two elements, bullet points, and slides for written information. Slidegeeks is prepared to create an impression.
Inbound Lead Performance Tracking Dashboard Enhancing Client Lead Conversion Rates Structure PDF
This slide covers the KPI dashboard for evaluating inbound lead performance. It includes metrics such as lead to opportunity ratio, opportunity to win ratio, lead conversion ratio, inbound leads, and leads in the sales funnel. The Inbound Lead Performance Tracking Dashboard Enhancing Client Lead Conversion Rates Structure PDF is a compilation of the most recent design trends as a series of slides. It is suitable for any subject or industry presentation, containing attractive visuals and photo spots for businesses to clearly express their messages. This template contains a variety of slides for the user to input data, such as structures to contrast two elements, bullet points, and slides for written information. Slidegeeks is prepared to create an impression.
Inbound Lead Performance Tracking Dashboard Improving Lead Generation Process Pictures PDF
This slide covers the KPI dashboard for evaluating inbound lead performance. It includes metrics such as lead to opportunity ratio, opportunity to win ratio, lead conversion ratio, inbound leads, and leads in the sales funnel. The Inbound Lead Performance Tracking Dashboard Improving Lead Generation Process Pictures PDF is a compilation of the most recent design trends as a series of slides. It is suitable for any subject or industry presentation, containing attractive visuals and photo spots for businesses to clearly express their messages. This template contains a variety of slides for the user to input data, such as structures to contrast two elements, bullet points, and slides for written information. Slidegeeks is prepared to create an impression.

KPI Dashboard To Monitor Financial Budget Allocation And Distribution Portrait PDF
This slide signifies the key performance indicator dashboard on organisation financial budget allocation within various department. It includes budget allocation, monthly performance, top suppliers etc.Deliver an awe inspiring pitch with this creative KPI Dashboard To Monitor Financial Budget Allocation And Distribution Portrait PDF bundle. Topics like Budget Allocated, Budget Distributed, Payable Account can be discussed with this completely editable template. It is available for immediate download depending on the needs and requirements of the user.

Real Estate Marketing Strategy Vendors Real Estate Marketing Dashboard Formats PDF
This template covers KPI dashboard for real estate marketing plan including website visitors, page review, top referrals, traffic sources, email campaign etc. Deliver and pitch your topic in the best possible manner with this real estate marketing strategy vendors real estate marketing dashboard formats pdf. Use them to share invaluable insights on leads trend, email campaigns, mobile and impress your audience. This template can be altered and modified as per your expectations. So, grab it now.
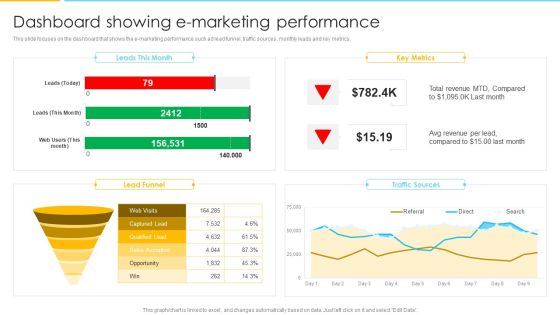
Optimizing Ecommerce Marketing Plan To Improve Sales Dashboard Showing E Marketing Performance Formats PDF
This slide focuses on the dashboard that shows the e marketing performance such ad lead funnel, traffic sources, monthly leads and key metrics. Deliver an awe inspiring pitch with this creative Optimizing Ecommerce Marketing Plan To Improve Sales Dashboard Showing E Marketing Performance Formats PDF bundle. Topics like Revenue, Key Metrics, Traffic Sources can be discussed with this completely editable template. It is available for immediate download depending on the needs and requirements of the user.
Environmental Assessment Financial Dashboard For Business Impact Tracking Ppt Layouts Guidelines PDF
This slide shows financial dashboard for business impact tracking with key performance indicators like quick ratio, current ratio, monthly cash flow etc Deliver and pitch your topic in the best possible manner with this environmental assessment financial dashboard for business impact tracking ppt layouts guidelines pdf. Use them to share invaluable insights on sales outstanding, cash balance, accounts payable and impress your audience. This template can be altered and modified as per your expectations. So, grab it now.
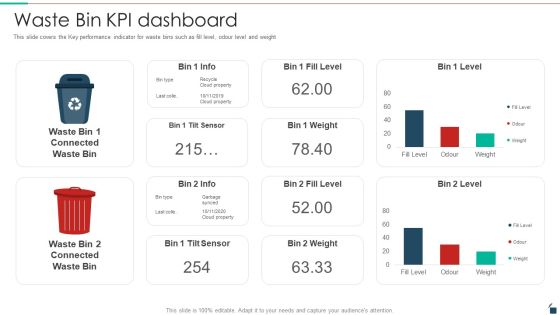
Waste Bin KPI Dashboard Resources Recycling And Waste Management Template PDF
This slide covers the Key performance indicator for waste bins such as fill level, odour level and weight. Deliver an awe inspiring pitch with this creative waste bin kpi dashboard resources recycling and waste management template pdf bundle. Topics like waste bin kpi dashboard can be discussed with this completely editable template. It is available for immediate download depending on the needs and requirements of the user.
Waste Management Tracking Dashboard Resources Recycling And Waste Management Pictures PDF
This slide covers the key performance indicators for waste management including waste trucks tracker, green house gasses emissions, energy used and many more. Deliver an awe inspiring pitch with this creative waste management tracking dashboard resources recycling and waste management pictures pdf bundle. Topics like waste management tracking dashboard can be discussed with this completely editable template. It is available for immediate download depending on the needs and requirements of the user.

AI And ML Driving Monetary Value For Organization Customer Engagement Tracking Kpi Dashboard Pictures PDF
This slide displays customer engagement dashboard. It include key performance indicators namely median lifetime spend. Average churn risk, brand affinities and highly engaged customers. Deliver an awe inspiring pitch with this creative ai and ml driving monetary value for organization customer engagement tracking kpi dashboard pictures pdf bundle. Topics like high earners, high engaged customers, return customers, brand affinities, interests can be discussed with this completely editable template. It is available for immediate download depending on the needs and requirements of the user.
Shipping And Logistics Tracking Dashboard With Shipments And Fleet Status Pictures PDF
This slide covers Key performance indicators to track the automation system of the company. This dashboard includes Logistics Efficiency Status, delivery time accuracy etc. Deliver an awe inspiring pitch with this creative Shipping And Logistics Tracking Dashboard With Shipments And Fleet Status Pictures PDF bundle. Topics like Profit, Costs, Revenue can be discussed with this completely editable template. It is available for immediate download depending on the needs and requirements of the user.
