Data Dashboard

Multi Segment Circle For Data Interpretation Powerpoint Template
This PowerPoint template has been designed with circular web diagram. This diagram is useful to display outline of a business plan. Visual effect helps in maintaining the flow of the discussion and provides more clarity to the subject.

Plan And Frame Problem Collect The Data Ppt Sample
This is a plan and frame problem collect the data ppt sample. This is a four stage process. The stages in this process are business, marketing, success.

Analyze Online And Offline Marketing Campaigns Data Ideas PDF
This template covers dashboard to measure and analyze target marketing campaign performance. It also helps in tracking and reporting online and offline marketing campaigns through KPIs such as traffic sources, lead generation metrics, offline product sales, store visitations, customer acquisition, and offline retention and advocacy. Find a pre designed and impeccable Analyze Online And Offline Marketing Campaigns Data Ideas PDF. The templates can ace your presentation without additional effort. You can download these easy to edit presentation templates to make your presentation stand out from others. So, what are you waiting for Download the template from Slidegeeks today and give a unique touch to your presentation.

Data And Analytics Ppt PowerPoint Presentation Icon Layouts Cpb
This is a data and analytics ppt powerpoint presentation icon layouts cpb. This is a five stage process. The stages in this process are data and analytics.

Big Data Processing Application Ppt PowerPoint Presentation Shapes
This is a big data processing application ppt powerpoint presentation shapes. This is a two stage process. The stages in this process are small data, big data, low volumes, batch velocities, structured varieties, into petabyte volumes.
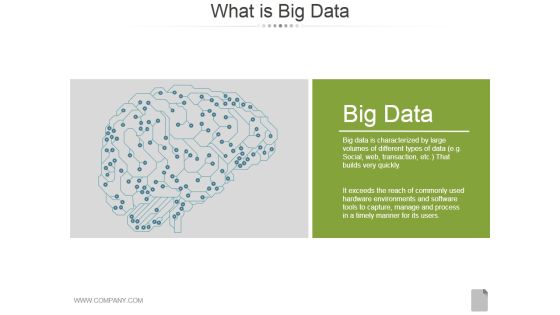
What Is Big Data Ppt PowerPoint Presentation Diagrams
This is a what is big data ppt powerpoint presentation diagrams. This is a one stage process. The stages in this process are big data, business, analysis, management, marketing.
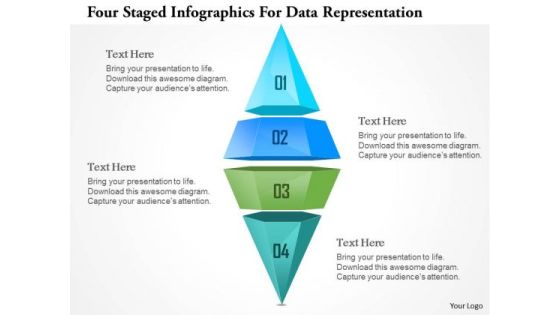
Busines Diagram Four Staged Ingographics For Data Representation Ppt Template
This business diagram has been designed with graphic of four staged info graphics. This info graphic can be used for data representation. Deliver amazing presentations to mesmerize your audience.

Business Diagram Diagram For Visual Data Display Presentation Template
Four colored cylindrical bars with percentage values are used to design this power point template. This diagram slide helps to display financial data analysis. Use this diagram for your business and finance related presentations.

Consulting Slides Bar Chart For Data Interpretation Business Presentation
This pre-designed and appealing bar chart for PowerPoint offer an optimized possibility to illustrate your business strategy. You can use this diagram for data interpretation. This diagram is editable and can be easily adjusted.

Big Data Software Application Brain Diagram Ppt PowerPoint Presentation Slides
This is a big data software application brain diagram ppt powerpoint presentation slides. This is a one stage process. The stages in this process are big data, communication, business, marketing, idea.

Data Interpretations Market Analysis Templates For Business Plan PowerPoint
We present our data interpretations market analysis templates for business plan PowerPoint.Present our Circle Charts PowerPoint Templates because Our PowerPoint Templates and Slides come in all colours, shades and hues. They help highlight every nuance of your views. Use our Business PowerPoint Templates because Our PowerPoint Templates and Slides will let you Hit the right notes. Watch your audience start singing to your tune. Download our Shapes PowerPoint Templates because Our PowerPoint Templates and Slides will fulfill your every need. Use them and effectively satisfy the desires of your audience. Present our Signs PowerPoint Templates because Our PowerPoint Templates and Slides will provide you a launch platform. Give a lift off to your ideas and send them into orbit. Use our Metaphors-Visual Concepts PowerPoint Templates because You have a driving passion to excel in your field. Our PowerPoint Templates and Slides will prove ideal vehicles for your ideas.Use these PowerPoint slides for presentations relating to business, chart, circle, circular, diagram, economy, finance, framework, graph, isolated, percentage, pie chart, results, scheme, statistics, stats, strategy, success. The prominent colors used in the PowerPoint template are Blue, Green, Blue light.
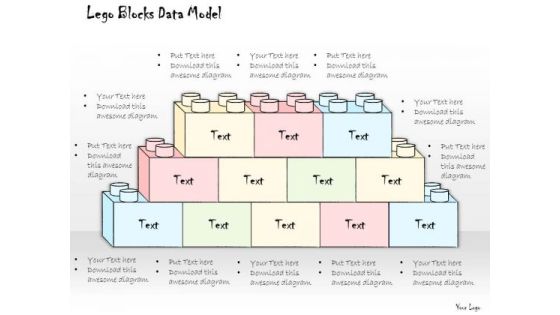
Ppt Slide Lego Blocks Data Model Consulting Firms
Our PPT Slide Lego Blocks Data Model Consulting Firms Powerpoint Templates Enjoy Drama. They Provide Entertaining Backdrops. Our Consulting Firms Powerpoint Templates Help To Make A Draft. They Give You A Good Place To Start.

What Is Big Data Ppt PowerPoint Presentation Styles Background
This is a what is big data ppt powerpoint presentation styles background. This is a one stage process. The stages in this process are big data, data analysis, business, marketing, management.

Business Diagram Business Bar Graph For Data Analysis Presentation Template
This business slide displays pie charts with percentage ratios. This diagram is a data visualization tool that gives you a simple way to present statistical information. This slide helps your audience examines and interprets the data you present.
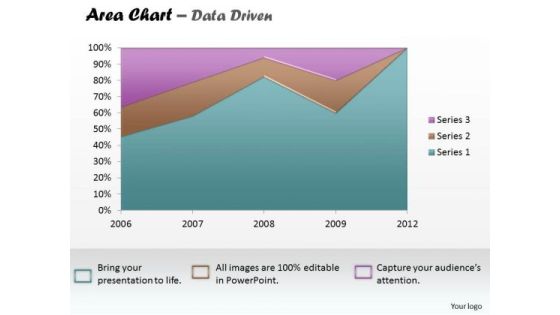
Data Analysis Excel Business Reporting Area Chart PowerPoint Templates
Establish The Dominance Of Your Ideas. Our data analysis excel business reporting area chart Powerpoint Templates Will Put Them On Top.

Analyze Online And Offline Marketing Campaigns Data Graphics PDF
This template covers dashboard to measure and analyze target marketing campaign performance. It also helps in tracking and reporting online and offline marketing campaigns through KPIs such as traffic sources, lead generation metrics, offline product sales, store visitations, customer acquisition, and offline retention and advocacy. If you are looking for a format to display your unique thoughts, then the professionally designed Analyze Online And Offline Marketing Campaigns Data Graphics PDF is the one for you. You can use it as a Google Slides template or a PowerPoint template. Incorporate impressive visuals, symbols, images, and other charts. Modify or reorganize the text boxes as you desire. Experiment with shade schemes and font pairings. Alter, share or cooperate with other people on your work. Download Analyze Online And Offline Marketing Campaigns Data Graphics PDF and find out how to give a successful presentation. Present a perfect display to your team and make your presentation unforgettable.
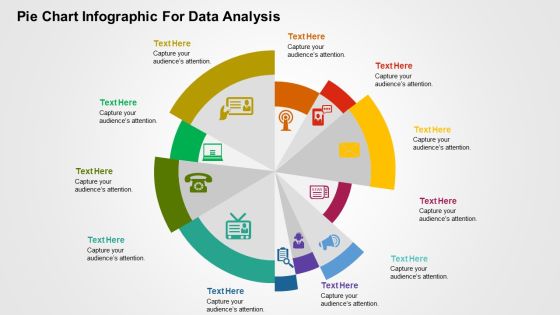
Pie Chart Infographic For Data Analysis PowerPoint Templates
This is one of the most downloaded PowerPoint template. This slide can be used for various purposes and to explain a number of processes. This can be included in your presentation to explain each step of a process and even include its relevance and importance in a single diagram. Using the uneven circular structure of the pie chart, the presenter can also explain random steps or highlight particular steps of process or parts of an organization or business that need special attention of any kind to the audience. Additionally, you can use this slide to show a transformation process or highlight key features of a product.
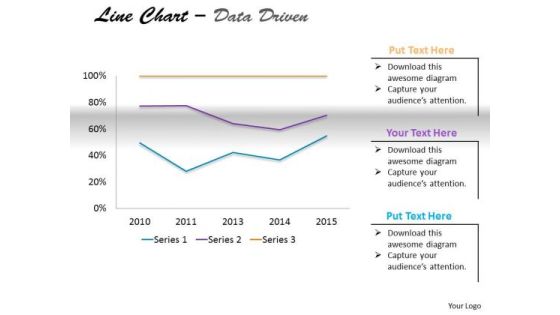
Multivariate Data Analysis Driven Market Line Chart PowerPoint Slides Templates
Delight Them With Our multivariate data analysis driven market line chart powerpoint slides Templates .
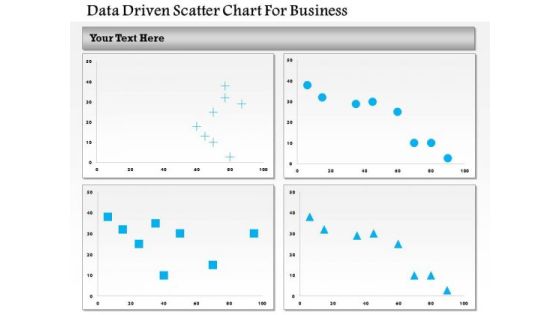
Business Diagram Data Driven Scatter Chart For Business PowerPoint Slide
This business diagram has been designed with four comparative charts. This slide suitable for data representation. You can also use this slide to present business analysis and reports. Use this diagram to present your views in a wonderful manner.

Data Management Analysis Ppt PowerPoint Presentation Complete Deck With Slides
This is a data management analysis ppt powerpoint presentation complete deck with slides. This is a one stage process. The stages in this process are business, data analysis, management, marketing, strategy.
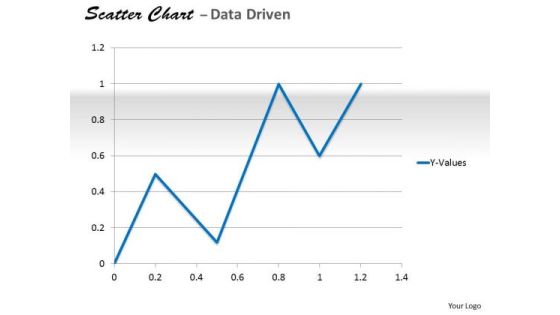
Data Analysis In Excel Analyzing Of Relationship Chart PowerPoint Templates
Delight Them With Our data analysis in excel analyzing of relationship chart Powerpoint Templates .
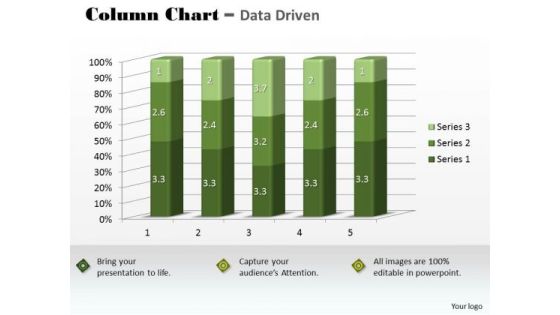
Marketing Data Analysis 3d Statistical Quality Control Chart PowerPoint Templates
Our marketing data analysis 3d statistical quality control chart Powerpoint Templates Abhor Doodling. They Never Let The Interest Flag.
Virtual WAN Architecture SD WAN Network Performance Tracking Dashboard Designs PDF
This slide represents the SD-WAN network performance tracking dashboard. The purpose of this slide is to demonstrate the performance of the SD-WAN network. The main components include control status, site health, transport interface distribution, WAN edge inventory, edge health, and so on. Crafting an eye-catching presentation has never been more straightforward. Let your presentation shine with this tasteful yet straightforward Virtual WAN Architecture SD WAN Network Performance Tracking Dashboard Designs PDF template. It offers a minimalistic and classy look that is great for making a statement. The colors have been employed intelligently to add a bit of playfulness while still remaining professional. Construct the ideal Virtual WAN Architecture SD WAN Network Performance Tracking Dashboard Designs PDF that effortlessly grabs the attention of your audience Begin now and be certain to wow your customers.
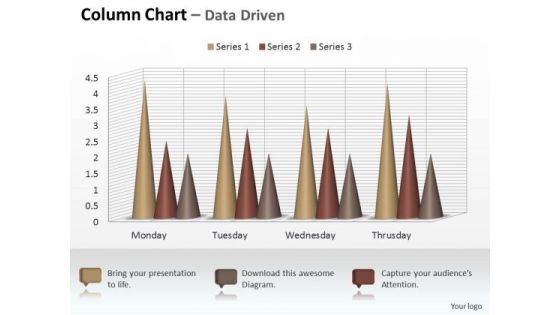
Marketing Data Analysis 3d Sets Of Column Chart PowerPoint Templates
Your Listeners Will Never Doodle. Our marketing data analysis 3d sets of column chart Powerpoint Templates Will Hold Their Concentration.
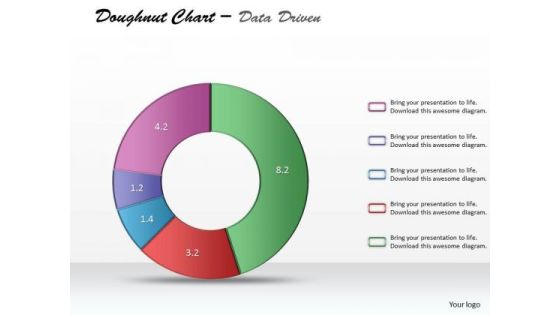
Data Analysis Excel Categorical Statistics Doughnut Chart PowerPoint Templates
Establish Your Dominion With Our data analysis excel categorical statistics doughnut chart Powerpoint Templates. Rule The Stage With Your Thoughts.

Business Data Analysis Chart For Project PowerPoint Templates
Document Your Views On Our business data analysis chart for project Powerpoint Templates. They Will Create A Strong Impression.
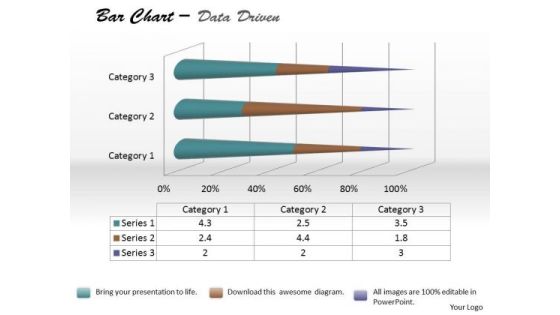
Data Analysis Bar Chart For Foreign Trade PowerPoint Templates
Be The Doer With Our data analysis bar chart for foreign trade Powerpoint Templates. Put Your Thoughts Into Practice.

Data Analysis Excel Business Tool Scatter Chart PowerPoint Templates
Dominate Proceedings With Your Ideas. Our data analysis excel business tool scatter chart Powerpoint Templates Will Empower Your Thoughts.

Data Analysis Techniques 3d Grouped Bar Chart PowerPoint Templates
Place The Orders With Your Thoughts. Our data analysis techniques 3d grouped bar chart Powerpoint Templates Know The Drill.
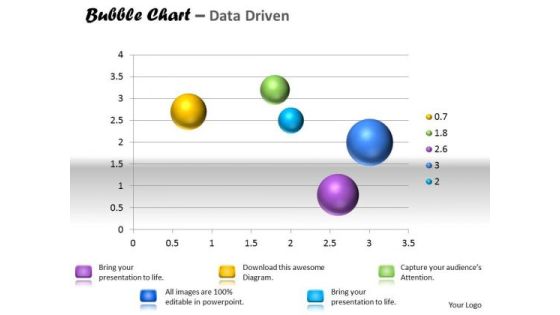
Data Analysis Template Interactive Bubble Chart PowerPoint Templates
Our data analysis template interactive bubble chart Powerpoint Templates Are A Wonder Drug. They Help Cure Almost Any Malaise.
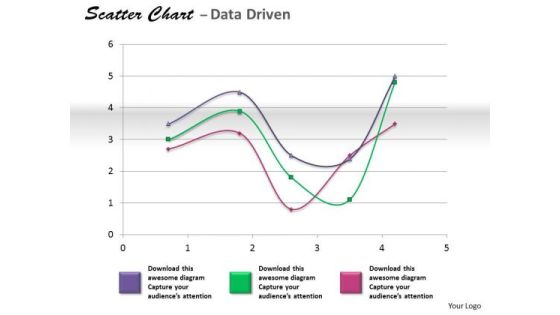
Financial Data Analysis Coordinate With Scatter Chart PowerPoint Templates
Get The Doers Into Action. Activate Them With Our financial data analysis coordinate with scatter chart Powerpoint Templates .
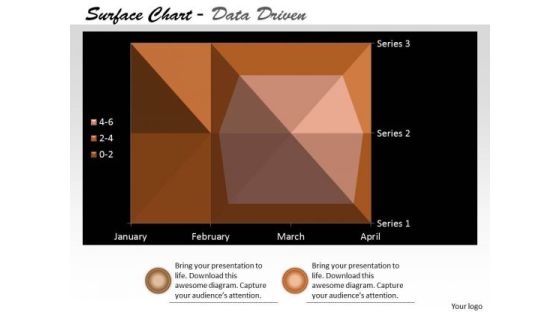
Multivariate Data Analysis Surface Chart Plots Trends PowerPoint Templates
Our multivariate data analysis surface chart plots trends Powerpoint Templates Heighten Concentration. Your Audience Will Be On The Edge.
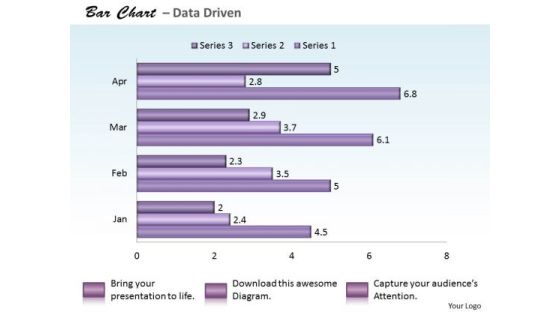
Quantitative Data Analysis Bar Chart For PowerPoint Templates
Reduce The Drag With Our quantitative data analysis bar chart for Powerpoint Templates . Give More Lift To Your Thoughts.

Data Analysis Techniques 3d Effective Display Chart PowerPoint Templates
Dribble Away With Our data analysis techniques 3d effective display chart Powerpoint Templates . Score A Goal With Your Ideas.
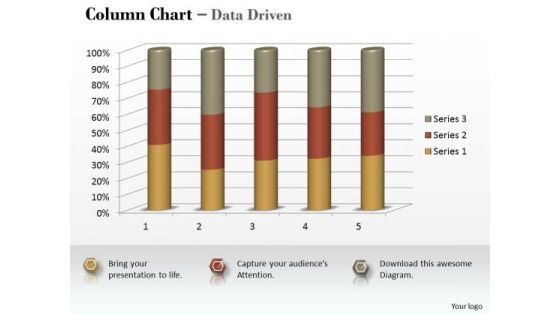
Marketing Data Analysis 3d Statistical Process Column Chart PowerPoint Templates
Be A Donor Of Great Ideas. Display Your Charity On Our marketing data analysis 3d statistical process column chart Powerpoint Templates .

Marketing Data Analysis 3d Statistical Process Control Chart PowerPoint Templates
Open Up Doors That Lead To Success. Our marketing data analysis 3d statistical process control chart Powerpoint Templates Provide The Handles.

Data Analysis In Excel Completion Project Management PowerPoint Templates
Touch Base With Our data analysis in excel completion project management Powerpoint Templates . Review Your Growth With Your Audience.

Data Analysis Template Forex Market Bar Chart PowerPoint Templates
Attract A Crowd With Our data analysis template forex market bar chart Powerpoint Templates . They Will Drop It All And Come To Hear You.

Examples Of Data Analysis Market 3d Categories Sets PowerPoint Templates
Our examples of data analysis market 3d categories sets Powerpoint Templates Give Your Thoughts Their Due. They Project Them With Full Intensity.
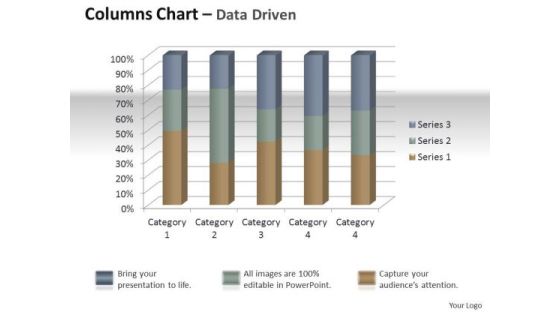
Marketing Data Analysis 3d Quality Control Of Units PowerPoint Templates
Establish Your Dominion With Our marketing data analysis 3d quality control of units Powerpoint Templates . Rule The Stage With Your Thoughts.

Quantitative Data Analysis Bar Chart For Financial Markets PowerPoint Templates
Draft It Out On Our quantitative data analysis bar chart for financial markets Powerpoint Templates . Give The Final Touches With Your Ideas.

Business Data Analytics Process Ppt PowerPoint Presentation Layout
This is a business data analytics process ppt powerpoint presentation layout. This is a four stage process. The stages in this process are decision, data, insight, info.
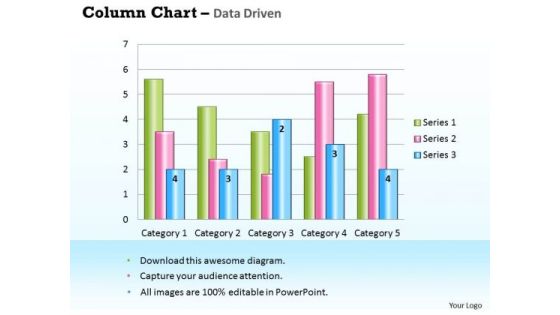
Business Data Analysis Chart For Case Studies PowerPoint Templates
Get Out Of The Dock With Our business data analysis chart for case studies Powerpoint Templates. Your Mind Will Be Set Free.
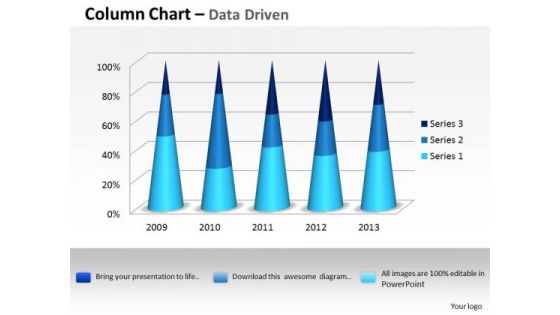
Data Analysis Excel 3d Process Variation Column Chart PowerPoint Templates
Put In A Dollop Of Our data analysis excel 3d process variation column chart Powerpoint Templates. Give Your Thoughts A Distinctive Flavor.
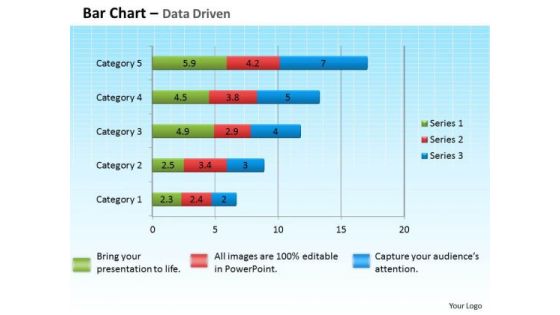
Data Analysis Excel Bar Graph To Compare PowerPoint Templates
Get The Domestics Right With Our data analysis excel bar graph to compare Powerpoint Templates. Create The Base For Thoughts To Grow.

Data Analysis Excel Bubble Chart For Business Tasks PowerPoint Templates
Doll Up Your Thoughts With Our data analysis excel bubble chart for business tasks Powerpoint Templates. They Will Make A Pretty Picture.

Data Analysis In Excel 3d Classification Of Chart PowerPoint Templates
With Our data analysis in excel 3d classification of chart Powerpoint Templates You Will Be Doubly Sure. They Possess That Stamp Of Authority.
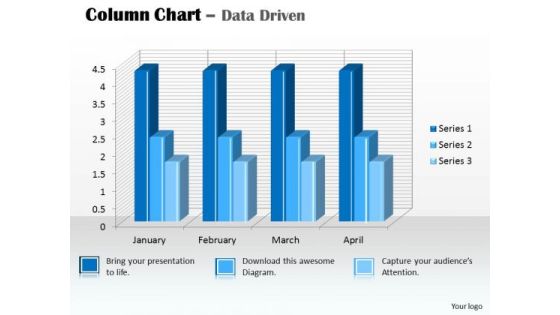
Data Analysis In Excel 3d Column Chart For PowerPoint Templates
Our data analysis in excel 3d column chart for Powerpoint Templates And Your Ideas Make A Great Doubles Pair. Play The Net With Assured Hands.

Data Analysis In Excel Of Stock Chart PowerPoint Templates
Plan Your Storyboard With Our data analysis in excel of stock chart Powerpoint Templates . Give An Outline To The Solutions You Have.

Data Analysis Programs 3d Bar Chart To Dispaly PowerPoint Templates
Lower The Drawbridge With Our data analysis programs 3d bar chart to dispaly Powerpoint Templates . Capture The Minds Of Your Audience.
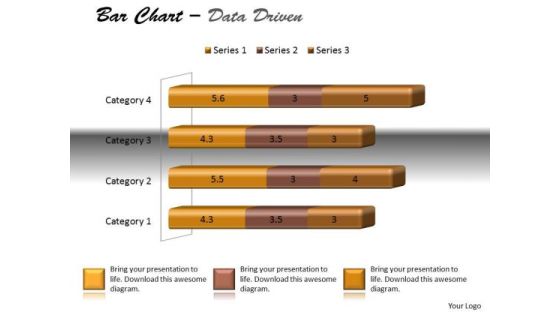
Data Analysis Techniques 3d Bar Chart For Modification PowerPoint Templates
Dreams Generate Thoughts, Thoughts Generate Ideas. Give Them Life With Our data analysis techniques 3d bar chart for modification Powerpoint Templates .
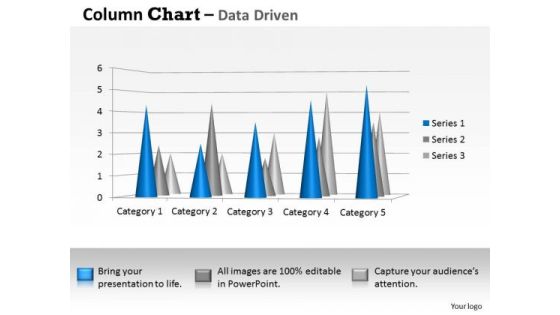
Data Analysis Techniques 3d Distribution Of In Sets PowerPoint Templates
Your Thoughts Will Be The Main Course. Provide The Dressing With Our data analysis techniques 3d distribution of in sets Powerpoint Templates .

Data Analysis Techniques 3d Graphical Presentation Of PowerPoint Templates
Our data analysis techniques 3d graphical presentation of Powerpoint Templates Will Follow The Drill. They Accomplish The Task Assigned To Them.

Data Analysis Techniques 3d In Segments Pie Chart PowerPoint Templates
Drink To The Success Of Your Campaign. Our data analysis techniques 3d in segments pie chart Powerpoint Templates Will Raise A Toast.

Data Analysis Template Driven Visualization Area Chart PowerPoint Slides Templates
Draw On The Energy Of Our data analysis template driven visualization area chart powerpoint slides Templates . Your Thoughts Will Perk Up.

Financial Data Analysis Area Chart For Showing Trends PowerPoint Templates
Document Your Views On Our financial data analysis area chart for showing trends Powerpoint Templates . They Will Create A Strong Impression.
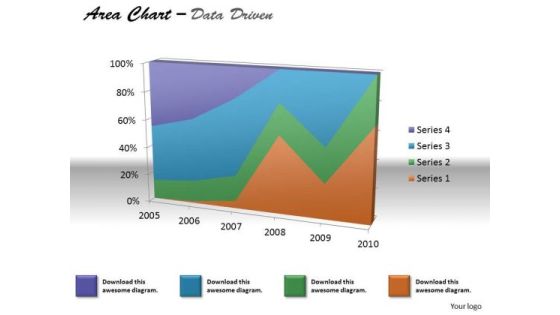
Financial Data Analysis Area Chart For Various Values PowerPoint Templates
Document The Process On Our financial data analysis area chart for various values Powerpoint Templates . Make A Record Of Every Detail.
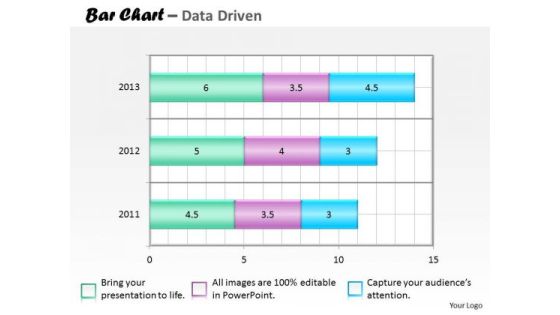
Financial Data Analysis Bar Chart For Collection Of PowerPoint Templates
Our financial data analysis bar chart for collection of Powerpoint Templates Team Are A Dogged Lot. They Keep At It Till They Get It Right.

Financial Data Analysis Currency Trading Bar Chart PowerPoint Templates
Put In A Dollop Of Our financial data analysis currency trading bar chart Powerpoint Templates . Give Your Thoughts A Distinctive Flavor.
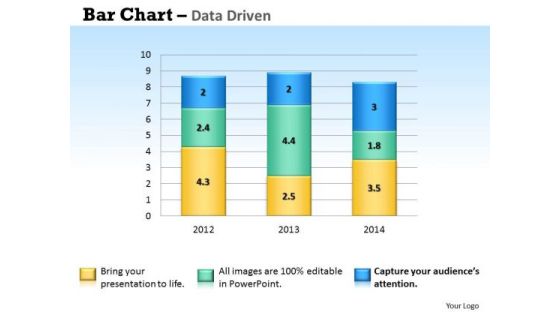
Microsoft Excel Data Analysis Bar Chart To Handle PowerPoint Templates
Our microsoft excel data analysis bar chart to handle Powerpoint Templates And Your Ideas Make A Great Doubles Pair. Play The Net With Assured Hands.

Microsoft Excel Data Analysis Bar Graph PowerPoint Templates
Double The Impact With Our microsoft excel data analysis bar graph Powerpoint Templates . Your Thoughts Will Have An Imposing Effect.

Multivariate Data Analysis Numeric Values Surface Chart PowerPoint Templates
Your Grasp Of Economics Is Well Known. Help Your Audience Comprehend Issues With Our multivariate data analysis numeric values surface chart Powerpoint Templates .
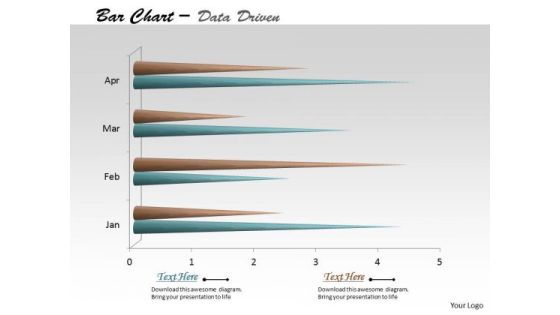
Multivariate Data Analysis Time Based Bar Chart PowerPoint Templates
Edit Your Work With Our multivariate data analysis time based bar chart Powerpoint Templates . They Will Help You Give The Final Form.
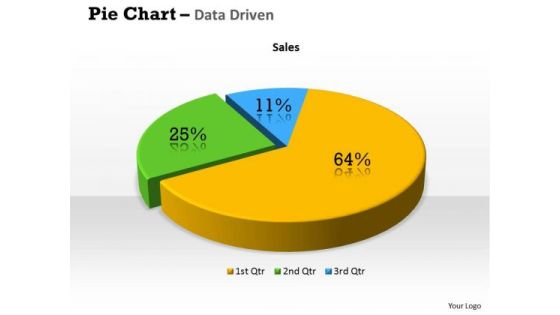
Quantitative Data Analysis 3d Percentage Ratio Pie Chart PowerPoint Templates
Plan Your Storyboard With Our quantitative data analysis 3d percentage ratio pie chart Powerpoint Templates . Give An Outline To The Solutions You Have.

Quantitative Data Analysis Bar Chart For Different Categories PowerPoint Templates
Make Some Dough With Our quantitative data analysis bar chart for different categories Powerpoint Templates . Your Assets Will Rise Significantly.
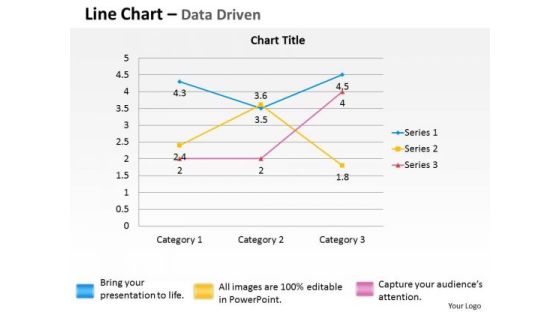
Quantitative Data Analysis Driven Economic Line Chart PowerPoint Slides Templates
Break The Deadlock With Our quantitative data analysis driven economic line chart powerpoint slides Templates . Let The Words Start To Flow.

Design For Data Analysis And Strategy Planning Powerpoint Templates
This business slide has backdrop of chess game with six zigzag steps. You may download this slide for data analysis and strategy planning related topics. Illustrate your plans to your listeners with using this slide.
Visual Representation Of Data Ppt PowerPoint Presentation Icon Sample
Presenting this set of slides with name visual representation of data ppt powerpoint presentation icon sample. This is a one stage process. The stages in this process are data visualization icon, research analysis, business focus. This is a completely editable PowerPoint presentation and is available for immediate download. Download now and impress your audience.

Data Representation Vector Icon Ppt PowerPoint Presentation Infographic Template Samples
Presenting this set of slides with name data representation vector icon ppt powerpoint presentation infographic template samples. This is a one stage process. The stages in this process are data visualization icon, research analysis, business focus. This is a completely editable PowerPoint presentation and is available for immediate download. Download now and impress your audience.

Business Data Analysis Chart Comparing Multiple Entities PowerPoint Templates
Analyze Ailments On Our business data analysis chart comparing multiple entities Powerpoint Templates. Bring Out The Thinking Doctor In You. Dock Your Thoughts With Our Financial Analysis . They Will Launch Them Into Orbit.

Business Diagram Flask With Data Driven Chart PowerPoint Slide
This data driven diagram has been designed with flask graphics. Download this diagram to give your presentations more effective look. It helps in clearly conveying your message to clients and audience.

Business Diagram Laptop With Data Driven Area Chart PowerPoint Slide
This diagram has been designed with laptop and data driven area chart. Download this diagram to give your presentations more effective look. It helps in clearly conveying your message to clients and audience.

Price Benefit Internet Things Digital Twins Execution After Covid Healthcare Dashboard Designs PDF
This slide shows the healthcare dashboard that presents analytical data such as occupancy, patient turnover, efficiency and costs, satisfaction and service indicators. Deliver an awe inspiring pitch with this creative price benefit internet things digital twins execution after covid healthcare dashboard designs pdf bundle. Topics like healthcare dashboard showing analytical data can be discussed with this completely editable template. It is available for immediate download depending on the needs and requirements of the user.
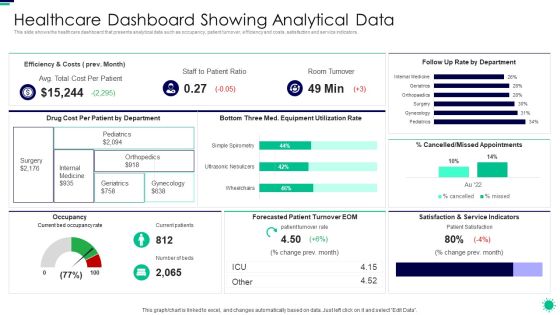
Purpose Digital Twin Internet Things Reducing Costs After COVID Era Healthcare Dashboard Showing Inspiration PDF
This slide shows the healthcare dashboard that presents analytical data such as occupancy, patient turnover, efficiency and costs, satisfaction and service indicators. Deliver an awe inspiring pitch with this creative purpose digital twin internet things reducing costs after covid era healthcare dashboard showing inspiration pdf bundle. Topics like healthcare dashboard showing analytical data can be discussed with this completely editable template. It is available for immediate download depending on the needs and requirements of the user.
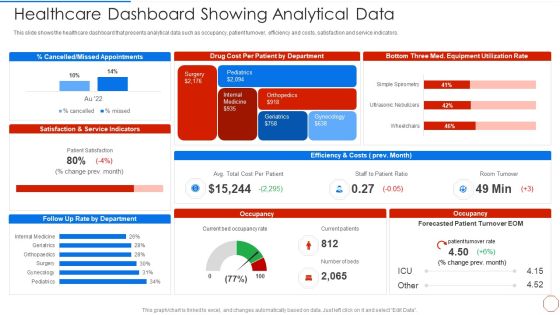
Minimizing Operational Cost Through Iot Virtual Twins Implementation Healthcare Dashboard Showing Sample PDF
This slide shows the healthcare dashboard that presents analytical data such as occupancy, patient turnover, efficiency and costs, satisfaction and service indicators. Deliver an awe inspiring pitch with this creative minimizing operational cost through iot virtual twins implementation healthcare dashboard showing sample pdf bundle. Topics like healthcare dashboard showing analytical data can be discussed with this completely editable template. It is available for immediate download depending on the needs and requirements of the user.

Data Collection Checklist Checksheet Ppt PowerPoint Presentation File Example File
This is a data collection checklist checksheet ppt powerpoint presentation file example file. This is a four stage process. The stages in this process are areas of assessment for think tank evaluation, table, data analysis, management.

Social Media Big Data Facts Ppt PowerPoint Presentation Visuals
This is a social media big data facts ppt powerpoint presentation visuals. This is a eight stage process. The stages in this process are search queries, of data, tweets, new emails are generated, transactions.

Big Data Analytics Process Flow Ppt PowerPoint Presentation Diagrams
This is a big data analytics process flow ppt powerpoint presentation diagrams. This is a four stage process. The stages in this process are data, decision, insight, info.

Big Data Information Sources Ppt PowerPoint Presentation Slides
This is a big data information sources ppt powerpoint presentation slides. This is a four stage process. The stages in this process are media, social, machine, historical.

Data And Analytics Playbook Purpose Of This Playbook Background PDF
Presenting Data And Analytics Playbook Purpose Of This Playbook Background PDF to provide visual cues and insights. Share and navigate important information on three stages that need your due attention. This template can be used to pitch topics like Upgrade Analytics, Business Intelligence Programs, Next Generation Search, Dashboards And Report. In addtion, this PPT design contains high resolution images, graphics, etc, that are easily editable and available for immediate download.

Big Data Solutions For Enterprises Ppt PowerPoint Presentation Layouts
This is a big data solutions for enterprises ppt powerpoint presentation layouts. This is a four stage process. The stages in this process are media, social, machine, historical.

Data Transfer Governance Vector Icon Ppt PowerPoint Presentation Infographics Tips
Presenting this set of slides with name data transfer governance vector icon ppt powerpoint presentation infographics tips. This is a one stage process. The stages in this process are data sources, database management, marketing. This is a completely editable PowerPoint presentation and is available for immediate download. Download now and impress your audience.
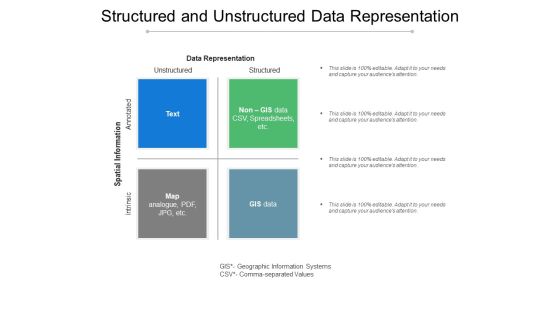
Structured And Unstructured Data Representation Ppt PowerPoint Presentation Styles Gridlines
Presenting this set of slides with name structured and unstructured data representation ppt powerpoint presentation styles gridlines. This is a four stage process. The stages in this process are data sources, database management, marketing. This is a completely editable PowerPoint presentation and is available for immediate download. Download now and impress your audience.

Big Data Sources And Concept Ppt PowerPoint Presentation Ideas
This is a big data sources and concept ppt powerpoint presentation ideas. This is a eight stage process. The stages in this process are images and media, database, locations, email, sensors.

Data Center Multi Tier Architecture Model Ppt Infographics Model PDF
This slid e illustrates a multi-tier client-server architecture model in which it splits data access across more than one server. the essential model layers include core, aggregation and access layer. Persuade your audience using this Data Center Multi Tier Architecture Model Ppt Infographics Model PDF. This PPT design covers three stages, thus making it a great tool to use. It also caters to a variety of topics including Data Center, Core Layer, Datacenter Aggregation Layer, Data Center, Access Layer. Download this PPT design now to present a convincing pitch that not only emphasizes the topic but also showcases your presentation skills.

Data And Analysis Ppt PowerPoint Presentation Portfolio Layouts
This is a data and analysis ppt powerpoint presentation portfolio layouts. This is a six stage process. The stages in this process are root cause analysis, opportunity analysis, timeline analysis, force field analysis, fmea analysis.

Data Collection And Analysis Control Chart Ppt PowerPoint Presentation Visuals
This is a data collection and analysis control chart ppt powerpoint presentation visuals. This is a ten stage process. The stages in this process are upper limit, centerline, lower limit, plotted points.

Operation Cloud Data Repository Architecture With Applications Download PDF
Presenting operation cloud data repository architecture with applications download pdf to dispense important information. This template comprises four stages. It also presents valuable insights into the topics including data sources, applications, long lived prod cluster, temporary dev or test cluster. This is a completely customizable PowerPoint theme that can be put to use immediately. So, download it and address the topic impactfully.

Data Integration Maturity Framework Icon Ppt Portfolio Professional PDF
Presenting Data Integration Maturity Framework Icon Ppt Portfolio Professional PDF to dispense important information. This template comprises three stages. It also presents valuable insights into the topics including Data Integration, Maturity Framework, Icon. This is a completely customizable PowerPoint theme that can be put to use immediately. So, download it and address the topic impactfully.

Data Collection Checklist Checksheet Ppt PowerPoint Presentation Styles
This is a data collection checklist checksheet ppt powerpoint presentation styles. This is a ten stage process. The stages in this process are areas of assessment for think tank evaluation, business, strategy, marketing.

Impact Of Big Data In World Ppt PowerPoint Presentation Inspiration
This is a impact of big data in world ppt powerpoint presentation inspiration. This is a four stage process. The stages in this process are healthcare, science, security, business.

3 Vs Of Big Data Ppt PowerPoint Presentation Slides Samples
This is a 3 vs of big data ppt powerpoint presentation slides samples. This is a three stage process. The stages in this process are volume, variety, velocity, terabytes, transactions.
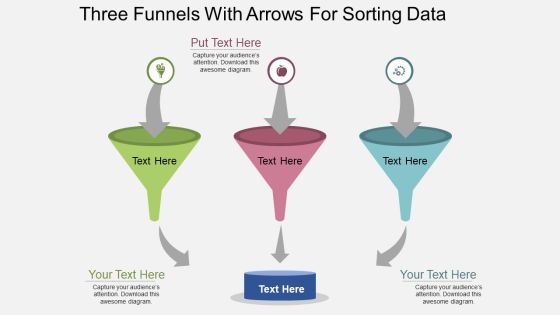
Three Funnels With Arrows For Sorting Data Powerpoint Template
Communicate with your group through this slide of three funnels. Download this PowerPoint template to exhibit management tools. This PPT slide design will facilitate understanding of your views.

Decision Support System Data Warehouse Is Integrated Ppt Influencers PDF
This slide depicts the integrated feature of the data warehouse and how different subjects are stored within one place in the data warehouse. Presenting Decision Support System Data Warehouse Is Integrated Ppt Influencers PDF to provide visual cues and insights. Share and navigate important information on three stages that need your due attention. This template can be used to pitch topics like Sales Account, Purchase Account, Raw Material Account. In addtion, this PPT design contains high resolution images, graphics, etc, that are easily editable and available for immediate download.
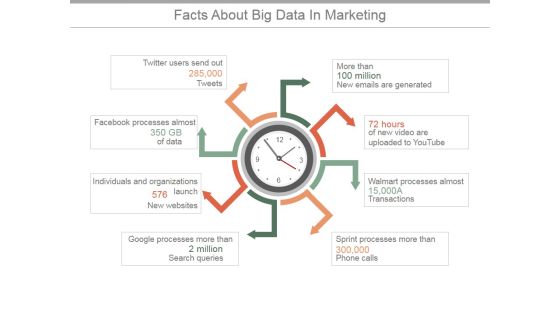
Facts About Big Data In Marketing Ppt PowerPoint Presentation Clipart
This is a facts about big data in marketing ppt powerpoint presentation clipart. This is a eight stage process. The stages in this process are arrow, process, business, marketing, success.

Stream Processing Dashboard With Incidents Status Ppt PowerPoint Presentation Gallery Portrait PDF
The following slide outlines a KPI dashboard of data ingestion. The dashboard covers key metrics such as incidents by category and severity, contributing cause, root cause, incident trends and status, etc. Showcasing this set of slides titled Stream Processing Dashboard With Incidents Status Ppt PowerPoint Presentation Gallery Portrait PDF. The topics addressed in these templates are Incidens, Category And Severity, Incidents By Facility, Contributing Cause. All the content presented in this PPT design is completely editable. Download it and make adjustments in color, background, font etc. as per your unique business setting.

Data Analyst Presenting Business Statistical Report Vector Icon Topics PDF
Presenting data analyst presenting business statistical report vector icon topics pdf to dispense important information. This template comprises three stages. It also presents valuable insights into the topics including data analyst presenting business statistical report vector icon. This is a completely customizable PowerPoint theme that can be put to use immediately. So, download it and address the topic impactfully.

Financial Enterprise Data Governance Plan Ppt Icon Visuals PDF
This slide showcases an ideal structure to utilize data within the organization to ensure security and reliability of data in enterprises according to the data usage policies and standards. The key strategies include identify data source, define data, standardize data and data handling. Persuade your audience using this Financial Enterprise Data Governance Plan Ppt Icon Visuals PDF. This PPT design covers four stages, thus making it a great tool to use. It also caters to a variety of topics including Identify Data Source, Define Data, Standardize Data, Data Handling. Download this PPT design now to present a convincing pitch that not only emphasizes the topic but also showcases your presentation skills.

Key Steps To Develop Effective Data Analytics Infrastructure Inspiration PDF
This slide includes key steps for developing a data analytics ecosystem aimed at improving innovation and customer experience. These steps include understand data ecosystem, collect data, store data, process data, and utilise data. Presenting Key Steps To Develop Effective Data Analytics Infrastructure Inspiration PDF to dispense important information. This template comprises five stages. It also presents valuable insights into the topics including Understand Data Ecosystem, Collect Data, Store Data, Process Data, Utilise Data. This is a completely customizable PowerPoint theme that can be put to use immediately. So, download it and address the topic impactfully.

Big Data Analytics Engineering Procedure Framework Brochure PDF
This slide showcase big data analytics processes of collecting, processing, cleansing, and analyzing datasets. It includes elements such as data sources, data pipeline, data storage, processing and data analysis Showcasing this set of slides titled Big Data Analytics Engineering Procedure Framework Brochure PDF. The topics addressed in these templates are Data Sources, Data Pipeline, Data Storage. All the content presented in this PPT design is completely editable. Download it and make adjustments in color, background, font etc. as per your unique business setting.
RACI Matrix For Data Analytics Ppt Icon Gridlines PDF
This slide represents the RACI matrix for data science and tasks performed by data analysts, data engineers, data scientists, data architects, and business analysts. Deliver and pitch your topic in the best possible manner with this raci matrix for data analytics ppt icon gridlines pdf. Use them to share invaluable insights on data cleaning, data collection, exploratory analysis, final analysis and impress your audience. This template can be altered and modified as per your expectations. So, grab it now.

Cloud Computing Data Performance Gap Analysis Icon Microsoft PDF
Persuade your audience using this Cloud Computing Data Performance Gap Analysis Icon Microsoft PDF. This PPT design covers three stages, thus making it a great tool to use. It also caters to a variety of topics including Cloud Computing Data, Performance Gap Analysis Icon. Download this PPT design now to present a convincing pitch that not only emphasizes the topic but also showcases your presentation skills.
Internal And External Data Sources Icon Infographics PDF
Persuade your audience using this Internal And External Data Sources Icon Infographics PDF . This PPT design covers Four stages, thus making it a great tool to use. It also caters to a variety of topics including Internal And External, Data Sources. Download this PPT design now to present a convincing pitch that not only emphasizes the topic but also showcases your presentation skills.

Data Analytics Software Features Business Analysis Modification Toolkit Formats PDF
This slide represents the key features of predictive data analytics including data mining, data visualization, and modelling etc.Presenting Data Analytics Software Features Business Analysis Modification Toolkit Formats PDF to provide visual cues and insights. Share and navigate important information on eight stages that need your due attention. This template can be used to pitch topics like Predictive Modeling, Data Unification, Data Visualization. In addtion, this PPT design contains high resolution images, graphics, etc, that are easily editable and available for immediate download.

Data Analytics Vector Icon Ppt Powerpoint Presentation Icon Designs
This is a data analytics vector icon ppt powerpoint presentation icon designs. This is a four stage process. The stages in this process are data visualization icon, data management icon.
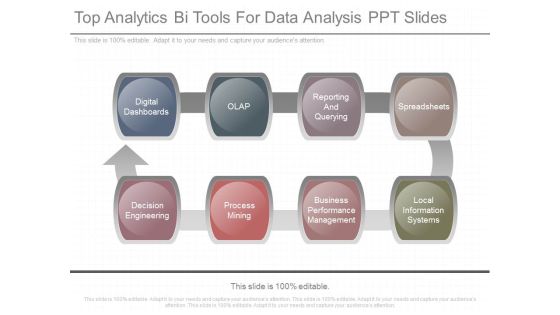
Top Analytics Bi Tools For Data Analysis Ppt Slides
This is a top analytics bi tools for data analysis ppt slides. This is a eight stage process. The stages in this process are digital dashboards, olap, reporting and querying, spreadsheets, decision engineering, process mining, business performance management, local information systems.
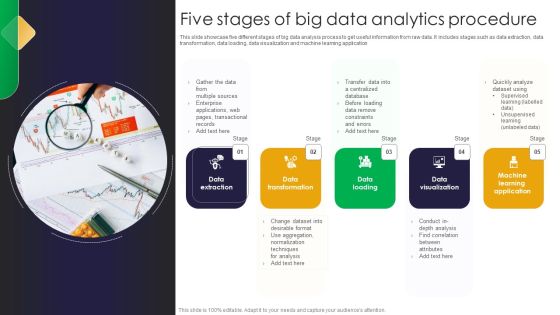
Five Stages Of Big Data Analytics Procedure Brochure PDF
This slide showcase five different stages of big data analysis process to get useful information from raw data. It includes stages such as data extraction, data transformation, data loading, data visualization and machine learning application Persuade your audience using this Five Stages Of Big Data Analytics Procedure Brochure PDF. This PPT design covers six stages, thus making it a great tool to use. It also caters to a variety of topics including Data Extraction, Data Transformation, Data Loading. Download this PPT design now to present a convincing pitch that not only emphasizes the topic but also showcases your presentation skills.
Magnifying Glass Data Analysis Ppt PowerPoint Presentation Styles Images
Presenting this set of slides with name magnifying glass data analysis ppt powerpoint presentation styles images. This is a four stage process. The stages in this process are technology, marketing, planning, business, management. This is a completely editable PowerPoint presentation and is available for immediate download. Download now and impress your audience.
Magnifier Glass Data Analysis Ppt PowerPoint Presentation Model Elements
Presenting this set of slides with name magnifier glass data analysis ppt powerpoint presentation model elements. This is a five stage process. The stages in this process are technology, marketing, planning, business, management. This is a completely editable PowerPoint presentation and is available for immediate download. Download now and impress your audience.

Magnifying Glass Big Data Analysis Ppt PowerPoint Presentation Diagram Templates
Presenting this set of slides with name magnifying glass big data analysis ppt powerpoint presentation diagram templates. This is a four stage process. The stages in this process are technology, marketing, planning, business, management. This is a completely editable PowerPoint presentation and is available for immediate download. Download now and impress your audience.
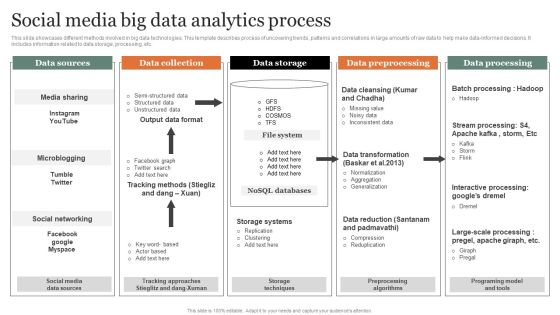
Social Media Big Data Analytics Process Diagrams PDF
This slide showcases different methods involved in big data technologies. This template describes process of uncovering trends, patterns and correlations in large amounts of raw data to help make data informed decisions. It includes information related to data storage, processing, etc. Showcasing this set of slides titled Social Media Big Data Analytics Process Diagrams PDF Microsoft. The topics addressed in these templates are Data Collection, Data Storage, Data Preprocessing. All the content presented in this PPT design is completely editable. Download it and make adjustments in color, background, font etc. as per your unique business setting.

Big Data Analytics Process Flow Chart Topics PDF
Following slide provides big data handing flow chart which can be used by business to increase business productivity. It includes steps such as raw data collection, data processing, data validation, error free data storage, data filtration, etc. Showcasing this set of slides titled Big Data Analytics Process Flow Chart Topics PDF. The topics addressed in these templates are Conduct Data, Information, Evaluation. All the content presented in this PPT design is completely editable. Download it and make adjustments in color, background, font etc. as per your unique business setting.

Data Analytics Infrastructure Architecture To Improve Business Processes Formats PDF
This slide illustrates a data ecosystem that provides considerable output to the organization aimed at analyzing consumer behaviour. It includes elements such as big data storage, big data processing, data science, business intelligence systems, etc. Pitch your topic with ease and precision using this Data Analytics Infrastructure Architecture To Improve Business Processes Formats PDF. This layout presents information on Big Data Storage, Big Data Processing, Business Intelligence Systems, Data Science, User Interface. It is also available for immediate download and adjustment. So, changes can be made in the color, design, graphics or any other component to create a unique layout.

Big Data Analytics Procedure For Management Accounting Formats PDF
This slide illustrate big data analysis process for management accounting to generate financial reports for decision making. It includes elements such as cost accounting balance scorecards, performance measurement etc. Showcasing this set of slides titled Big Data Analytics Procedure For Management Accounting Formats PDF. The topics addressed in these templates are Accounting, Internal Data, Social Media. All the content presented in this PPT design is completely editable. Download it and make adjustments in color, background, font etc. as per your unique business setting.
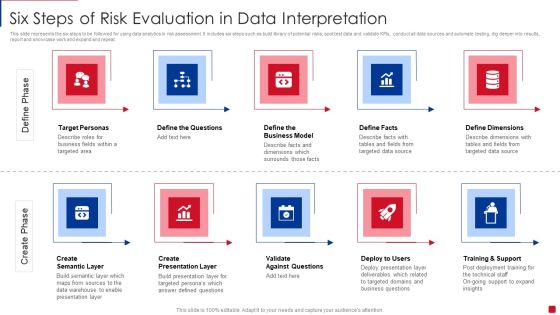
Six Steps Of Risk Evaluation In Data Interpretation Introduction PDF
This slide represents the six steps to be followed for using data analytics in risk assessment. It includes six steps such as build library of potential risks, spot test data and validate KPIs, conduct all data sources and automate testing, dig deeper into results, report and showcase work and expand and repeat. Persuade your audience using this Six Steps Of Risk Evaluation In Data Interpretation Introduction PDF. This PPT design covers six stages, thus making it a great tool to use. It also caters to a variety of topics including Expand And Repeat, Report Showcase Work, Potential Risks. Download this PPT design now to present a convincing pitch that not only emphasizes the topic but also showcases your presentation skills.

Procedure To Analysis Value From Big Data Analytics Microsoft PDF
This slide showcase process to extract information and useful insights using big data analytics for decision making. It includes elements such as data cleaning and processing, explore and visualize data, data mining, model building etc. Presenting Procedure To Analysis Value From Big Data Analytics Microsoft PDF to dispense important information. This template comprises five stages. It also presents valuable insights into the topics including Data Analysis Process, Processing, Data Mining, Optimize Result. This is a completely customizable PowerPoint theme that can be put to use immediately. So, download it and address the topic impactfully.

Data Analytics Process Ppt PowerPoint Presentation Background Designs
This is a data analytics process ppt powerpoint presentation background designs. This is a four stage process. The stages in this process are data, decision, insight, info.
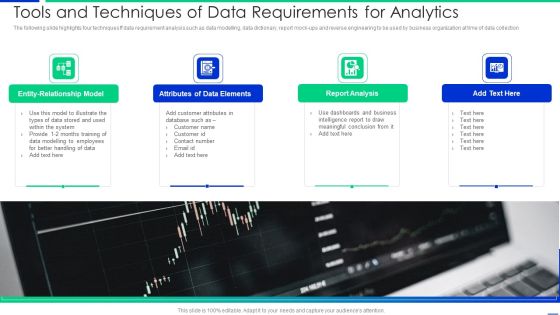
Tools And Techniques Of Data Requirements For Analytics Mockup PDF
The following slide highlights four techniques ff data requirement analysis such as data modelling, data dictionary, report mock-ups and reverse engineering to be used by business organization at time of data collection Presenting tools and techniques of data requirements for analytics mockup pdf to dispense important information. This template comprises four stages. It also presents valuable insights into the topics including system, customer, database. This is a completely customizable PowerPoint theme that can be put to use immediately. So, download it and address the topic impactfully.
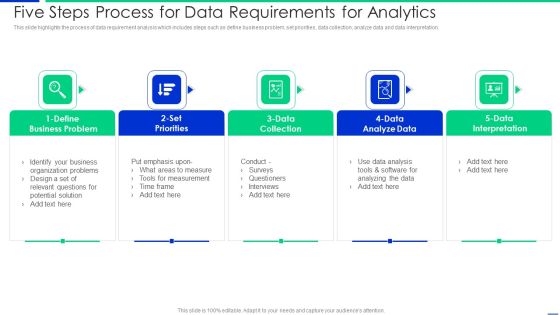
Five Steps Process For Data Requirements For Analytics Rules PDF
This slide highlights the process of data requirement analysis which includes steps such as define business problem, set priorities, data collection, analyze data and data interpretation. Presenting five steps process for data requirements for analytics rules pdf to dispense important information. This template comprises five stages. It also presents valuable insights into the topics including surveys, data analysis, interpretation. This is a completely customizable PowerPoint theme that can be put to use immediately. So, download it and address the topic impactfully.

Components Of Big Data Analytics And Integration Infrastructure Elements PDF
This slide showcase data integration ecosystem components for big data analytics to deal with the diverse demands of the workplace. These components include a data discovery platform, big data storage, business intelligence portfolio, analysis portfolio, etc. Showcasing this set of slides titled Components Of Big Data Analytics And Integration Infrastructure Elements PDF. The topics addressed in these templates are Data Discovery Platform, Enterprise Data Worehouse, Business Intelligence Portfolio, Analysis Portfolio. All the content presented in this PPT design is completely editable. Download it and make adjustments in color, background, font etc. as per your unique business setting.
 Home
Home