AI PPT Maker
Templates
PPT Bundles
Design Services
Business PPTs
Business Plan
Management
Strategy
Introduction PPT
Roadmap
Self Introduction
Timelines
Process
Marketing
Agenda
Technology
Medical
Startup Business Plan
Cyber Security
Dashboards
SWOT
Proposals
Education
Pitch Deck
Digital Marketing
KPIs
Project Management
Product Management
Artificial Intelligence
Target Market
Communication
Supply Chain
Google Slides
Research Services
 One Pagers
All Categories
-
Home
- Customer Favorites
- Data Dashboard
Data Dashboard

Financial Projections Balance Sheet Ppt PowerPoint Presentation Gallery Show
This is a financial projections balance sheet ppt powerpoint presentation gallery show. This is a two stage process. The stages in this process are non current liabilities, short term borrowings, trade payables, inventories, trade receivables.

Financial Projections Income Statement Ppt PowerPoint Presentation Inspiration Vector
This is a financial projections income statement ppt powerpoint presentation inspiration vector. This is a four stage process. The stages in this process are net sales, expenses, cost of goods sold, employee benefit expense, financing cost.

Funding Updates Equity Ppt PowerPoint Presentation Ideas Slide Download
This is a funding updates equity ppt powerpoint presentation ideas slide download. This is a two stage process. The stages in this process are shareholder name, shareholding pattern, total shares, percentage.

Project Health Card Ppt PowerPoint Presentation Summary Example
This is a project health card ppt powerpoint presentation summary example. This is a seven stage process. The stages in this process are development complete, testing complete, planning for change, milestones and key dates, task meter.

Facts Assessment BI Applications Reporting Ppt PowerPoint Presentation Model Example PDF
Presenting this set of slides with name facts assessment bi applications reporting ppt powerpoint presentation model example pdf. This is a eleven stage process. The stages in this process are reporting, dashboards, visualization, cube building, analytics, data mining, extraction, transformation load, data integration, data federation. This is a completely editable PowerPoint presentation and is available for immediate download. Download now and impress your audience.

Business Diagram Lock Graphics For Secure Internet Access Presentation Template
This power point template has been crafted with graphic of 3d world map and lock. This PPT contains the concept of security. Use this PPT for your business and marketing related presentations.
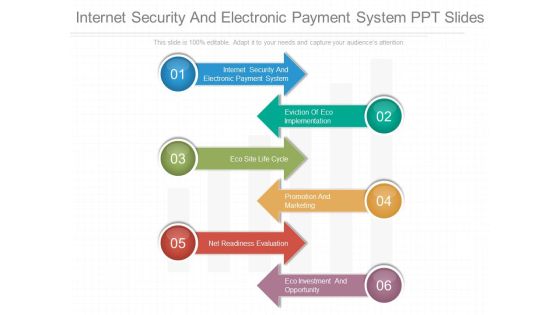
Internet Security And Electronic Payment System Ppt Slides
This is a internet security and electronic payment system ppt slides. This is a six stage process. The stages in this process are internet security and electronic payment system, eviction of eco implementation, eco site life cycle, promotion and marketing, net readiness evaluation, eco investment and opportunity.
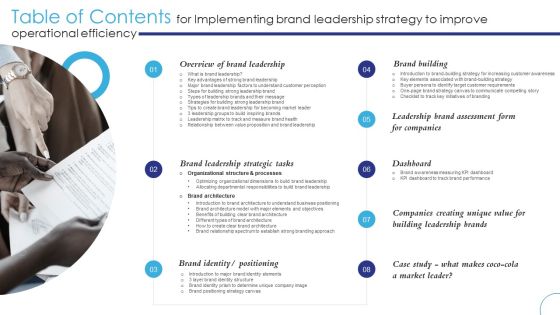
Table Of Contents For Implementing Brand Leadership Strategy To Improve Operationals Graphics PDF
Overview Brand Leadership, Brand Building, Dashboard
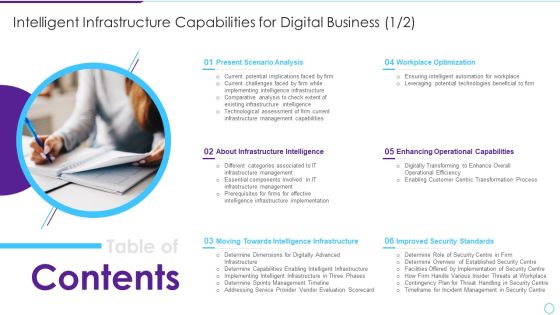
Table Of Contents Intelligent Infrastructure Capabilities For Digital Business Guidelines PDF
Presenting Table Of Contents Intelligent Infrastructure Capabilities For Digital Business Guidelines PDF to provide visual cues and insights. Share and navigate important information on twelve stages that need your due attention. This template can be used to pitch topics like Data Center Management, Budget Assessment, Impact Assessment, Dashboard Analysis, Leveraging Workforce Involved. In addtion, this PPT design contains high resolution images, graphics, etc, that are easily editable and available for immediate download.

Deploying Iot Solutions In The Retail Market Retail Iot Solutions Case Study 2 Brochure PDF
The following slide highlights the store space utilization challenge faced by client. IoT solution offered included camera sensors and connected dashboard for data analysis, it also shows results after solution implementation. From laying roadmaps to briefing everything in detail, our templates are perfect for you. You can set the stage with your presentation slides. All you have to do is download these easy-to-edit and customizable templates. Deploying Iot Solutions In The Retail Market Retail Iot Solutions Case Study 2 Brochure PDF will help you deliver an outstanding performance that everyone would remember and praise you for. Do download this presentation today.

Enhancing Cyber Safety With Vulnerability Administration Security Information And Event Formats PDF
This slide covers the SIEM dashboard which focuses on security events, event categories, data sources, logger event, multiple events, etc. Deliver an awe inspiring pitch with this creative enhancing cyber safety with vulnerability administration security information and event formats pdf bundle. Topics like security events, event categories, data source, multiple events can be discussed with this completely editable template. It is available for immediate download depending on the needs and requirements of the user.

Comparative Analysis Of Tools For Measuring Impact Of Employee Training Template PDF
This slide covers comparative analysis of tools for measuring effectiveness of training program. It involves features such as analytics dashboard, customized survey templates, data analysis and customized reports. Showcasing this set of slides titled Comparative Analysis Of Tools For Measuring Impact Of Employee Training Template PDF. The topics addressed in these templates are Analytics Dashboard, Customized Survey Templates, Data Analysis. All the content presented in this PPT design is completely editable. Download it and make adjustments in color, background, font etc. as per your unique business setting.

Cloud Solution Roadmap For Virtual Project Ppt PowerPoint Presentation Outline Infographic Template PDF
Persuade your audience using this cloud solution roadmap for virtual project ppt powerpoint presentation outline infographic template pdf. This PPT design covers four stages, thus making it a great tool to use. It also caters to a variety of topics including run reports and dashboards, project data loaded, setup and configure solution, train users and deploy, modify project data, review project, data and reports, start trial, run reports with modified data. Download this PPT design now to present a convincing pitch that not only emphasizes the topic but also showcases your presentation skills.

Product Sales Distribution Network Process Icon Ppt PowerPoint Presentation Outline Layout Ideas PDF
displays the dashboard covering the data related to sales of the products globally and distribution of it by the employee for the past two years i.e. 2019 and 2020. It also includes the actual as well as forecasted value.Showcasing this set of slides titled Product Sales Distribution Network Process Icon Ppt PowerPoint Presentation Outline Layout Ideas PDF. The topics addressed in these templates are Product Sales, Distribution Network, Process Icon. All the content presented in this PPT design is completely editable. Download it and make adjustments in color, background, font etc. as per your unique business setting.

Risk Recognition Automation Siem Architecture Flowchart Ppt Summary Example File PDF
This slide covers the security incident and event management flowchart which shows the flow of the SIEM system components wherein data, collector, and central engine are focused. Presenting risk recognition automation siem architecture flowchart ppt summary example file pdf to provide visual cues and insights. Share and navigate important information on four stages that need your due attention. This template can be used to pitch topics like reporting, dashboard, data mining, algorithm. In addtion, this PPT design contains high resolution images, graphics, etc, that are easily editable and available for immediate download.

Campaign Business Cost Per Conversion Comparison Table Graphics PDF
This slide covers comparison table based on cost per conversion for different campaign techniques. It includes elements such as campaign types, cost incurred, CTR and cost or conversion. Pitch your topic with ease and precision using this Campaign Business Cost Per Conversion Comparison Table Graphics PDF. This layout presents information on Data Analysis, Data Warehousing, Interactive Dashboards. It is also available for immediate download and adjustment. So, changes can be made in the color, design, graphics or any other component to create a unique layout.
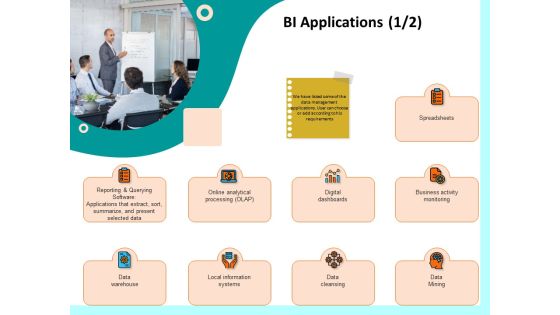
Firm Productivity Administration BI Applications Processing Ppt PowerPoint Presentation Model Styles PDF
Presenting this set of slides with name firm productivity administration bi applications processing ppt powerpoint presentation model styles pdf. This is a nine stage process. The stages in this process are data warehouse, data mining, data cleansing, business activity monitoring, digital dashboards, local information systems, online analytical processing, spreadsheets. This is a completely editable PowerPoint presentation and is available for immediate download. Download now and impress your audience.

Portfolio Revision Ppt PowerPoint Presentation Slide
This is a portfolio revision ppt powerpoint presentation slide. This is a two stage process. The stages in this process are current portfolio, new portfolio, data analysis.
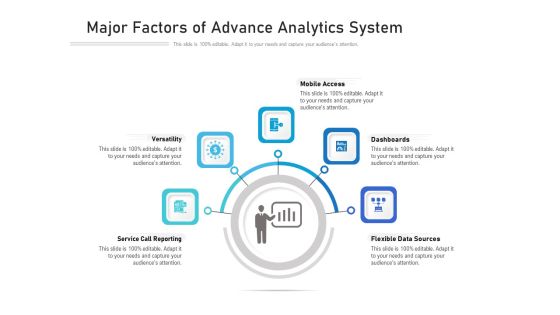
Major Factors Of Advance Analytics System Ppt PowerPoint Presentation Infographics Master Slide PDF
Persuade your audience using this major factors of advance analytics system ppt powerpoint presentation infographics master slide pdf. This PPT design covers five stages, thus making it a great tool to use. It also caters to a variety of topics including mobile access, dashboards, flexible data sources, service call reporting, versatility. Download this PPT design now to present a convincing pitch that not only emphasizes the topic but also showcases your presentation skills.

Execution Of ICT Strategic Plan Key Elements Of Configuration Management Database Themes PDF
This slide represents key elements for the configuration management database CMDB. It includes metrics analytics dashboard, populating data of configuration items, compliance, and IT service planning. There are so many reasons you need a Execution Of ICT Strategic Plan Key Elements Of Configuration Management Database Themes PDF. The first reason is you can not spend time making everything from scratch, Thus, Slidegeeks has made presentation templates for you too. You can easily download these templates from our website easily.

Service Resource Planning Ppt PowerPoint Presentation Styles
This is a service resource planning ppt powerpoint presentation styles. This is a five stage process. The stages in this process are crm, demand and capacity planning, engagement management, service delivery management, erp and corporate dashboards, financial management.
Robotic Process Automation Metrics Tracker With Work Item Statistics Information PDF
This slide covers the RPA dashboard for analysing process data status. It also includes process details such as run success rate, inputs, processing, fail, output, robotic run minutes, total value generated, work items processed. Pitch your topic with ease and precision using this Robotic Process Automation Metrics Tracker With Work Item Statistics Information PDF. This layout presents information on Robotic Process Automation, Metrics Tracker, Work Item Statistics. It is also available for immediate download and adjustment. So, changes can be made in the color, design, graphics or any other component to create a unique layout.

Business To Business Digital Google Analytics For All Web Tracking Elements PDF
This template covers tools to measure marketing analytics such as google analytics for all web tracking, google data studio to build real-time reporting dashboards and google data studio reports. Do you have an important presentation coming up Are you looking for something that will make your presentation stand out from the rest Look no further than Business To Business Digital Google Analytics For All Web Tracking Elements PDF. With our professional designs, you can trust that your presentation will pop and make delivering it a smooth process. And with Slidegeeks, you can trust that your presentation will be unique and memorable. So why wait Grab Business To Business Digital Google Analytics For All Web Tracking Elements PDF today and make your presentation stand out from the rest.
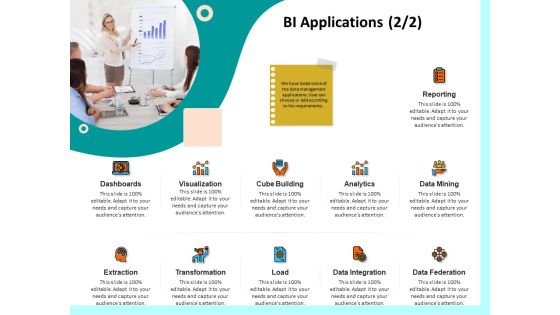
Firm Productivity Administration BI Applications Reporting Ppt PowerPoint Presentation Outline Example Introduction PDF
Presenting this set of slides with name firm productivity administration bi applications reporting ppt powerpoint presentation outline example introduction pdf. This is a eleven stage process. The stages in this process are reporting, dashboards, visualization, cube building, analytics, data mining, extraction, transformation load, data integration, data federation. This is a completely editable PowerPoint presentation and is available for immediate download. Download now and impress your audience.

Enterprise Problem Solving And Intellect BI Applications Reporting Ppt PowerPoint Presentation Styles Summary PDF
Presenting this set of slides with name enterprise problem solving and intellect bi applications reporting ppt powerpoint presentation styles summary pdf. This is a ten stage process. The stages in this process are reporting, dashboards, visualization, cube building, analytics, data mining, extraction, transformation load, data integration, data federation. This is a completely editable PowerPoint presentation and is available for immediate download. Download now and impress your audience.

Force Field Analysis Template 2 Ppt PowerPoint Presentation Themes
This is a force field analysis template 2 ppt powerpoint presentation themes. This is a two stage process. The stages in this process are restraining forces, driving forces, estimated strength, equilibrium.
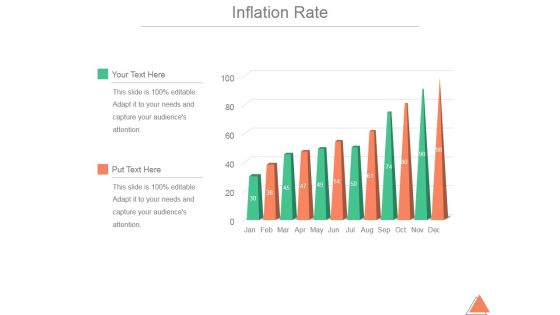
Inflation Rate Template 1 Ppt PowerPoint Presentation Influencers
This is a inflation rate template 1 ppt powerpoint presentation influencers. This is a twelve stage process. The stages in this process are business, marketing, growth, management, inflation rate.

Market Leader In A Segment Ppt PowerPoint Presentation Model
This is a market leader in a segment ppt powerpoint presentation model. This is a one stage process. The stages in this process are stringent vendor approvals and pre qs required, high quality standards, past experience, sizable, state of the art facility required, highly skilled workforce required.
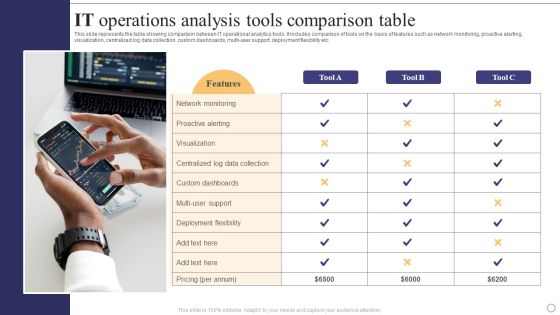
IT Operations Analysis Tools Comparison Table Professional PDF
This slide represents the table showing comparison between IT operational analytics tools. It includes comparison of tools on the basis of features such as network monitoring, proactive alerting, visualization, centralized log data collection, custom dashboards, multi-user support, deployment flexibility etc. Persuade your audience using this IT Operations Analysis Tools Comparison Table Professional PDF. This PPT design covers one stage, thus making it a great tool to use. It also caters to a variety of topics including Network monitoring, Custom dashboards, Deployment flexibility. Download this PPT design now to present a convincing pitch that not only emphasizes the topic but also showcases your presentation skills.
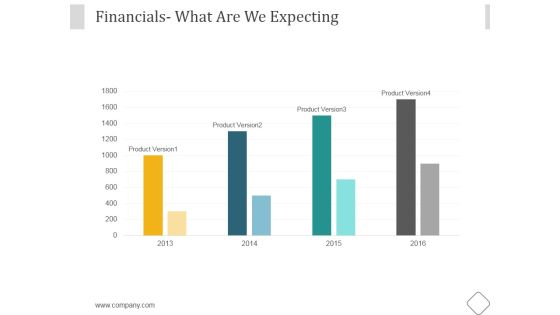
Financials Ppt PowerPoint Presentation Samples
This is a financials ppt powerpoint presentation samples. This is a four stage process. The stages in this process are business, marketing, management, financial, expecting.

Analyze Results Ppt PowerPoint Presentation Slide
This is a analyze results ppt powerpoint presentation slide. This is a two stage process. The stages in this process are analysis, business, marketing, finance, pie chart.

BI Software Key Features List BI Transformation Toolset Icons PDF
The following slide illustrates the business intelligence suite key attributes such as personalized executive dashboards, location intelligence, and interactive reports. Presenting BI Software Key Features List BI Transformation Toolset Icons PDF to provide visual cues and insights. Share and navigate important information on six stages that need your due attention. This template can be used to pitch topics like Analysis, Personalized Executive Dashboards, Data Layer. In addtion, this PPT design contains high resolution images, graphics, etc, that are easily editable and available for immediate download.
Shipment Tracking Solutions To Minimize Decline Of Sales Demonstration PDF
Following slide presents digital solutions for warehouse management that can be implemented by managers to streamline inventory management and reduce lost sales. Major solutions are radio frequency handheld device, dashboard, data analytics, trailer management etc. Persuade your audience using this Shipment Tracking Solutions To Minimize Decline Of Sales Demonstration PDF. This PPT design covers six stages, thus making it a great tool to use. It also caters to a variety of topics including Dashboard, Trailer Management, Advanced Solutions. Download this PPT design now to present a convincing pitch that not only emphasizes the topic but also showcases your presentation skills.

Financial Summary Ppt PowerPoint Presentation Information
This is a financial summary ppt powerpoint presentation information. This is a two stage process. The stages in this process are revenue and gross profit, quarterly revenue split, revenue spilt by geography, revenue split by product mix, revenue split by segment sector.
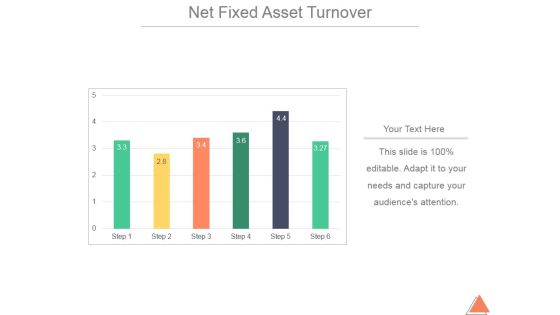
Net Fixed Asset Turnover Ppt PowerPoint Presentation Slide Download
This is a net fixed asset turnover ppt powerpoint presentation slide download. This is a one stage process. The stages in this process are business, marketing, finance, management, planning.
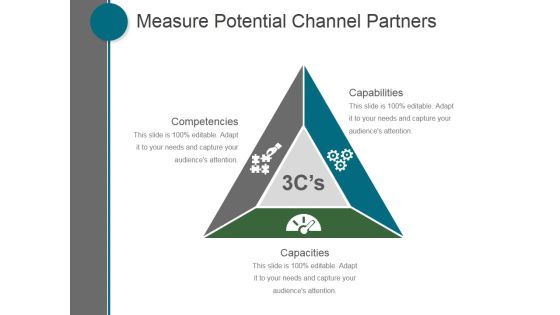
Measure Potential Channel Partners Template Ppt PowerPoint Presentation Show
This is a measure potential channel partners template ppt powerpoint presentation show. This is a three stage process. The stages in this process are capabilities, capacities, competencies.
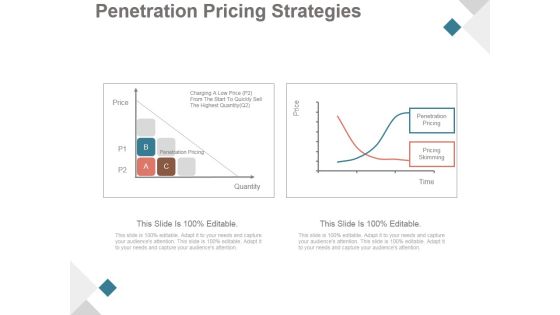
Penetration Pricing Strategies Ppt PowerPoint Presentation Slide
This is a penetration pricing strategies ppt powerpoint presentation slide. This is a two stage process. The stages in this process are penetration pricing, pricing skimming, quantity, price.

Taxonomy Of Service Process Ppt PowerPoint Presentation Designs
This is a taxonomy of service process ppt powerpoint presentation designs. This is a five stage process. The stages in this process are low service, agenda, high service.
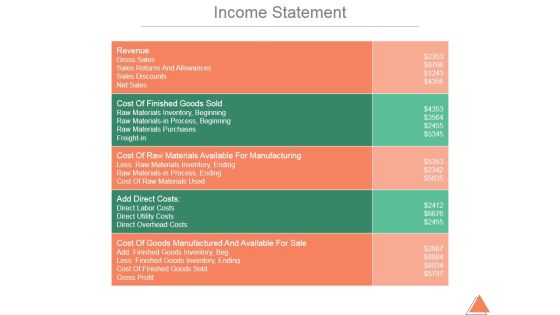
Income Statement Ppt PowerPoint Presentation Background Images
This is a income statement ppt powerpoint presentation background images. This is a five stage process. The stages in this process are revenue, gross sales, sales returns and allowances, sales discounts, net sales.
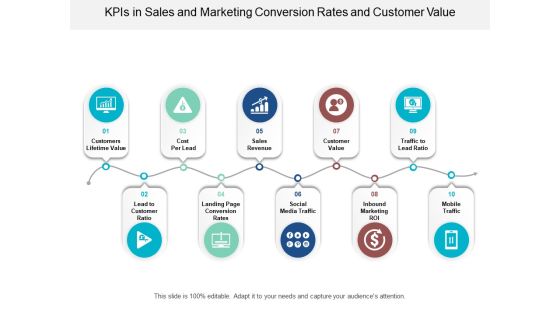
Kpis In Sales And Marketing Conversion Rates And Customer Value Ppt Powerpoint Presentation File Information
This is a kpis in sales and marketing conversion rates and customer value ppt powerpoint presentation file information. This is a ten stage process. The stages in this process are dashboard, kpi, metrics.

Customer Retention Kpis Brand Awareness And Lead Generation Ppt PowerPoint Presentation Outline Information
This is a customer retention kpis brand awareness and lead generation ppt powerpoint presentation outline information. This is a three stage process. The stages in this process are kpi proposal, kpi plan, kpi scheme.

Change Management Team Ppt PowerPoint Presentation Outline Information Cpb
This is a change management team ppt powerpoint presentation outline information cpb. This is a four stage process. The stages in this process are change management team.
Social Media Icons With Pie Charts For Marketing Analysis Ppt PowerPoint Presentation Ideas Example
This is a social media icons with pie charts for marketing analysis ppt powerpoint presentation ideas example. This is a six stage process. The stages in this process are kpi proposal, kpi plan, kpi scheme.

Departments Of Visualization Research Tableau As Visualization Research Tool Demonstration PDF
This slide shows the tableau visualization research tool in which users can construct and share interactive and editable dashboards that represent data in charts.Presenting Departments Of Visualization Research Tableau As Visualization Research Tool Demonstration PDF to provide visual cues and insights. Share and navigate important information on ten stages that need your due attention. This template can be used to pitch topics like Business Intelligence, Dashboards That Represent, Business Intelligence In addtion, this PPT design contains high resolution images, graphics, etc, that are easily editable and available for immediate download.
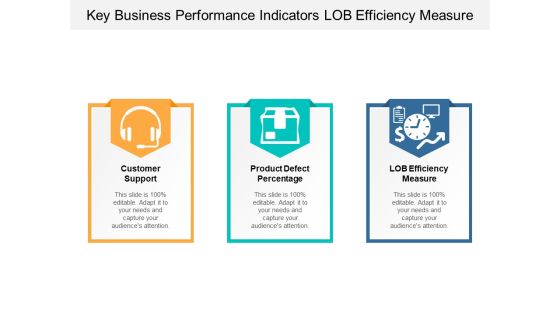
Key Business Performance Indicators Lob Efficiency Measure Ppt Powerpoint Presentation Infographics File Formats
This is a key business performance indicators lob efficiency measure ppt powerpoint presentation infographics file formats. This is a three stage process. The stages in this process are dashboard, kpi, metrics.
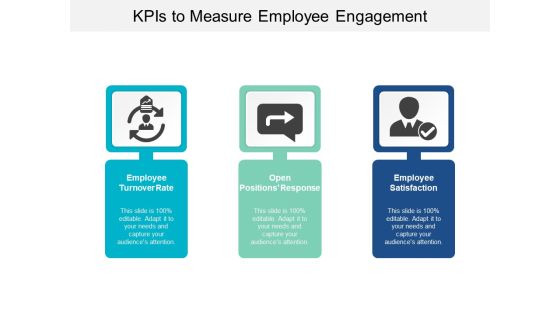
Kpis To Measure Employee Engagement Ppt Powerpoint Presentation Pictures Gridlines
This is a kpis to measure employee engagement ppt powerpoint presentation pictures gridlines. This is a three stage process. The stages in this process are dashboard, kpi, metrics.
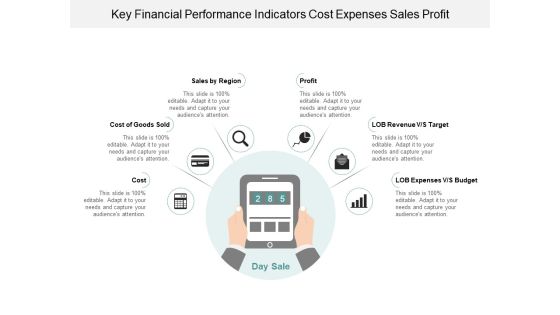
Key Financial Performance Indicators Cost Expenses Sales Profit Ppt Powerpoint Presentation Infographic Template Graphic Images
This is a key financial performance indicators cost expenses sales profit ppt powerpoint presentation infographic template graphic images. This is a six stage process. The stages in this process are dashboard, kpi, metrics.
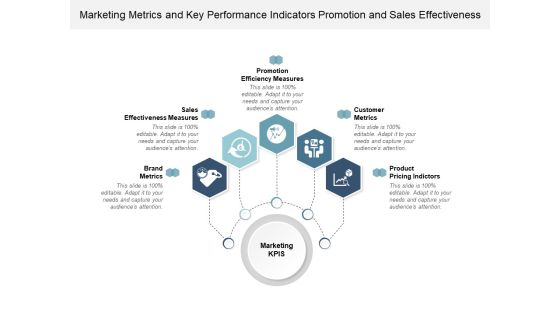
Marketing Metrics And Key Performance Indicators Promotion And Sales Effectiveness Ppt Powerpoint Presentation Infographics Graphics Example
This is a marketing metrics and key performance indicators promotion and sales effectiveness ppt powerpoint presentation infographics graphics example. This is a five stage process. The stages in this process are dashboard, kpi, metrics.

Availability Key Performance Indicator Inventory Turnover Ratio Ppt Powerpoint Presentation Layouts Graphics Download
This is a availability key performance indicator inventory turnover ratio ppt powerpoint presentation layouts graphics download. This is a two stage process. The stages in this process are availability kpi, availability dashboard, availability metrics.

Profitability Key Performance Indicators Financial Activities Cash Flow Ppt Powerpoint Presentation Portfolio Clipart Images
This is a profitability key performance indicators financial activities cash flow ppt powerpoint presentation portfolio clipart images. This is a five stage process. The stages in this process are dashboard, kpi, metrics.
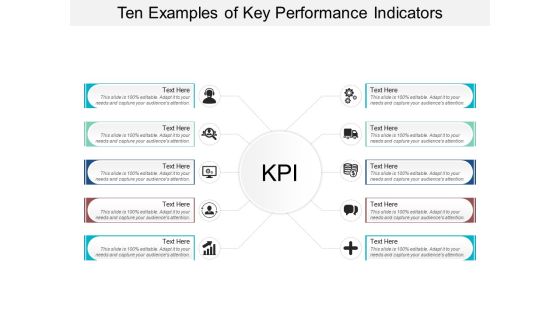
Ten Examples Of Key Performance Indicators Ppt Powerpoint Presentation Layouts Professional
This is a ten examples of key performance indicators ppt powerpoint presentation layouts professional. This is a ten stage process. The stages in this process are dashboard, kpi, metrics.

Kpis For Measuring Brand Marketing Communication Potential Share Ppt Powerpoint Presentation Layouts Infographics
This is a kpis for measuring brand marketing communication potential share ppt powerpoint presentation layouts infographics. This is a six stage process. The stages in this process are dashboard, kpi, metrics.
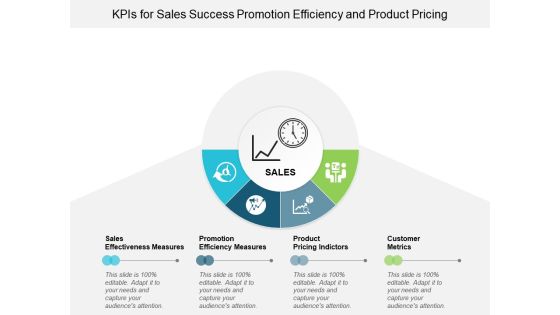
Kpis For Sales Success Promotion Efficiency And Product Pricing Ppt Powerpoint Presentation Infographics Background Images
This is a kpis for sales success promotion efficiency and product pricing ppt powerpoint presentation infographics background images. This is a four stage process. The stages in this process are dashboard, kpi, metrics.
Performance Indicators Of Business Icons Ppt Powerpoint Presentation Infographics Graphics Template
This is a performance indicators of business icons ppt powerpoint presentation infographics graphics template. This is a four stage process. The stages in this process are dashboard, kpi, metrics.
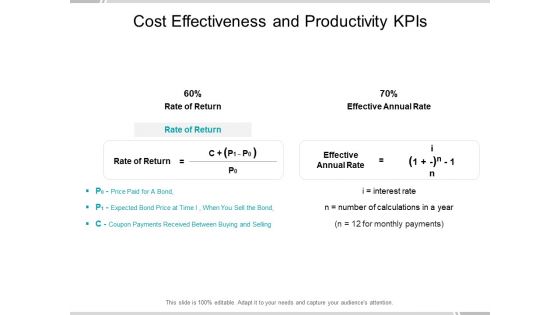
Cost Effectiveness And Productivity Kpis Ppt Powerpoint Presentation Portfolio Demonstration
This is a cost effectiveness and productivity kpis ppt powerpoint presentation portfolio demonstration. This is a two stage process. The stages in this process are availability kpi, availability dashboard, availability metrics.

Financial Kpis For Business Growth Liquidity Efficiency And Solvency Ppt Powerpoint Presentation Summary Gridlines
This is a financial kpis for business growth liquidity efficiency and solvency ppt powerpoint presentation summary gridlines. This is a seven stage process. The stages in this process are dashboard, kpi, metrics.

Customer Retention Kpis Lifetime Value And Acquisition Cost Ppt Powerpoint Presentation Model Samples
This is a customer retention kpis lifetime value and acquisition cost ppt powerpoint presentation model samples. This is a five stage process. The stages in this process are dashboard, kpi, metrics.

Customer Service Kpis Satisfied Customers And Churn Rate Ppt Powerpoint Presentation Pictures Template
This is a customer service kpis satisfied customers and churn rate ppt powerpoint presentation pictures template. This is a four stage process. The stages in this process are dashboard, kpi, metrics.
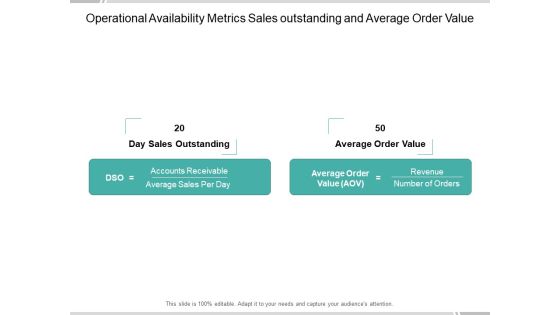
Operational Availability Metrics Sales Outstanding And Average Order Value Ppt Powerpoint Presentation Infographic Template Introduction
This is a operational availability metrics sales outstanding and average order value ppt powerpoint presentation infographic template introduction. This is a two stage process. The stages in this process are availability kpi, availability dashboard, availability metrics.

Business Strategic Performance Report Ppt Powerpoint Presentation Show Background Image
This is a business strategic performance report ppt powerpoint presentation show background image. This is a four stage process. The stages in this process are business metrics, business kpi, business dashboard.
