Data Dashboard

Product Life Cycle Graph Powerpoint Slide Background Image
This is a product life cycle graph powerpoint slide background image. This is a four stage process. The stages in this process are introduction, growth, maturity, decline.

Bar Graph Ppt PowerPoint Presentation Model
This is a bar graph ppt powerpoint presentation model. This is a five stage process. The stages in this process are business, marketing, bar slides, management, finance.

Product Roadmap Product Launch Deliverables Slide Ppt PowerPoint Presentation Background Images
This is a product roadmap product launch deliverables slide ppt powerpoint presentation background images. This is a ten stage process. The stages in this process are business, table, marketing, strategy, data.

Mapping Your Competitive Position Ppt PowerPoint Presentation Files
This is a mapping your competitive position ppt powerpoint presentation files. This is a four stage process. The stages in this process are gaining market share, losing market share, company growth, average market growth.
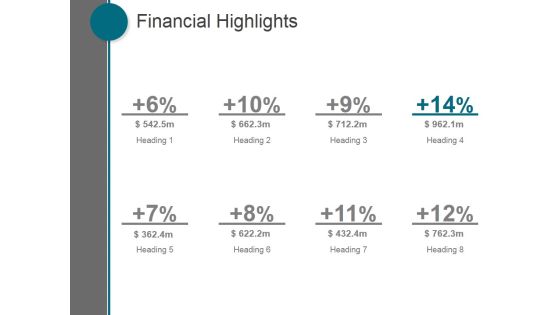
Financial Highlights Ppt PowerPoint Presentation Visual Aids
This is a financial highlights ppt powerpoint presentation visual aids. This is a eight stage process. The stages in this process are business, marketing, management, finance, strategy.

Changes In Competitive Environment Template 2 Ppt PowerPoint Presentation Professional Themes
This is a changes in competitive environment template 2 ppt powerpoint presentation professional themes. This is a four stage process. The stages in this process are brand, business, marketing, competitive landscape, growth.
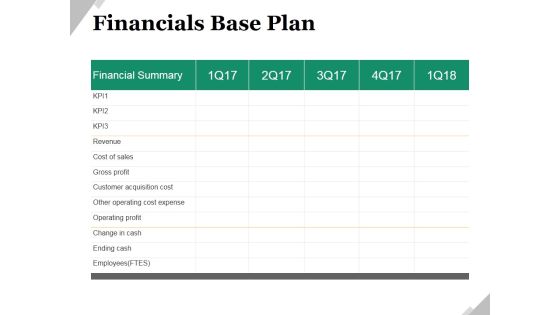
Financials Base Plan Ppt PowerPoint Presentation Model Shapes
This is a financials base plan ppt powerpoint presentation model shapes. This is a five stage process. The stages in this process are financial summary, business, marketing, revenue, cost of sales, gross profit.

Changes In Competitive Environment Template 2 Ppt PowerPoint Presentation Outline Slideshow
This is a changes in competitive environment template 2 ppt powerpoint presentation outline slideshow. This is a four stage process. The stages in this process are business, comparison, marketing, brand, management.

Deliverables From Marketing Ppt PowerPoint Presentation Tips
This is a deliverables from marketing ppt powerpoint presentation tips. This is a four stage process. The stages in this process are datasheet, product brief, white papers, case studies.

Balance Sheet Kpis Template 1 Ppt PowerPoint Presentation Layouts Design Ideas
This is a balance sheet kpis template 1 ppt powerpoint presentation layouts design ideas. This is a four stage process. The stages in this process are current assets, current liabilities, total assets, total liabilities.

Determinants Of Product Quality Ppt PowerPoint Presentation Infographic Template Files
This is a determinants of product quality ppt powerpoint presentation infographic template files. This is a seven stage process. The stages in this process are performance, reliability, durability, evaluation, safety.

Financial Ppt PowerPoint Presentation Outline Grid
This is a financial ppt powerpoint presentation outline grid. This is a three stage process. The stages in this process are business, strategy, marketing, analysis, finance, purchase, monthly.
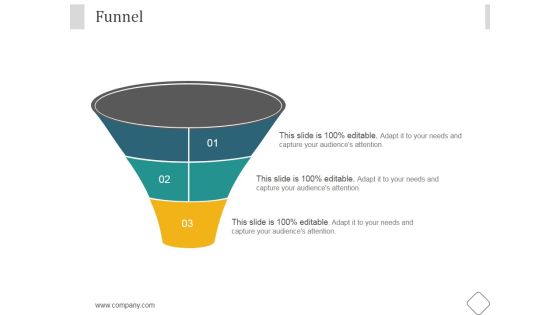
Funnel Ppt PowerPoint Presentation Backgrounds
This is a funnel ppt powerpoint presentation backgrounds. This is a three stage process. The stages in this process are business, marketing, management, funnel, planning.

Financial Highlights Template Ppt PowerPoint Presentation Influencers
This is a financial highlights template ppt powerpoint presentation influencers. This is a three stage process. The stages in this process are business, marketing, management, finance, strategy.

How Much Money We Need Ppt PowerPoint Presentation Outline
This is a how much money we need ppt powerpoint presentation outline. This is a three stage process. The stages in this process are business, marketing, management, production, sales.
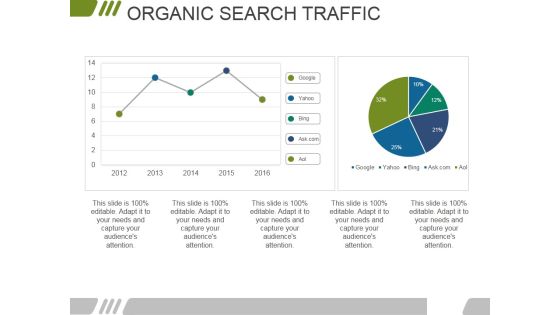
Organic Search Traffic Ppt PowerPoint Presentation Model Slideshow
This is a organic search traffic ppt powerpoint presentation model slideshow. This is a two stage process. The stages in this process are business, marketing, finance, management, organic.
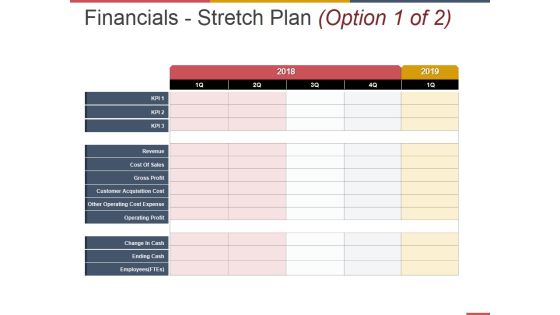
Financials Stretch Plan Template 2 Ppt PowerPoint Presentation Inspiration Background Image
This is a financials stretch plan template 2 ppt powerpoint presentation inspiration background image. This is a three stage process. The stages in this process are cost of sales, gross profit, customer acquisition cost, other operating cost expense, operating profit.
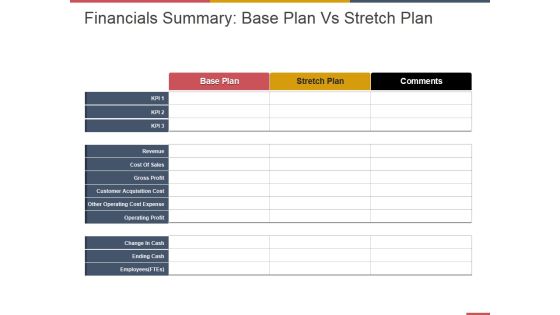
Financials Summary Base Plan Vs Stretch Plan Ppt PowerPoint Presentation Layouts Graphic Tips
This is a financials summary base plan vs stretch plan ppt powerpoint presentation layouts graphic tips. This is a three stage process. The stages in this process are cost of sales, gross profit, customer acquisition cost, other operating cost expense, operating profit.

Balance Sheet Kpis Template 2 Ppt PowerPoint Presentation Portfolio Example
This is a balance sheet kpis template 2 ppt powerpoint presentation portfolio example. This is a four stage process. The stages in this process are non current investments, long term loans and advances, other non current assets, current investments, inventories.

Balance Sheet Kpis Template 3 Ppt PowerPoint Presentation Show Summary
This is a balance sheet kpis template 3 ppt powerpoint presentation show summary. This is a four stage process. The stages in this process are shareholders equity, non current liabilities, short term borrowings, trade payables, other current liabilities, short term provisions.

Elevator Pitch Ppt PowerPoint Presentation Rules
This is a elevator pitch ppt powerpoint presentation rules. This is a three stage process. The stages in this process are business, marketing, management, elevator pitch, strategy.

Evaluation Of Market Size Ppt PowerPoint Presentation Ideas
This is a evaluation of market size ppt powerpoint presentation ideas. This is a six stage process. The stages in this process are target market, advertisers, event organizers, mentors.

Cash Flow Statement Kpis Template 1 Ppt PowerPoint Presentation Gallery Diagrams
This is a cash flow statement kpis template 1 ppt powerpoint presentation gallery diagrams. This is a four stage process. The stages in this process are operations, financing activities, investing activities, net increase in cash.
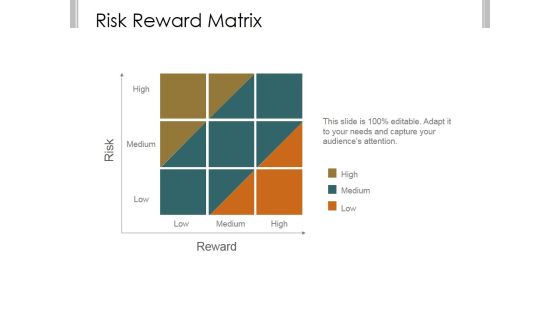
Risk Reward Matrix Template 2 Ppt PowerPoint Presentation Clipart
This is a risk reward matrix template 2 ppt powerpoint presentation clipart. This is a nine stage process. The stages in this process are business, strategy, marketing, analysis, risk, reward.

About Us Ppt PowerPoint Presentation Introduction
This is a about us ppt powerpoint presentation introduction. This is a four stage process. The stages in this process are business, marketing, management, icons, about us.
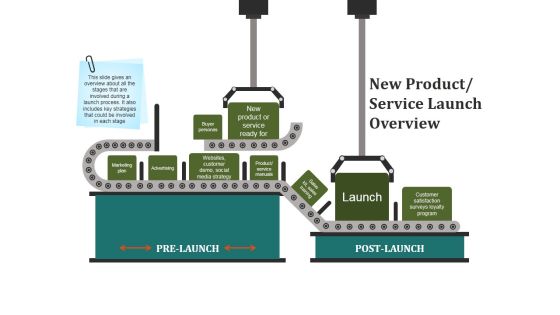
New Product Service Launch Overview Ppt PowerPoint Presentation Layouts Skills
This is a new product service launch overview ppt powerpoint presentation layouts skills. This is a two stage process. The stages in this process are marketing plan, pre launch, post launch, launch.

Pie Chart Ppt PowerPoint Presentation Example 2015
This is a pie chart ppt powerpoint presentation example 2015. This is a five stage process. The stages in this process are pie chart, percentage, business, marketing, management.

Musts And Wants Ppt PowerPoint Presentation Show Files
This is a musts and wants ppt powerpoint presentation show files. This is a two stage process. The stages in this process are must have, want to have, business, marketing, planning, table.

Product Comparison Ppt PowerPoint Presentation Styles Background Images
This is a product comparison ppt powerpoint presentation styles background images. This is a six stage process. The stages in this process are indirect competitor, company, feature, business, marketing.
The Problem Template 1 Ppt PowerPoint Presentation Template
This is a the problem template 1 ppt powerpoint presentation template. This is a two stage process. The stages in this process are business, marketing, management, maze, planning.
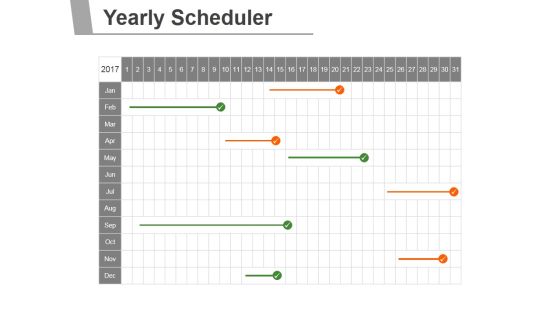
Yearly Scheduler Ppt PowerPoint Presentation Tips
This is a yearly scheduler ppt powerpoint presentation tips. This is a one stage process. The stages in this process are business, marketing, management, yearly, planning.

Clustered Bar Ppt PowerPoint Presentation Good
This is a clustered bar ppt powerpoint presentation good. This is a five stage process. The stages in this process are product, circular, business, marketing, bar graph.

Contingency Theory Ppt PowerPoint Presentation Designs Download
This is a contingency theory ppt powerpoint presentation designs download. This is a one stage process. The stages in this process are business, presentation, success, strategy, marketing.
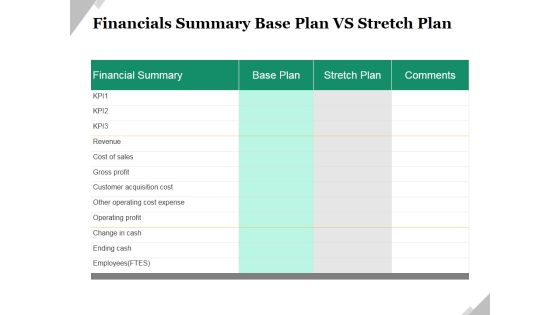
Financials Summary Base Plan Vs Stretch Plan Ppt PowerPoint Presentation Slides Information
This is a financials summary base plan vs stretch plan ppt powerpoint presentation slides information. This is a two stage process. The stages in this process are revenue, cost of sales, gross profit, customer acquisition cost, other operating cost expense, operating profit.

Checklist For Audit System Management Ppt PowerPoint Presentation Background Designs
This is a checklist for audit system management ppt powerpoint presentation background designs. This is a five stage process. The stages in this process are audit satisfactory, observations made, non conformance found, excellence, service offering.
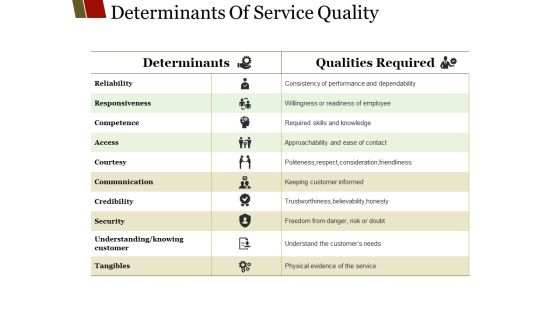
Determinants Of Service Quality Ppt PowerPoint Presentation Layouts Show
This is a determinants of service quality ppt powerpoint presentation layouts show. This is a ten stage process. The stages in this process are reliability, competence, access, courtesy, communication.
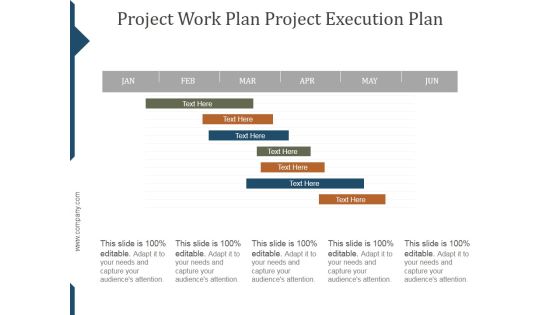
Project Work Plan Project Execution Plan Template Ppt PowerPoint Presentation Styles
This is a project work plan project execution plan template ppt powerpoint presentation styles. This is a seven stage process. The stages in this process are project, management, business, marketing, success.
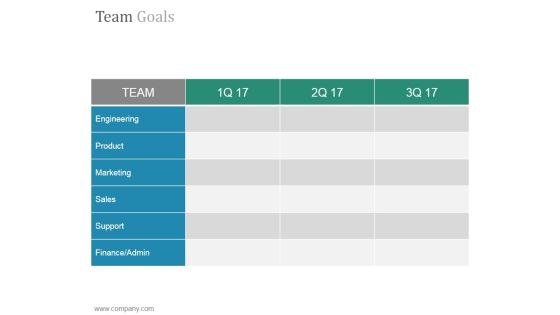
Team Goals Slide Ppt PowerPoint Presentation Tips
This is a team goals slide ppt powerpoint presentation tips. This is a six stage process. The stages in this process are engineering, product, marketing, sales, support, finance admin.
Funding Updates Debt Ppt PowerPoint Presentation Icon Background Designs
This is a funding updates debt ppt powerpoint presentation icon background designs. This is a two stage process. The stages in this process are debt, updates, business, marketing, compare, management.

Last 90 Days Results Ppt PowerPoint Presentation Introduction
This is a last 90 days results ppt powerpoint presentation introduction. This is a six stage process. The stages in this process are revenue, new customers, gross profit, sales comparison.
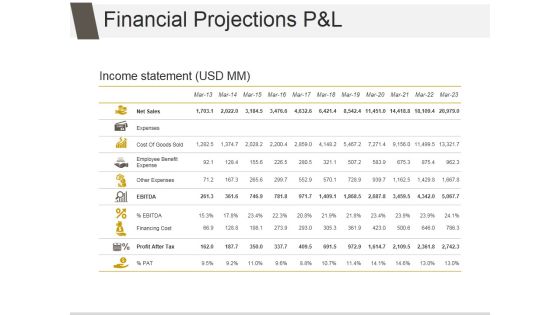
Financial Projections P And L Ppt PowerPoint Presentation Design Ideas
This is a financial projections p and l ppt powerpoint presentation design ideas. This is a eleven stage process. The stages in this process are net sales, expenses, cost of goods sold, employee benefit expense, other expenses, financing cost.

Calculating Customer Lifetime Value Clv Ppt PowerPoint Presentation Styles Good
This is a calculating customer lifetime value clv ppt powerpoint presentation styles good. This is a five stage process. The stages in this process are average acquisition cost, average customer revenue, average customer costs, average customer profit, customer retention rate, cumulative retention rate, likely customer profit.
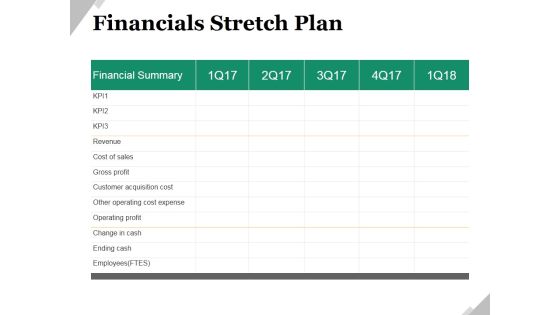
Financials Stretch Plan Ppt PowerPoint Presentation Ideas Shapes
This is a financials stretch plan ppt powerpoint presentation ideas shapes. This is a five stage process. The stages in this process are revenue, cost of sales, gross profit, customer acquisition cost, other operating cost expense, operating profit.

Calculating Customer Lifetime Value Clv Ppt PowerPoint Presentation Infographic Template Format
This is a calculating customer lifetime value clv ppt powerpoint presentation infographic template format. This is a five stage process. The stages in this process are average acquisition cost, average customer revenue, average customer costs, average customer profit, customer retention rate, cumulative retention rate.

Financials Base Plan Template 2 Ppt PowerPoint Presentation Outline Backgrounds
This is a financials base plan template 2 ppt powerpoint presentation outline backgrounds. This is a three stage process. The stages in this process are cost of sales, gross profit, customer acquisition cost, other operating cost expense, operating profit.
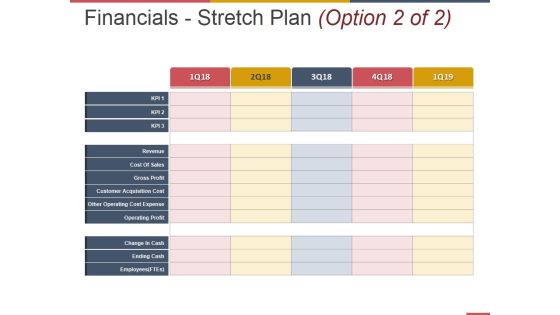
Financials Stretch Plan Template 1 Ppt PowerPoint Presentation Pictures Professional
This is a financials stretch plan template 1 ppt powerpoint presentation pictures professional. This is a three stage process. The stages in this process are cost of sales, gross profit, customer acquisition cost, other operating cost expense, operating profit.

Bar Graph For Financial Statements Ppt PowerPoint Presentation Example
This is a bar graph for financial statements ppt powerpoint presentation example. This is a four stage process. The stages in this process are product version, finance, year.

Acquisition Cost Per Customer Ppt PowerPoint Presentation Example 2015
This is a acquisition cost per customer ppt powerpoint presentation example 2015. This is a three stage process. The stages in this process are rising, steady, falling.
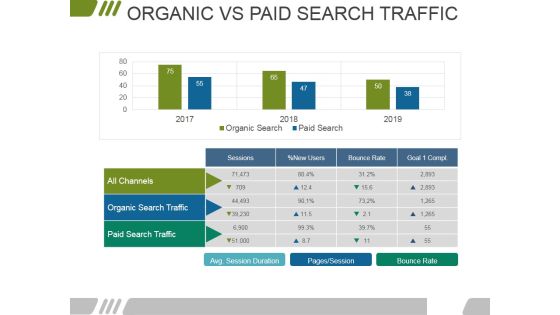
Organic Vs Paid Search Traffic Ppt PowerPoint Presentation Summary Visuals
This is a organic vs paid search traffic ppt powerpoint presentation summary visuals. This is a two stage process. The stages in this process are all channels, organic search traffic, paid search traffic, sessions, bounce rate.
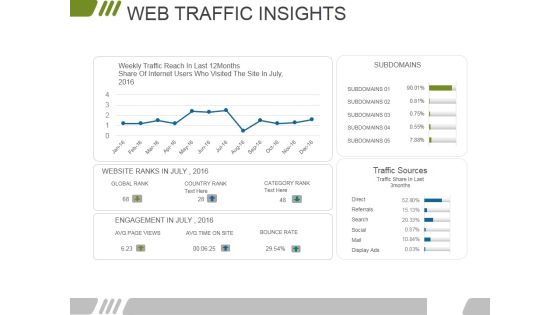
Web Traffic Insights Ppt PowerPoint Presentation Pictures Portrait
This is a web traffic insights ppt powerpoint presentation pictures portrait. This is a four stage process. The stages in this process are subdomains, traffic sources, category rank, country rank, global rank.
Website Performance Review Template 1 Ppt PowerPoint Presentation Slides Icons
This is a website performance review template 1 ppt powerpoint presentation slides icons. This is a three stage process. The stages in this process are online transaction, conversion rate, traffic source, site consumption time, organic branded.

4 Highs And Lows Business Matrix Ppt PowerPoint Presentation Sample
This is a 4 highs and lows business matrix ppt powerpoint presentation sample. This is a four stage process. The stages in this process are matrix, business matrix.
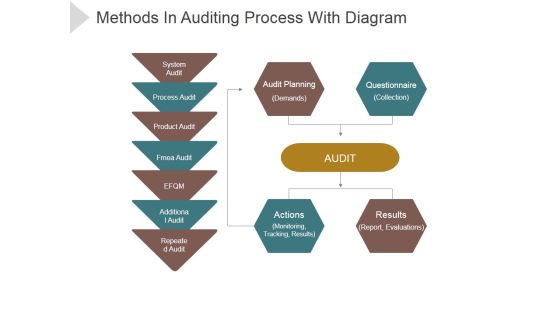
Methods In Auditing Process With Diagram Ppt PowerPoint Presentation Visual Aids
This is a methods in auditing process with diagram ppt powerpoint presentation visual aids. This is a four stage process. The stages in this process are system audit, process audit, product audit, fame audit, additional audit.
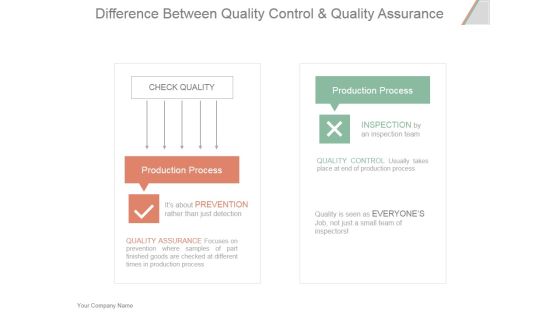
Difference Between Quality Control And Quality Assurance Ppt PowerPoint Presentation Influencers
This is a difference between quality control and quality assurance ppt powerpoint presentation influencers. This is a two stage process. The stages in this process are check quality, production process, prevention, quality assurance.

Quotes For Business Executives Ppt PowerPoint Presentation Show
This is a quotes for business executives ppt powerpoint presentation show. This is a one stage process. The stages in this process are quotes, business, executives, communication, strategy.

Demand Creation Strategy Ppt PowerPoint Presentation Show
This is a demand creation strategy ppt powerpoint presentation show. This is a four stage process. The stages in this process are chase, co create, caught, come, demand creation strategy.
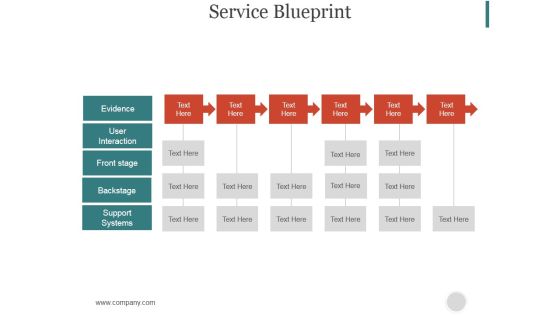
Service Blueprint Ppt PowerPoint Presentation Good
This is a service blueprint ppt powerpoint presentation good. This is a six stage process. The stages in this process are evidence, user interaction, front stage, backstage, support systems.
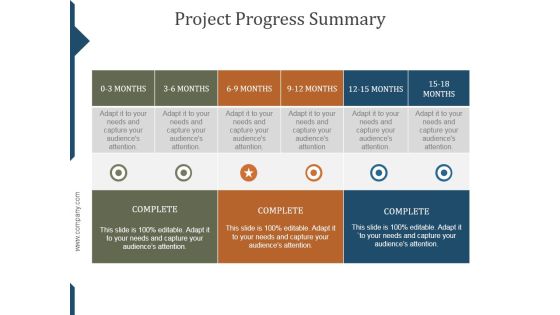
Project Progress Summary Ppt PowerPoint Presentation Infographic Template
This is a project progress summary ppt powerpoint presentation infographic template. This is a five stage process. The stages in this process are scheduling, absences, profile management, programme management.

What If Modelling Ppt PowerPoint Presentation Background Image
This is a what if modelling ppt powerpoint presentation background image. This is a three stage process. The stages in this process are challenge, choice, consequence.

Changes In Competitive Environment Slide Ppt PowerPoint Presentation Outline
This is a changes in competitive environment slide ppt powerpoint presentation outline. This is a four stage process. The stages in this process are competitive landscape, brand.

Financial Projections Balance Sheet Ppt PowerPoint Presentation Gallery Show
This is a financial projections balance sheet ppt powerpoint presentation gallery show. This is a two stage process. The stages in this process are non current liabilities, short term borrowings, trade payables, inventories, trade receivables.

Financial Projections Income Statement Ppt PowerPoint Presentation Inspiration Vector
This is a financial projections income statement ppt powerpoint presentation inspiration vector. This is a four stage process. The stages in this process are net sales, expenses, cost of goods sold, employee benefit expense, financing cost.

Funding Updates Equity Ppt PowerPoint Presentation Ideas Slide Download
This is a funding updates equity ppt powerpoint presentation ideas slide download. This is a two stage process. The stages in this process are shareholder name, shareholding pattern, total shares, percentage.

Project Health Card Ppt PowerPoint Presentation Summary Example
This is a project health card ppt powerpoint presentation summary example. This is a seven stage process. The stages in this process are development complete, testing complete, planning for change, milestones and key dates, task meter.

Facts Assessment BI Applications Reporting Ppt PowerPoint Presentation Model Example PDF
Presenting this set of slides with name facts assessment bi applications reporting ppt powerpoint presentation model example pdf. This is a eleven stage process. The stages in this process are reporting, dashboards, visualization, cube building, analytics, data mining, extraction, transformation load, data integration, data federation. This is a completely editable PowerPoint presentation and is available for immediate download. Download now and impress your audience.

Business Diagram Lock Graphics For Secure Internet Access Presentation Template
This power point template has been crafted with graphic of 3d world map and lock. This PPT contains the concept of security. Use this PPT for your business and marketing related presentations.
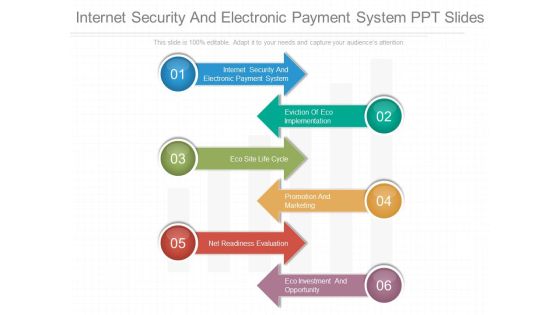
Internet Security And Electronic Payment System Ppt Slides
This is a internet security and electronic payment system ppt slides. This is a six stage process. The stages in this process are internet security and electronic payment system, eviction of eco implementation, eco site life cycle, promotion and marketing, net readiness evaluation, eco investment and opportunity.
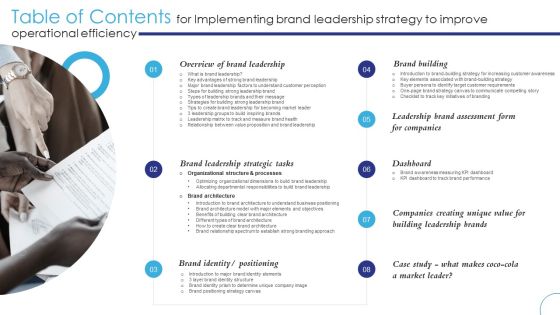
Table Of Contents For Implementing Brand Leadership Strategy To Improve Operationals Graphics PDF
Overview Brand Leadership, Brand Building, Dashboard
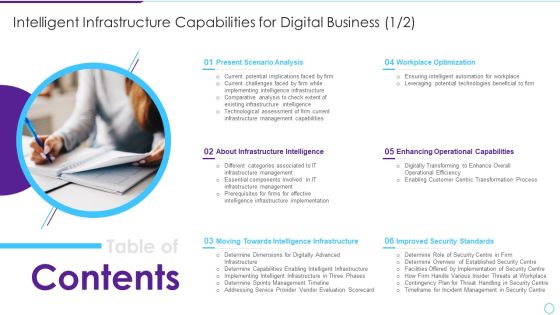
Table Of Contents Intelligent Infrastructure Capabilities For Digital Business Guidelines PDF
Presenting Table Of Contents Intelligent Infrastructure Capabilities For Digital Business Guidelines PDF to provide visual cues and insights. Share and navigate important information on twelve stages that need your due attention. This template can be used to pitch topics like Data Center Management, Budget Assessment, Impact Assessment, Dashboard Analysis, Leveraging Workforce Involved. In addtion, this PPT design contains high resolution images, graphics, etc, that are easily editable and available for immediate download.

Deploying Iot Solutions In The Retail Market Retail Iot Solutions Case Study 2 Brochure PDF
The following slide highlights the store space utilization challenge faced by client. IoT solution offered included camera sensors and connected dashboard for data analysis, it also shows results after solution implementation. From laying roadmaps to briefing everything in detail, our templates are perfect for you. You can set the stage with your presentation slides. All you have to do is download these easy-to-edit and customizable templates. Deploying Iot Solutions In The Retail Market Retail Iot Solutions Case Study 2 Brochure PDF will help you deliver an outstanding performance that everyone would remember and praise you for. Do download this presentation today.

Enhancing Cyber Safety With Vulnerability Administration Security Information And Event Formats PDF
This slide covers the SIEM dashboard which focuses on security events, event categories, data sources, logger event, multiple events, etc. Deliver an awe inspiring pitch with this creative enhancing cyber safety with vulnerability administration security information and event formats pdf bundle. Topics like security events, event categories, data source, multiple events can be discussed with this completely editable template. It is available for immediate download depending on the needs and requirements of the user.

Comparative Analysis Of Tools For Measuring Impact Of Employee Training Template PDF
This slide covers comparative analysis of tools for measuring effectiveness of training program. It involves features such as analytics dashboard, customized survey templates, data analysis and customized reports. Showcasing this set of slides titled Comparative Analysis Of Tools For Measuring Impact Of Employee Training Template PDF. The topics addressed in these templates are Analytics Dashboard, Customized Survey Templates, Data Analysis. All the content presented in this PPT design is completely editable. Download it and make adjustments in color, background, font etc. as per your unique business setting.

Cloud Solution Roadmap For Virtual Project Ppt PowerPoint Presentation Outline Infographic Template PDF
Persuade your audience using this cloud solution roadmap for virtual project ppt powerpoint presentation outline infographic template pdf. This PPT design covers four stages, thus making it a great tool to use. It also caters to a variety of topics including run reports and dashboards, project data loaded, setup and configure solution, train users and deploy, modify project data, review project, data and reports, start trial, run reports with modified data. Download this PPT design now to present a convincing pitch that not only emphasizes the topic but also showcases your presentation skills.

Product Sales Distribution Network Process Icon Ppt PowerPoint Presentation Outline Layout Ideas PDF
displays the dashboard covering the data related to sales of the products globally and distribution of it by the employee for the past two years i.e. 2019 and 2020. It also includes the actual as well as forecasted value.Showcasing this set of slides titled Product Sales Distribution Network Process Icon Ppt PowerPoint Presentation Outline Layout Ideas PDF. The topics addressed in these templates are Product Sales, Distribution Network, Process Icon. All the content presented in this PPT design is completely editable. Download it and make adjustments in color, background, font etc. as per your unique business setting.

Risk Recognition Automation Siem Architecture Flowchart Ppt Summary Example File PDF
This slide covers the security incident and event management flowchart which shows the flow of the SIEM system components wherein data, collector, and central engine are focused. Presenting risk recognition automation siem architecture flowchart ppt summary example file pdf to provide visual cues and insights. Share and navigate important information on four stages that need your due attention. This template can be used to pitch topics like reporting, dashboard, data mining, algorithm. In addtion, this PPT design contains high resolution images, graphics, etc, that are easily editable and available for immediate download.

Campaign Business Cost Per Conversion Comparison Table Graphics PDF
This slide covers comparison table based on cost per conversion for different campaign techniques. It includes elements such as campaign types, cost incurred, CTR and cost or conversion. Pitch your topic with ease and precision using this Campaign Business Cost Per Conversion Comparison Table Graphics PDF. This layout presents information on Data Analysis, Data Warehousing, Interactive Dashboards. It is also available for immediate download and adjustment. So, changes can be made in the color, design, graphics or any other component to create a unique layout.
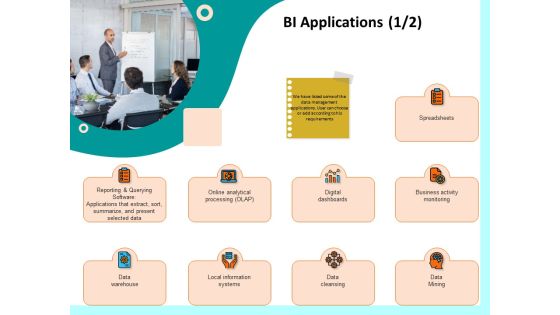
Firm Productivity Administration BI Applications Processing Ppt PowerPoint Presentation Model Styles PDF
Presenting this set of slides with name firm productivity administration bi applications processing ppt powerpoint presentation model styles pdf. This is a nine stage process. The stages in this process are data warehouse, data mining, data cleansing, business activity monitoring, digital dashboards, local information systems, online analytical processing, spreadsheets. This is a completely editable PowerPoint presentation and is available for immediate download. Download now and impress your audience.

Portfolio Revision Ppt PowerPoint Presentation Slide
This is a portfolio revision ppt powerpoint presentation slide. This is a two stage process. The stages in this process are current portfolio, new portfolio, data analysis.
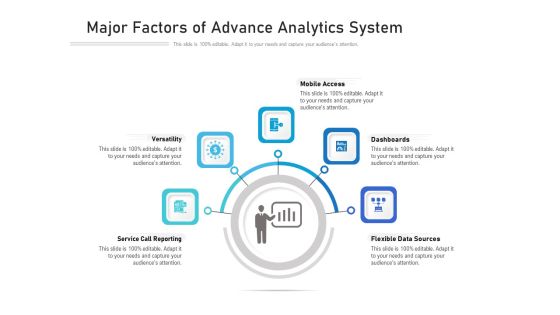
Major Factors Of Advance Analytics System Ppt PowerPoint Presentation Infographics Master Slide PDF
Persuade your audience using this major factors of advance analytics system ppt powerpoint presentation infographics master slide pdf. This PPT design covers five stages, thus making it a great tool to use. It also caters to a variety of topics including mobile access, dashboards, flexible data sources, service call reporting, versatility. Download this PPT design now to present a convincing pitch that not only emphasizes the topic but also showcases your presentation skills.

Execution Of ICT Strategic Plan Key Elements Of Configuration Management Database Themes PDF
This slide represents key elements for the configuration management database CMDB. It includes metrics analytics dashboard, populating data of configuration items, compliance, and IT service planning. There are so many reasons you need a Execution Of ICT Strategic Plan Key Elements Of Configuration Management Database Themes PDF. The first reason is you can not spend time making everything from scratch, Thus, Slidegeeks has made presentation templates for you too. You can easily download these templates from our website easily.

Service Resource Planning Ppt PowerPoint Presentation Styles
This is a service resource planning ppt powerpoint presentation styles. This is a five stage process. The stages in this process are crm, demand and capacity planning, engagement management, service delivery management, erp and corporate dashboards, financial management.
Robotic Process Automation Metrics Tracker With Work Item Statistics Information PDF
This slide covers the RPA dashboard for analysing process data status. It also includes process details such as run success rate, inputs, processing, fail, output, robotic run minutes, total value generated, work items processed. Pitch your topic with ease and precision using this Robotic Process Automation Metrics Tracker With Work Item Statistics Information PDF. This layout presents information on Robotic Process Automation, Metrics Tracker, Work Item Statistics. It is also available for immediate download and adjustment. So, changes can be made in the color, design, graphics or any other component to create a unique layout.

Business To Business Digital Google Analytics For All Web Tracking Elements PDF
This template covers tools to measure marketing analytics such as google analytics for all web tracking, google data studio to build real-time reporting dashboards and google data studio reports. Do you have an important presentation coming up Are you looking for something that will make your presentation stand out from the rest Look no further than Business To Business Digital Google Analytics For All Web Tracking Elements PDF. With our professional designs, you can trust that your presentation will pop and make delivering it a smooth process. And with Slidegeeks, you can trust that your presentation will be unique and memorable. So why wait Grab Business To Business Digital Google Analytics For All Web Tracking Elements PDF today and make your presentation stand out from the rest.
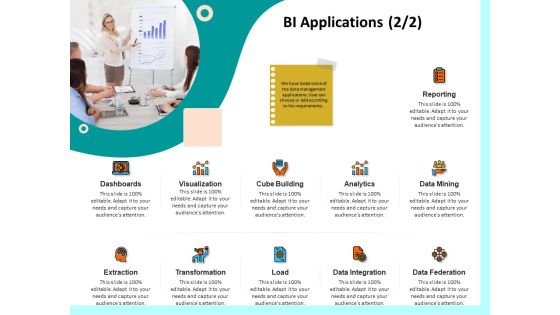
Firm Productivity Administration BI Applications Reporting Ppt PowerPoint Presentation Outline Example Introduction PDF
Presenting this set of slides with name firm productivity administration bi applications reporting ppt powerpoint presentation outline example introduction pdf. This is a eleven stage process. The stages in this process are reporting, dashboards, visualization, cube building, analytics, data mining, extraction, transformation load, data integration, data federation. This is a completely editable PowerPoint presentation and is available for immediate download. Download now and impress your audience.

Enterprise Problem Solving And Intellect BI Applications Reporting Ppt PowerPoint Presentation Styles Summary PDF
Presenting this set of slides with name enterprise problem solving and intellect bi applications reporting ppt powerpoint presentation styles summary pdf. This is a ten stage process. The stages in this process are reporting, dashboards, visualization, cube building, analytics, data mining, extraction, transformation load, data integration, data federation. This is a completely editable PowerPoint presentation and is available for immediate download. Download now and impress your audience.

Force Field Analysis Template 2 Ppt PowerPoint Presentation Themes
This is a force field analysis template 2 ppt powerpoint presentation themes. This is a two stage process. The stages in this process are restraining forces, driving forces, estimated strength, equilibrium.
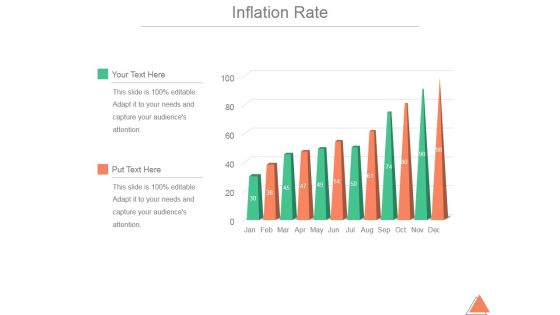
Inflation Rate Template 1 Ppt PowerPoint Presentation Influencers
This is a inflation rate template 1 ppt powerpoint presentation influencers. This is a twelve stage process. The stages in this process are business, marketing, growth, management, inflation rate.

Market Leader In A Segment Ppt PowerPoint Presentation Model
This is a market leader in a segment ppt powerpoint presentation model. This is a one stage process. The stages in this process are stringent vendor approvals and pre qs required, high quality standards, past experience, sizable, state of the art facility required, highly skilled workforce required.
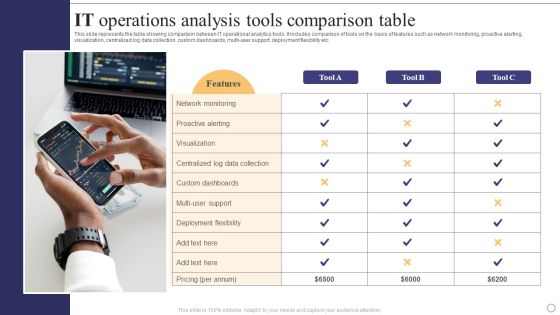
IT Operations Analysis Tools Comparison Table Professional PDF
This slide represents the table showing comparison between IT operational analytics tools. It includes comparison of tools on the basis of features such as network monitoring, proactive alerting, visualization, centralized log data collection, custom dashboards, multi-user support, deployment flexibility etc. Persuade your audience using this IT Operations Analysis Tools Comparison Table Professional PDF. This PPT design covers one stage, thus making it a great tool to use. It also caters to a variety of topics including Network monitoring, Custom dashboards, Deployment flexibility. Download this PPT design now to present a convincing pitch that not only emphasizes the topic but also showcases your presentation skills.
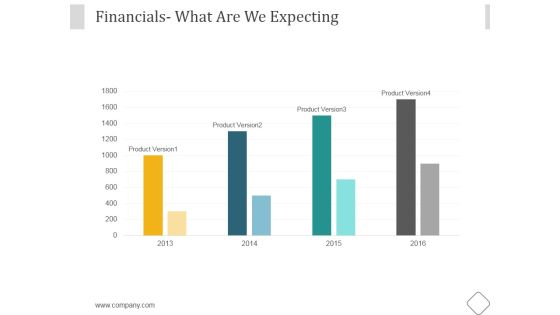
Financials Ppt PowerPoint Presentation Samples
This is a financials ppt powerpoint presentation samples. This is a four stage process. The stages in this process are business, marketing, management, financial, expecting.

Analyze Results Ppt PowerPoint Presentation Slide
This is a analyze results ppt powerpoint presentation slide. This is a two stage process. The stages in this process are analysis, business, marketing, finance, pie chart.

BI Software Key Features List BI Transformation Toolset Icons PDF
The following slide illustrates the business intelligence suite key attributes such as personalized executive dashboards, location intelligence, and interactive reports. Presenting BI Software Key Features List BI Transformation Toolset Icons PDF to provide visual cues and insights. Share and navigate important information on six stages that need your due attention. This template can be used to pitch topics like Analysis, Personalized Executive Dashboards, Data Layer. In addtion, this PPT design contains high resolution images, graphics, etc, that are easily editable and available for immediate download.
Shipment Tracking Solutions To Minimize Decline Of Sales Demonstration PDF
Following slide presents digital solutions for warehouse management that can be implemented by managers to streamline inventory management and reduce lost sales. Major solutions are radio frequency handheld device, dashboard, data analytics, trailer management etc. Persuade your audience using this Shipment Tracking Solutions To Minimize Decline Of Sales Demonstration PDF. This PPT design covers six stages, thus making it a great tool to use. It also caters to a variety of topics including Dashboard, Trailer Management, Advanced Solutions. Download this PPT design now to present a convincing pitch that not only emphasizes the topic but also showcases your presentation skills.

Financial Summary Ppt PowerPoint Presentation Information
This is a financial summary ppt powerpoint presentation information. This is a two stage process. The stages in this process are revenue and gross profit, quarterly revenue split, revenue spilt by geography, revenue split by product mix, revenue split by segment sector.
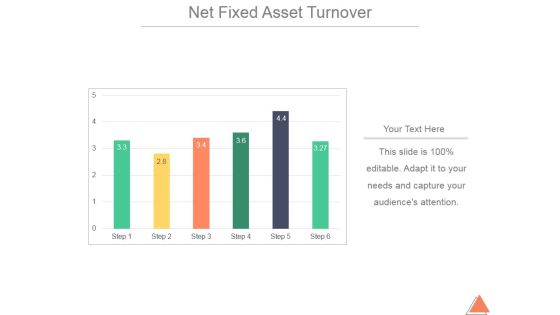
Net Fixed Asset Turnover Ppt PowerPoint Presentation Slide Download
This is a net fixed asset turnover ppt powerpoint presentation slide download. This is a one stage process. The stages in this process are business, marketing, finance, management, planning.
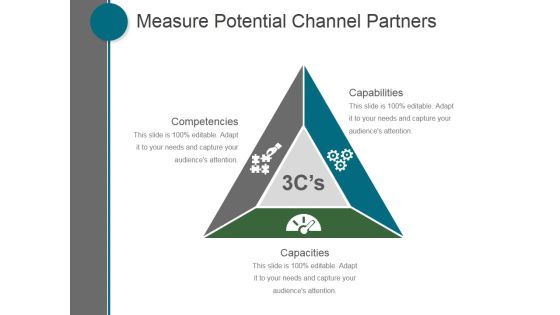
Measure Potential Channel Partners Template Ppt PowerPoint Presentation Show
This is a measure potential channel partners template ppt powerpoint presentation show. This is a three stage process. The stages in this process are capabilities, capacities, competencies.
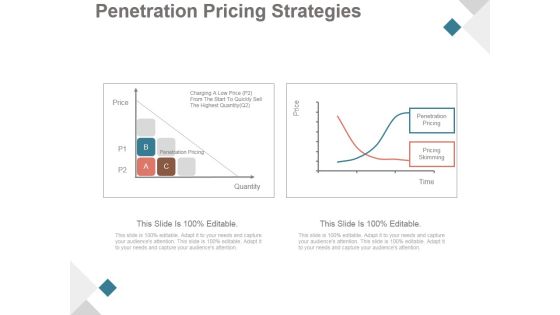
Penetration Pricing Strategies Ppt PowerPoint Presentation Slide
This is a penetration pricing strategies ppt powerpoint presentation slide. This is a two stage process. The stages in this process are penetration pricing, pricing skimming, quantity, price.

Taxonomy Of Service Process Ppt PowerPoint Presentation Designs
This is a taxonomy of service process ppt powerpoint presentation designs. This is a five stage process. The stages in this process are low service, agenda, high service.
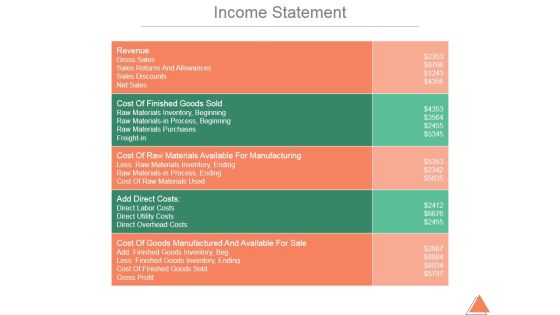
Income Statement Ppt PowerPoint Presentation Background Images
This is a income statement ppt powerpoint presentation background images. This is a five stage process. The stages in this process are revenue, gross sales, sales returns and allowances, sales discounts, net sales.
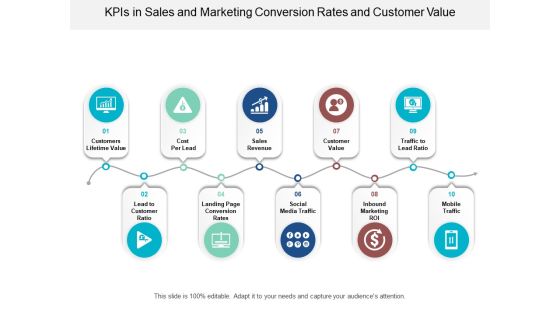
Kpis In Sales And Marketing Conversion Rates And Customer Value Ppt Powerpoint Presentation File Information
This is a kpis in sales and marketing conversion rates and customer value ppt powerpoint presentation file information. This is a ten stage process. The stages in this process are dashboard, kpi, metrics.

Customer Retention Kpis Brand Awareness And Lead Generation Ppt PowerPoint Presentation Outline Information
This is a customer retention kpis brand awareness and lead generation ppt powerpoint presentation outline information. This is a three stage process. The stages in this process are kpi proposal, kpi plan, kpi scheme.

Change Management Team Ppt PowerPoint Presentation Outline Information Cpb
This is a change management team ppt powerpoint presentation outline information cpb. This is a four stage process. The stages in this process are change management team.
Social Media Icons With Pie Charts For Marketing Analysis Ppt PowerPoint Presentation Ideas Example
This is a social media icons with pie charts for marketing analysis ppt powerpoint presentation ideas example. This is a six stage process. The stages in this process are kpi proposal, kpi plan, kpi scheme.

Departments Of Visualization Research Tableau As Visualization Research Tool Demonstration PDF
This slide shows the tableau visualization research tool in which users can construct and share interactive and editable dashboards that represent data in charts.Presenting Departments Of Visualization Research Tableau As Visualization Research Tool Demonstration PDF to provide visual cues and insights. Share and navigate important information on ten stages that need your due attention. This template can be used to pitch topics like Business Intelligence, Dashboards That Represent, Business Intelligence In addtion, this PPT design contains high resolution images, graphics, etc, that are easily editable and available for immediate download.
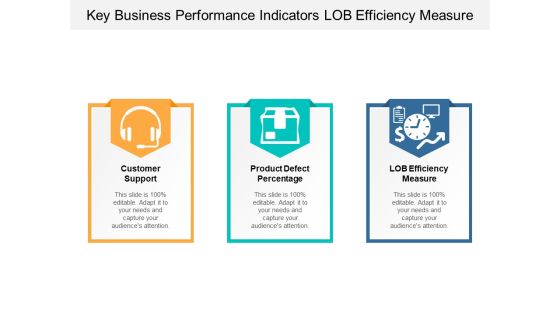
Key Business Performance Indicators Lob Efficiency Measure Ppt Powerpoint Presentation Infographics File Formats
This is a key business performance indicators lob efficiency measure ppt powerpoint presentation infographics file formats. This is a three stage process. The stages in this process are dashboard, kpi, metrics.
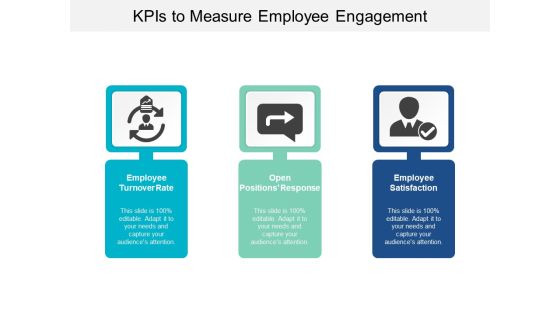
Kpis To Measure Employee Engagement Ppt Powerpoint Presentation Pictures Gridlines
This is a kpis to measure employee engagement ppt powerpoint presentation pictures gridlines. This is a three stage process. The stages in this process are dashboard, kpi, metrics.
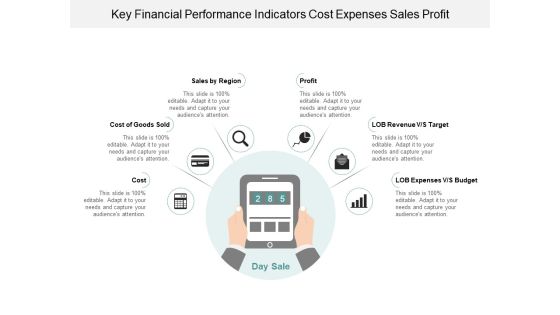
Key Financial Performance Indicators Cost Expenses Sales Profit Ppt Powerpoint Presentation Infographic Template Graphic Images
This is a key financial performance indicators cost expenses sales profit ppt powerpoint presentation infographic template graphic images. This is a six stage process. The stages in this process are dashboard, kpi, metrics.
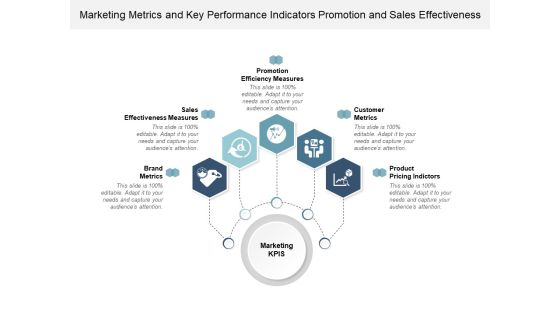
Marketing Metrics And Key Performance Indicators Promotion And Sales Effectiveness Ppt Powerpoint Presentation Infographics Graphics Example
This is a marketing metrics and key performance indicators promotion and sales effectiveness ppt powerpoint presentation infographics graphics example. This is a five stage process. The stages in this process are dashboard, kpi, metrics.

Availability Key Performance Indicator Inventory Turnover Ratio Ppt Powerpoint Presentation Layouts Graphics Download
This is a availability key performance indicator inventory turnover ratio ppt powerpoint presentation layouts graphics download. This is a two stage process. The stages in this process are availability kpi, availability dashboard, availability metrics.

Profitability Key Performance Indicators Financial Activities Cash Flow Ppt Powerpoint Presentation Portfolio Clipart Images
This is a profitability key performance indicators financial activities cash flow ppt powerpoint presentation portfolio clipart images. This is a five stage process. The stages in this process are dashboard, kpi, metrics.
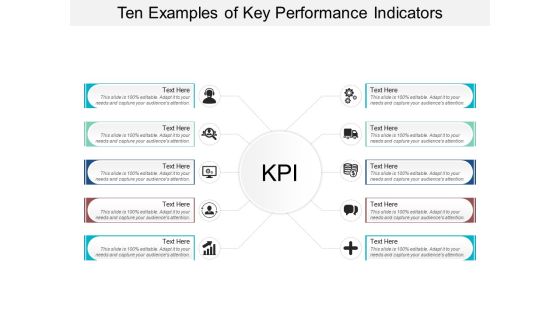
Ten Examples Of Key Performance Indicators Ppt Powerpoint Presentation Layouts Professional
This is a ten examples of key performance indicators ppt powerpoint presentation layouts professional. This is a ten stage process. The stages in this process are dashboard, kpi, metrics.

Kpis For Measuring Brand Marketing Communication Potential Share Ppt Powerpoint Presentation Layouts Infographics
This is a kpis for measuring brand marketing communication potential share ppt powerpoint presentation layouts infographics. This is a six stage process. The stages in this process are dashboard, kpi, metrics.
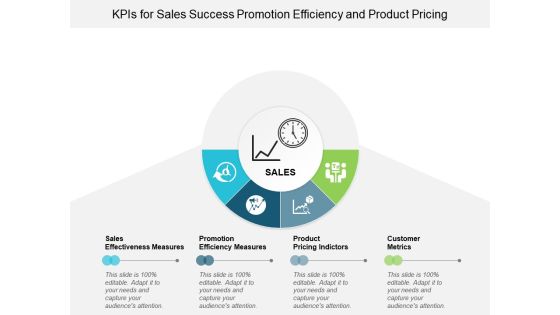
Kpis For Sales Success Promotion Efficiency And Product Pricing Ppt Powerpoint Presentation Infographics Background Images
This is a kpis for sales success promotion efficiency and product pricing ppt powerpoint presentation infographics background images. This is a four stage process. The stages in this process are dashboard, kpi, metrics.
Performance Indicators Of Business Icons Ppt Powerpoint Presentation Infographics Graphics Template
This is a performance indicators of business icons ppt powerpoint presentation infographics graphics template. This is a four stage process. The stages in this process are dashboard, kpi, metrics.
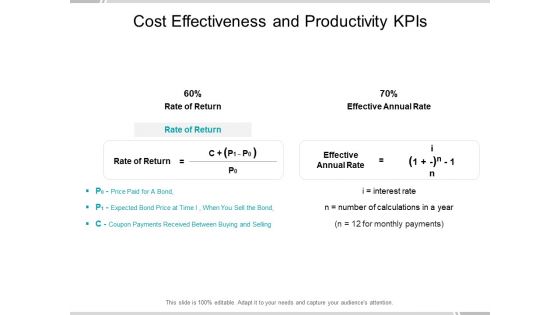
Cost Effectiveness And Productivity Kpis Ppt Powerpoint Presentation Portfolio Demonstration
This is a cost effectiveness and productivity kpis ppt powerpoint presentation portfolio demonstration. This is a two stage process. The stages in this process are availability kpi, availability dashboard, availability metrics.

Financial Kpis For Business Growth Liquidity Efficiency And Solvency Ppt Powerpoint Presentation Summary Gridlines
This is a financial kpis for business growth liquidity efficiency and solvency ppt powerpoint presentation summary gridlines. This is a seven stage process. The stages in this process are dashboard, kpi, metrics.

Customer Retention Kpis Lifetime Value And Acquisition Cost Ppt Powerpoint Presentation Model Samples
This is a customer retention kpis lifetime value and acquisition cost ppt powerpoint presentation model samples. This is a five stage process. The stages in this process are dashboard, kpi, metrics.

Customer Service Kpis Satisfied Customers And Churn Rate Ppt Powerpoint Presentation Pictures Template
This is a customer service kpis satisfied customers and churn rate ppt powerpoint presentation pictures template. This is a four stage process. The stages in this process are dashboard, kpi, metrics.
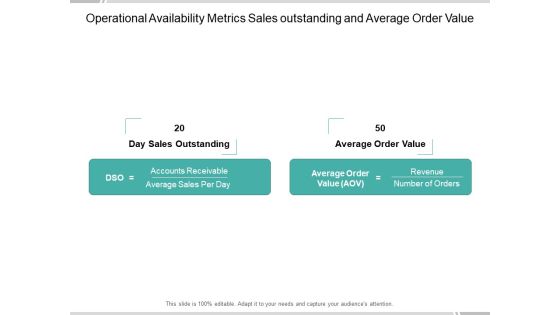
Operational Availability Metrics Sales Outstanding And Average Order Value Ppt Powerpoint Presentation Infographic Template Introduction
This is a operational availability metrics sales outstanding and average order value ppt powerpoint presentation infographic template introduction. This is a two stage process. The stages in this process are availability kpi, availability dashboard, availability metrics.

Business Strategic Performance Report Ppt Powerpoint Presentation Show Background Image
This is a business strategic performance report ppt powerpoint presentation show background image. This is a four stage process. The stages in this process are business metrics, business kpi, business dashboard.

Inventory Metrics Carrying Cost Order Inventory Delivered Unit Costs Ppt Powerpoint Presentation Layouts Guidelines
This is a inventory metrics carrying cost order inventory delivered unit costs ppt powerpoint presentation layouts guidelines. This is a two stage process. The stages in this process are availability kpi, availability dashboard, availability metrics.
Key Performance Indicator Vector Icon Ppt PowerPoint Presentationmodel Brochure
This is a key performance indicator vector icon ppt powerpoint presentationmodel brochure. This is a three stage process. The stages in this process are kpi proposal, kpi plan, kpi scheme.
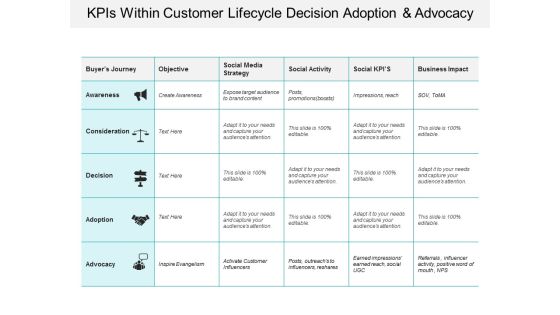
Kpis Within Customer Lifecycle Decision Adoption And Advocacy Ppt PowerPoint Presentation Infographic Template Graphics Design
This is a kpis within customer lifecycle decision adoption and advocacy ppt powerpoint presentation infographic template graphics design. This is a three stage process. The stages in this process are kpi proposal, kpi plan, kpi scheme.
Ecommerce Kpis Reach Act Convert Engage Ppt PowerPoint Presentation Icon
This is a ecommerce kpis reach act convert engage ppt powerpoint presentation icon. This is a five stage process. The stages in this process are kpi proposal, kpi plan, kpi scheme.
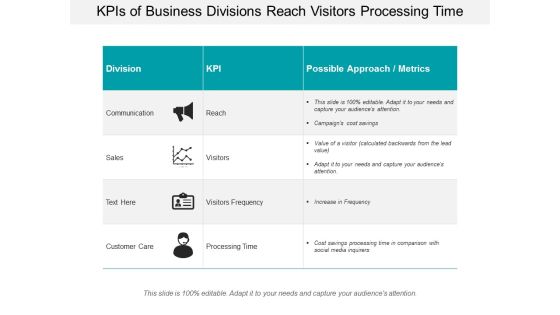
Kpis Of Business Divisions Reach Visitors Processing Time Ppt PowerPoint Presentation Slides Outfit
This is a kpis of business divisions reach visitors processing time ppt powerpoint presentation slides outfit. This is a three stage process. The stages in this process are kpi proposal, kpi plan, kpi scheme.

Sales Goals And Performance Kpis Influence Position And Protection Ppt PowerPoint Presentation Styles Inspiration
This is a sales goals and performance kpis influence position and protection ppt powerpoint presentation styles inspiration. This is a three stage process. The stages in this process are kpi proposal, kpi plan, kpi scheme.
KPI Metrics Vector Icon Ppt PowerPoint Presentation Layouts Slide
This is a kpi metrics vector icon ppt powerpoint presentation layouts slide. This is a three stage process. The stages in this process are kpi proposal, kpi plan, kpi scheme.

Warehousing Fulfilment Outsourced Sales Solutions Marketing Professional Organizations Ppt PowerPoint Presentation Slides Portfolio
This is a warehousing fulfilment outsourced sales solutions marketing professional organizations ppt powerpoint presentation slides portfolio. This is a two stage process. The stages in this process are warehousing fulfilment, outsourced sales solutions, marketing professional organizations.

Customer Satisfaction Levels Good Great Excellent Ppt PowerPoint Presentation Professional Deck
Presenting this set of slides with name customer satisfaction levels good great excellent ppt powerpoint presentation professional deck. This is a six stage process. The stages in this process are product quality, product improvement, rating scale. This is a completely editable PowerPoint presentation and is available for immediate download. Download now and impress your audience.

Customer Service Feedback Survey Ppt PowerPoint Presentation Outline Background Image
Presenting this set of slides with name customer service feedback survey ppt powerpoint presentation outline background image. This is a three stage process. The stages in this process are product quality, product improvement, rating scale. This is a completely editable PowerPoint presentation and is available for immediate download. Download now and impress your audience.
Emoji Reactions For Service Feedback Ppt PowerPoint Presentation Icon Brochure
Presenting this set of slides with name emoji reactions for service feedback ppt powerpoint presentation icon brochure. This is a five stage process. The stages in this process are product quality, product improvement, rating scale. This is a completely editable PowerPoint presentation and is available for immediate download. Download now and impress your audience.

Levels Of Customer Satisfaction Ppt PowerPoint Presentation Infographic Template Designs
Presenting this set of slides with name levels of customer satisfaction ppt powerpoint presentation infographic template designs. This is a five stage process. The stages in this process are product quality, product improvement, rating scale. This is a completely editable PowerPoint presentation and is available for immediate download. Download now and impress your audience.
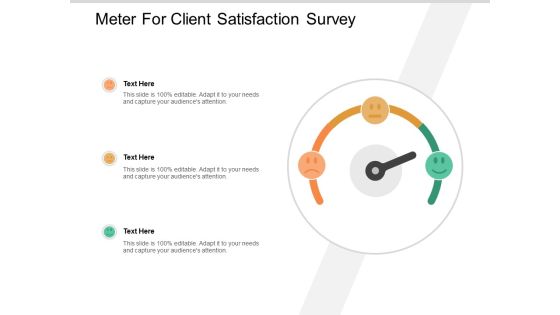
Meter For Client Satisfaction Survey Ppt PowerPoint Presentation Portfolio Outline
Presenting this set of slides with name meter for client satisfaction survey ppt powerpoint presentation portfolio outline. This is a three stage process. The stages in this process are product quality, product improvement, rating scale. This is a completely editable PowerPoint presentation and is available for immediate download. Download now and impress your audience.
Red Yellow Green Emoticons For Feedback Ppt PowerPoint Presentation Infographics Deck
Presenting this set of slides with name red yellow green emoticons for feedback ppt powerpoint presentation infographics deck. This is a three stage process. The stages in this process are product quality, product improvement, rating scale. This is a completely editable PowerPoint presentation and is available for immediate download. Download now and impress your audience.
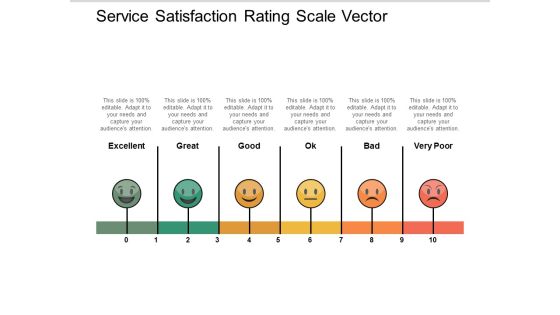
Service Satisfaction Rating Scale Vector Ppt PowerPoint Presentation Professional Background Image
Presenting this set of slides with name service satisfaction rating scale vector ppt powerpoint presentation professional background image. This is a six stage process. The stages in this process are product quality, product improvement, rating scale. This is a completely editable PowerPoint presentation and is available for immediate download. Download now and impress your audience.

Comparative Assessment Of Regulatory Compliance Report Services Clipart PDF
The following slide exhibits comparison of multiple regulatory report service providers. It provides information about dashboard, automation, data quality management, toolset, user oriented analysis, documentation, etc. Pitch your topic with ease and precision using this Comparative Assessment Of Regulatory Compliance Report Services Clipart PDF. This layout presents information on Financial Reporting Automation, Compliance Documentation, Data Quality Management. It is also available for immediate download and adjustment. So, changes can be made in the color, design, graphics or any other component to create a unique layout.

Project Requirements Traceability Matrix Strategy Diagrams PDF
This slide provides the glimpse about the requirements traceability table which focuses on project description, requestor, department, business justification, test strategy, etc. Deliver and pitch your topic in the best possible manner with this project requirements traceability matrix strategy diagrams pdf. Use them to share invaluable insights on dashboard, data, requirement, strategy and impress your audience. This template can be altered and modified as per your expectations. So, grab it now.
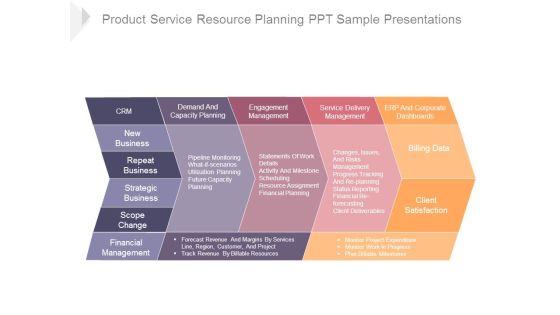
Product Service Resource Planning Ppt Sample Presentations
This is a product service resource planning ppt sample presentations. This is a five stage process. The stages in this process are scope change, strategic business, repeat business, new business, crm, demand and capacity planning, engagement management, service delivery management, erp and corporate dashboards, billing data, client satisfaction, financial management.
Empty Funds Finance PowerPoint Template 0610
Cash gauge on the dashboard approaching empty value

Tableau As Visualization Research Tool Inspiration PDF
This slide shows the tableau visualization research tool in which users can construct and share interactive and editable dashboards that represent data in charts. Find highly impressive Tableau As Visualization Research Tool Inspiration PDF on Slidegeeks to deliver a meaningful presentation. You can save an ample amount of time using these presentation templates. No need to worry to prepare everything from scratch because Slidegeeks experts have already done a huge research and work for you. You need to download Tableau As Visualization Research Tool Inspiration PDF for your upcoming presentation. All the presentation templates are 100 percent editable and you can change the color and personalize the content accordingly. Download now.

Branches For Visualization Research And Development Tableau As Visualization Research Introduction PDF
This slide shows the tableau visualization research tool in which users can construct and share interactive and editable dashboards that represent data in charts. This modern and well-arranged Branches For Visualization Research And Development Tableau As Visualization Research Introduction PDF provides lots of creative possibilities. It is very simple to customize and edit with the Powerpoint Software. Just drag and drop your pictures into the shapes. All facets of this template can be edited with Powerpoint, no extra software is necessary. Add your own material, put your images in the places assigned for them, adjust the colors, and then you can show your slides to the world, with an animated slide included.
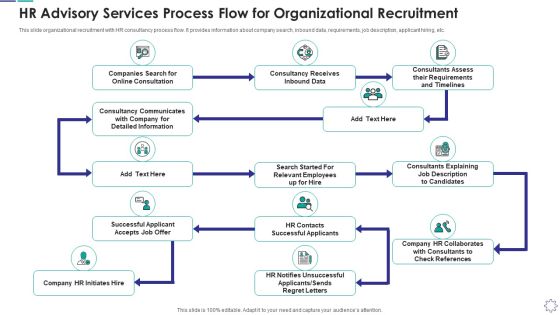
Online Consultation, Inbound Data, Successful Applicant, Detailed Information
This slide organizational recruitment with HR consultancy process flow. It provides information about company search, inbound data, requirements, job description, applicant hiring, etc. Pitch your topic with ease and precision using this hr advisory services process flow for organizational recruitment demonstration pdf. This layout presents information on online consultation, inbound data, successful applicant, detailed information. It is also available for immediate download and adjustment. So, changes can be made in the color, design, graphics or any other component to create a unique layout.
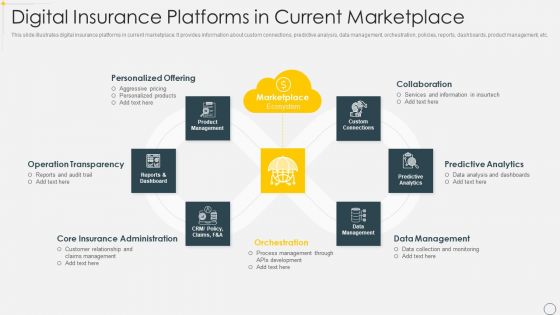
Digital Insurance Platforms In Current Marketplace Slides PDF
This slide illustrates digital insurance platforms in current marketplace. It provides information about custom connections, predictive analysis, data management, orchestration, policies, reports, dashboards, product management, etc. Persuade your audience using this Digital Insurance Platforms In Current Marketplace Slides PDF. This PPT design covers seven stages, thus making it a great tool to use. It also caters to a variety of topics including Operation Transparency, Personalized Offering, Data Management. Download this PPT design now to present a convincing pitch that not only emphasizes the topic but also showcases your presentation skills.
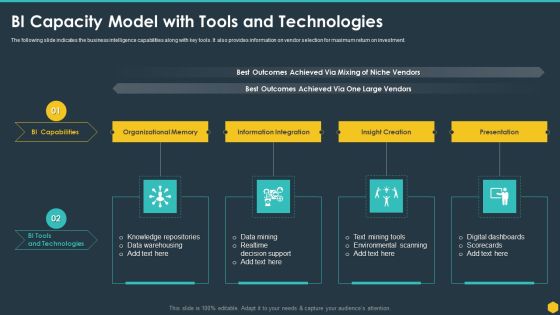
BI Capacity Model With Tools And Technologies BI Transformation Toolset Guidelines PDF
The following slide indicates the business intelligence capabilities along with key tools. It also provides information on vendor selection for maximum return on investment. This is a BI Capacity Model With Tools And Technologies BI Transformation Toolset Guidelines PDF template with various stages. Focus and dispense information on four stages using this creative set, that comes with editable features. It contains large content boxes to add your information on topics like Data Warehousing, Data Mining, Environmental Scanning, Digital Dashboards. You can also showcase facts, figures, and other relevant content using this PPT layout. Grab it now.

BI System To Enhance Processes With Olap Cubes Ppt Ideas Example Introduction PDF
This slide shows BI architecture with OLAP cubes. It provides information such as enterprise resource planning ERP, extract transform load ETL, data warehouse, end user interface, dashboard, etc. Showcasing this set of slides titled BI System To Enhance Processes With Olap Cubes Ppt Ideas Example Introduction PDF. The topics addressed in these templates are Data Warehouse, End User Interface, External Sources. All the content presented in this PPT design is completely editable. Download it and make adjustments in color, background, font etc. as per your unique business setting.

Cognitive Enhancement Augmented Intelligence Information Tracking Inspiration PDF
This slide depicts the information tracking dashboard by augmented intelligence model covering the data analysis. Data analysis includes image analysis, storage size, new users on the cloud platform, etc. Here you can discover an assortment of the finest PowerPoint and Google Slides templates. With these templates, you can create presentations for a variety of purposes while simultaneously providing your audience with an eye catching visual experience. Download Cognitive Enhancement Augmented Intelligence Information Tracking Inspiration PDF to deliver an impeccable presentation. These templates will make your job of preparing presentations much quicker, yet still, maintain a high level of quality. Slidegeeks has experienced researchers who prepare these templates and write high quality content for you. Later on, you can personalize the content by editing the Cognitive Enhancement Augmented Intelligence Information Tracking Inspiration PDF.

Functional Architecture For Multi Cloud Management Computing Platform And Technologies Clipart PDF
This slide exhibits multi cloud management platform architecture. It includes web application, admin dashboard, API services, data storage, cloud connectors etc. Pitch your topic with ease and precision using this functional architecture for multi cloud management computing platform and technologies clipart pdf. This layout presents information on web application, admin dashboard, api services, cost analytics, automatic technology. It is also available for immediate download and adjustment. So, changes can be made in the color, design, graphics or any other component to create a unique layout.
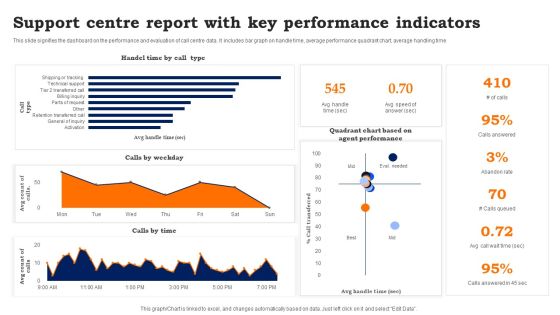
Support Centre Report With Key Performance Indicators Information PDF
This slide signifies the dashboard on the performance and evaluation of call centre data. It includes bar graph on handle time, average performance quadrant chart, average handling time. Showcasing this set of slides titled Support Centre Report With Key Performance Indicators Information PDF. The topics addressed in these templates are Support Centre Report, Key Performance Indicators. All the content presented in this PPT design is completely editable. Download it and make adjustments in color, background, font etc. as per your unique business setting.
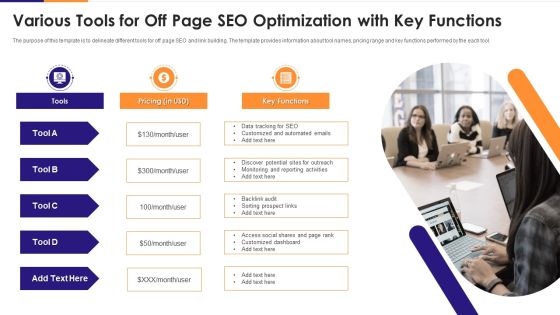
Various Tools For Off Page SEO Optimization With Key Functions Inspiration PDF
The purpose of this template is to delineate different tools for off page SEO and link building. The template provides information about tool names, pricing range and key functions performed by the each tool. Presenting various tools for off page seo optimization with key functions inspiration pdf to dispense important information. This template comprises one stages. It also presents valuable insights into the topics including potential, dashboard, data. This is a completely customizable PowerPoint theme that can be put to use immediately. So, download it and address the topic impactfully.

Financial Charts And Graphs For Statistical Analysis Ppt Powerpoint Presentation Show Layout
This is a financial charts and graphs for statistical analysis ppt powerpoint presentation show layout. This is a four stage process. The stages in this process are business metrics, business kpi, business dashboard.

Essentials Of Statistics For Business And Economics Ppt Powerpoint Presentation Pictures Styles
This is a essentials of statistics for business and economics ppt powerpoint presentation pictures styles. This is a three stage process. The stages in this process are business metrics, business kpi, business dashboard.
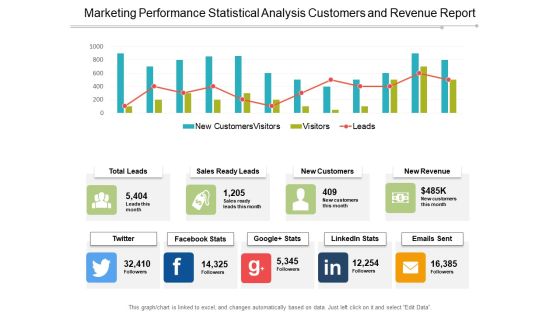
Marketing Performance Statistical Analysis Customers And Revenue Report Ppt PowerPoint Presentation Outline Shapes
This is a marketing performance statistical analysis customers and revenue report ppt powerpoint presentation outline shapes. This is a four stage process. The stages in this process are marketing analytics, marketing performance, marketing discovery.
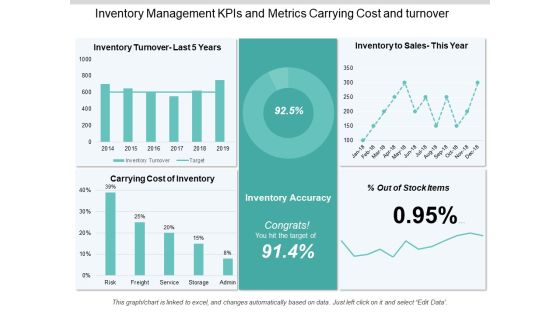
Inventory Management Kpis And Metrics Carrying Cost And Turnover Ppt PowerPoint Presentation Information
This is a inventory management kpis and metrics carrying cost and turnover ppt powerpoint presentation information. This is a five stage process. The stages in this process are logistics performance, logistics dashboard, logistics kpis.

Bar Chart With Magnifying Glass For Financial Analysis Ppt Powerpoint Presentation Infographics Designs Download
This is a bar chart with magnifying glass for financial analysis ppt powerpoint presentation infographics designs download. This is a three stage process. The stages in this process are business metrics, business kpi, business dashboard.
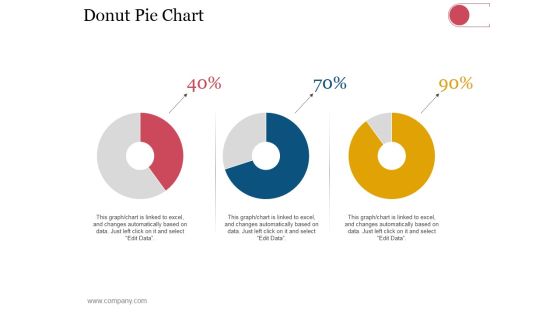
Donut Pie Chart Ppt PowerPoint Presentation Infographics Outfit
This is a donut pie chart ppt powerpoint presentation infographics outfit. This is a three stage process. The stages in this process are business, strategy, analysis, planning, dashboard, finance.
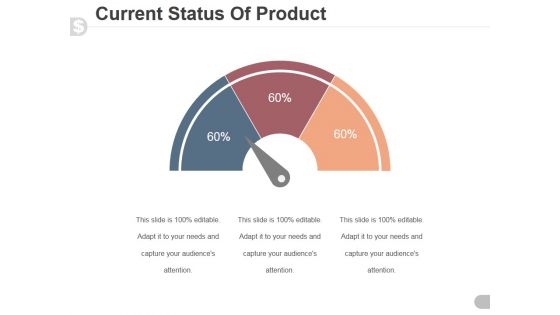
Current Status Of Product Ppt PowerPoint Presentation Designs Download
This is a current status of product ppt powerpoint presentation designs download. This is a three stage process. The stages in this process are speedometer, dashboard, business, marketing, finance.
Product Launch Vector Icon Ppt PowerPoint Presentation Icon Information
Presenting this set of slides with name product launch vector icon ppt powerpoint presentation icon information. This is a two stage process. The stages in this process are product launch vector icon. This is a completely editable PowerPoint presentation and is available for immediate download. Download now and impress your audience.
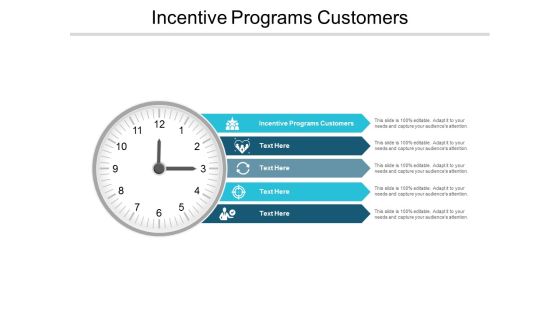
Incentive Programs Customers Ppt PowerPoint Presentation Slides Information Cpb
Presenting this set of slides with name incentive programs customers ppt powerpoint presentation slides information cpb. This is an editable Powerpoint five stages graphic that deals with topics like incentive programs customers to help convey your message better graphically. This product is a premium product available for immediate download and is 100 percent editable in Powerpoint. Download this now and use it in your presentations to impress your audience.
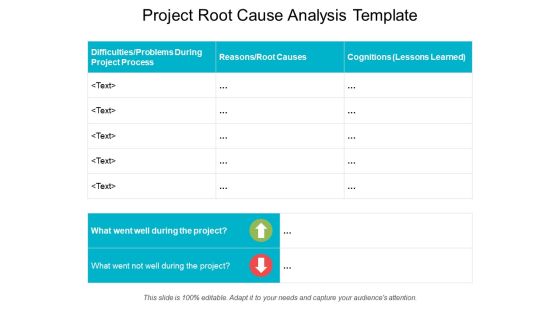
Project Root Cause Analysis Template Ppt PowerPoint Presentation Professional Show
This is a project root cause analysis template ppt powerpoint presentation professional show. This is a three stage process. The stages in this process are project analysis, project review, project performance management.

Worldwide Market Trends Mobile With Bar Graph And Globe Ppt PowerPoint Presentation Styles Demonstration
This is a worldwide market trends mobile with bar graph and globe ppt powerpoint presentation styles demonstration. This is a four stage process. The stages in this process are marketing analytics, marketing performance, marketing discovery.
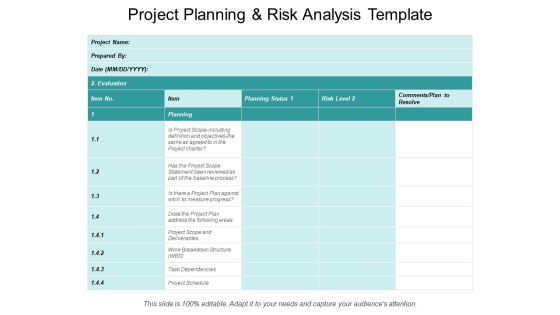
Project Planning And Risk Analysis Template Ppt PowerPoint Presentation Styles Layout Ideas
This is a project planning and risk analysis template ppt powerpoint presentation styles layout ideas. This is a five stage process. The stages in this process are project analysis, project review, project performance management.

Financial Analysis Vector Bar Graph With Magnifying Glass Ppt PowerPoint Presentation Gallery Design Ideas
This is a financial analysis vector bar graph with magnifying glass ppt powerpoint presentation gallery design ideas. This is a four stage process. The stages in this process are marketing analytics, marketing performance, marketing discovery.
Marketing Analysis Tools Roi And Budget Optimization Ppt PowerPoint Presentation Icon Show
This is a marketing analysis tools roi and budget optimization ppt powerpoint presentation icon show. This is a six stage process. The stages in this process are marketing analytics, marketing performance, marketing discovery.

Core Tools And Techniques Used In DSDM Timeboxing Ppt File Inspiration PDF Wd Ppt Icon Graphics Example PDF
This slide portrays details about core tools and techniques used in dynamic system development model. Here the technique covered is Timeboxing along with its benefits. This is a core tools and techniques used in dsdm timeboxing ppt file inspiration pdf template with various stages. Focus and dispense information on two stages using this creative set, that comes with editable features. It contains large content boxes to add your information on topics like core tools and techniques used in dsdm timeboxing. You can also showcase facts, figures, and other relevant content using this PPT layout. Grab it now.

Financial Highlights Template 1 Ppt PowerPoint Presentation Slides
This is a financial highlights template 1 ppt powerpoint presentation slides. This is a two stage process. The stages in this process are sales, operating expenses, operating income, net income.
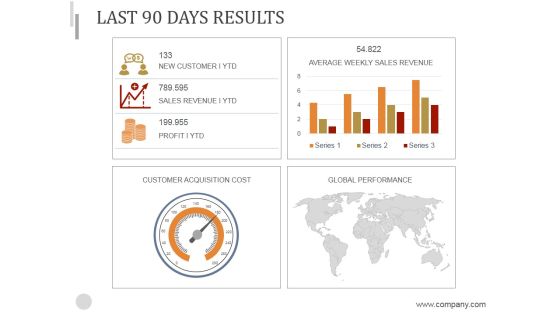
Last 90 Days Results Ppt PowerPoint Presentation Background Image
This is a last 90 days results ppt powerpoint presentation background image. This is a four stage process. The stages in this process are customer acquisition cost, global performance, average weekly sales revenue.
Website Performance Review Ppt PowerPoint Presentation Icon Deck
This is a website performance review ppt powerpoint presentation icon deck. This is a three stage process. The stages in this process are conversion rate, average visit value goal, visits.
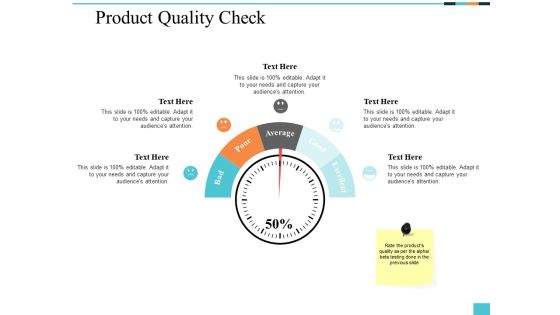
Product Quality Check Ppt PowerPoint Presentation Model Microsoft
This is a product quality check ppt powerpoint presentation model microsoft. This is a five stage process. The stages in this process are finance, marketing, management, investment, analysis.

Project Health Card Scheduling And Resourcing Ppt PowerPoint Presentation Styles Tips
This is a project health card scheduling and resourcing ppt powerpoint presentation styles tips. This is a six stage process. The stages in this process are project analysis, project review, project performance management.

Project Issues Management And Actions Planning Ppt PowerPoint Presentation File Outfit
This is a project issues management and actions planning ppt powerpoint presentation file outfit. This is a five stage process. The stages in this process are project analysis, project review, project performance management.
Project Progress Planning Template Ppt PowerPoint Presentation Icon Guide
This is a project progress planning template ppt powerpoint presentation icon guide. This is a four stage process. The stages in this process are project analysis, project review, project performance management.

Project Status Time Cost Budget Ppt PowerPoint Presentation Ideas Outline
This is a project status time cost budget ppt powerpoint presentation ideas outline. This is a four stage process. The stages in this process are project analysis, project review, project performance management.
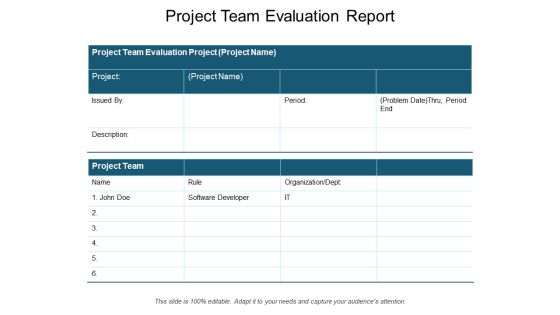
Project Team Evaluation Report Ppt PowerPoint Presentation File Diagrams
This is a project team evaluation report ppt powerpoint presentation file diagrams. This is a four stage process. The stages in this process are project analysis, project review, project performance management.
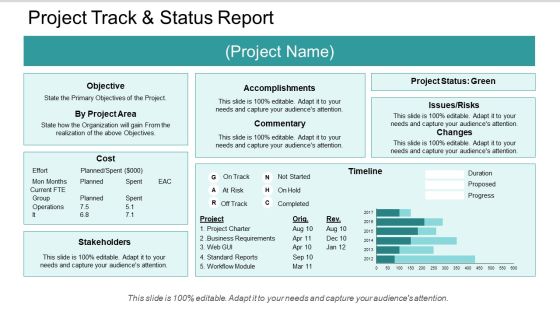
Project Track And Status Report Ppt PowerPoint Presentation Portfolio Designs Download

Four Steps Of Project Performance Scope Of Work Quality And Satisfaction Ppt PowerPoint Presentation Infographic Template Pictures
This is a four steps of project performance scope of work quality and satisfaction ppt powerpoint presentation infographic template pictures. This is a five stage process. The stages in this process are project dashboard, project kpis, project metrics.

Kpis In Shipping Perfect Order Rate And On Time Shipment Ppt PowerPoint Presentation Show Guide
This is a kpis in shipping perfect order rate and on time shipment ppt powerpoint presentation show guide. This is a six stage process. The stages in this process are logistics performance, logistics dashboard, logistics kpis.
Logistics Kpis And Metrics Percentage Of Orders Delivered Ppt PowerPoint Presentation Icon
This is a logistics kpis and metrics percentage of orders delivered ppt powerpoint presentation icon. This is a five stage process. The stages in this process are logistics performance, logistics dashboard, logistics kpis.
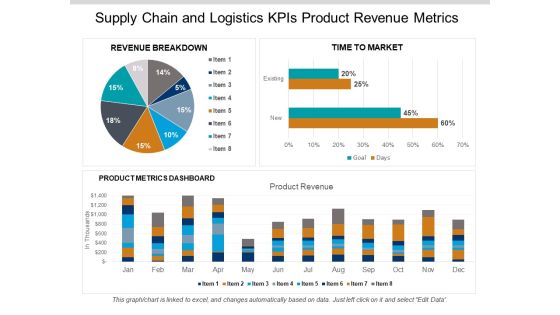
Supply Chain And Logistics Kpis Product Revenue Metrics Ppt PowerPoint Presentation Gallery Aids
This is a supply chain and logistics kpis product revenue metrics ppt powerpoint presentation gallery aids. This is a three stage process. The stages in this process are logistics performance, logistics dashboard, logistics kpis.

Calculator With Business Reports For Operational Efficiency Ppt Powerpoint Presentation Ideas Infographic Template
This is a calculator with business reports for operational efficiency ppt powerpoint presentation ideas infographic template. This is a four stage process. The stages in this process are business metrics, business kpi, business dashboard.
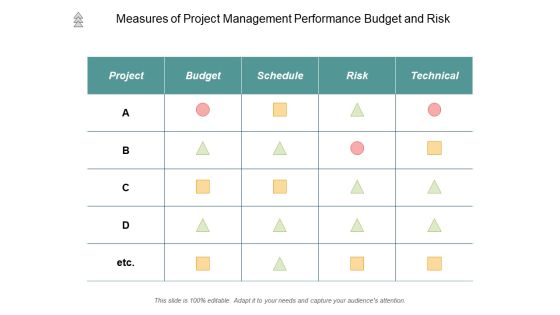
Measures Of Project Management Performance Budget And Risk Ppt PowerPoint Presentation Outline Graphics Design
This is a measures of project management performance budget and risk ppt powerpoint presentation outline graphics design. This is a four stage process. The stages in this process are project dashboard, project kpis, project metrics.
 Home
Home