Data Dashboard
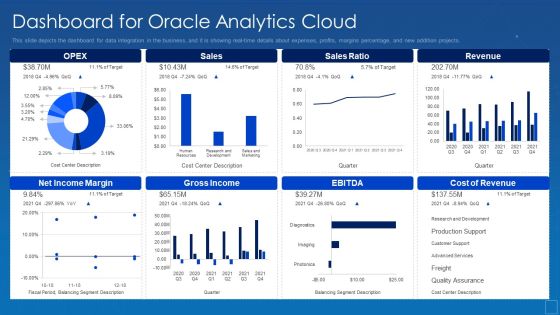
Oracle Cloud Data Analytics Administration IT Dashboard For Oracle Analytics Cloud Sample PDF
This slide depicts the dashboard for data integration in the business, and it is showing real-time details about expenses, profits, margins percentage, and new addition projects. Deliver an awe inspiring pitch with this creative oracle cloud data analytics administration it dashboard for oracle analytics cloud sample pdf bundle. Topics like dashboard for oracle analytics cloud can be discussed with this completely editable template. It is available for immediate download depending on the needs and requirements of the user.
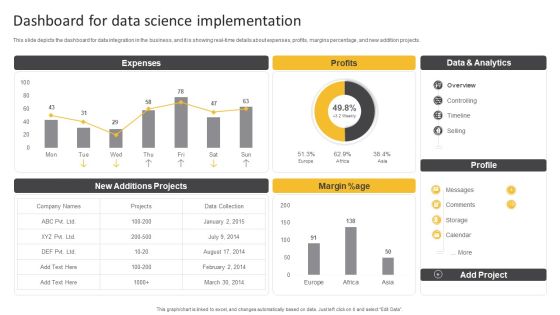
Information Science Dashboard For Data Science Implementation Ppt PowerPoint Presentation Slides Maker PDF
This slide depicts the dashboard for data integration in the business, and it is showing real-time details about expenses, profits, margins percentage, and new addition projects.Deliver and pitch your topic in the best possible manner with this Information Science Dashboard For Data Science Implementation Ppt PowerPoint Presentation Slides Maker PDF. Use them to share invaluable insights on Expenses, Data Analytics, New Projects and impress your audience. This template can be altered and modified as per your expectations. So, grab it now.
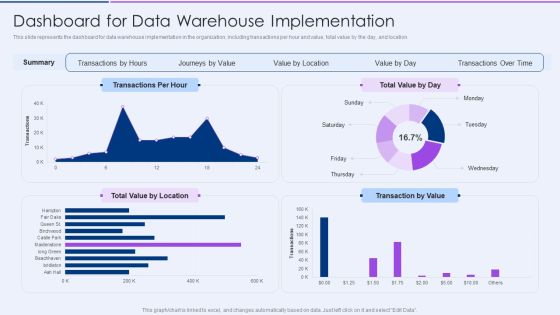
Executive Information Database System Dashboard For Data Warehouse Implementation Ideas PDF
This slide represents the dashboard for data warehouse implementation in the organization, including transactions per hour and value, total value by the day, and location.Deliver and pitch your topic in the best possible manner with this Executive Information Database System Dashboard For Data Warehouse Implementation Ideas PDF. Use them to share invaluable insights on Transactions Time, Value Location, Journeys Value and impress your audience. This template can be altered and modified as per your expectations. So, grab it now.
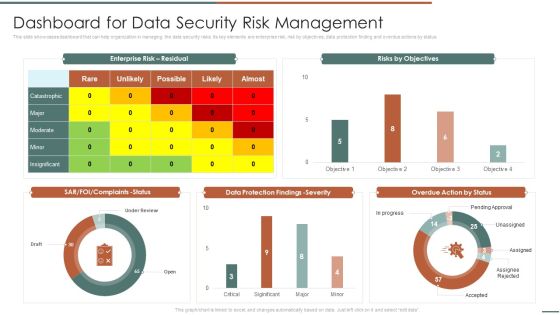
Information Security Risk Evaluation Dashboard For Data Security Risk Management Template PDF
This slide showcases dashboard that can help organization in managing the data security risks. Its key elements are enterprise risk, risk by objectives, data protection finding and overdue actions by status.Deliver an awe inspiring pitch with this creative Information Security Risk Evaluation Dashboard For Data Security Risk Management Template PDF bundle. Topics like Complaints Status, Protection Findings, Overdue Action can be discussed with this completely editable template. It is available for immediate download depending on the needs and requirements of the user.
Marketers Guide To Data Analysis Optimization KPI Dashboard For Tracking Email Marketing Campaign Infographics PDF
This slide covers the dashboard for analyzing email marketing metrics such as overall open rate, click-through rate, click-to-open ratio, unsubscribe rate, hard bounce rate, soft rate, monthly open rate, total monthly subscribers, etc. Presenting this PowerPoint presentation, titled Marketers Guide To Data Analysis Optimization KPI Dashboard For Tracking Email Marketing Campaign Infographics PDF, with topics curated by our researchers after extensive research. This editable presentation is available for immediate download and provides attractive features when used. Download now and captivate your audience. Presenting this Marketers Guide To Data Analysis Optimization KPI Dashboard For Tracking Email Marketing Campaign Infographics PDF. Our researchers have carefully researched and created these slides with all aspects taken into consideration. This is a completely customizable Marketers Guide To Data Analysis Optimization KPI Dashboard For Tracking Email Marketing Campaign Infographics PDF that is available for immediate downloading. Download now and make an impact on your audience. Highlight the attractive features available with our PPTs.
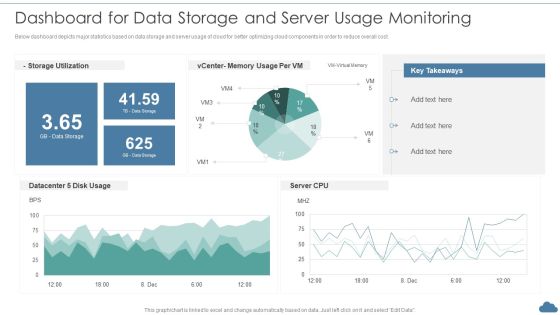
Cloud Optimization Infrastructure Model Dashboard For Data Storage And Server Usage Monitoring Rules PDF
Below dashboard depicts major statistics based on data storage and server usage of cloud for better optimizing cloud components in order to reduce overall cost.Deliver an awe inspiring pitch with this creative Cloud Optimization Infrastructure Model Dashboard For Data Storage And Server Usage Monitoring Rules PDF bundle. Topics like Storage Utilization, Key Takeaways, Datacenter can be discussed with this completely editable template. It is available for immediate download depending on the needs and requirements of the user.
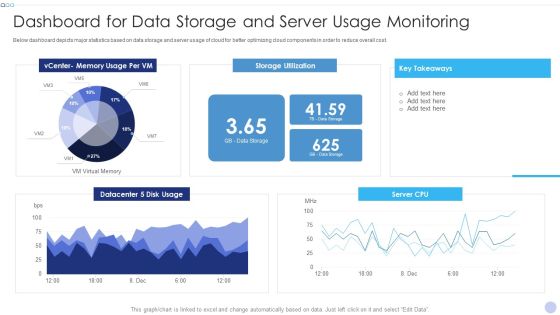
Techniques To Implement Cloud Infrastructure Dashboard For Data Storage And Server Usage Monitoring Mockup PDF
Below dashboard depicts major statistics based on data storage and server usage of cloud for better optimizing cloud components in order to reduce overall cost.Deliver an awe inspiring pitch with this creative Techniques To Implement Cloud Infrastructure Dashboard For Data Storage And Server Usage Monitoring Mockup PDF bundle. Topics like Storage Utilization, Key Takeaways, Center Memory can be discussed with this completely editable template. It is available for immediate download depending on the needs and requirements of the user.
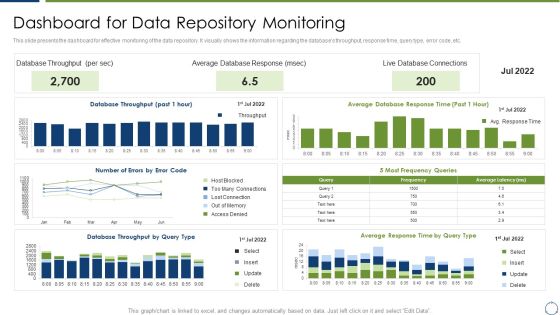
Horizontal Scaling Technique For Information Dashboard For Data Repository Monitoring Designs PDF
This slide presents the dashboard for effective monitoring of the data repository. It visually shows the information regarding the databases throughput, response time, query type, error code, etc.Deliver an awe inspiring pitch with this creative Horizontal Scaling Technique For Information Dashboard For Data Repository Monitoring Designs PDF bundle. Topics like Database Throughput, Average Database Response, Database Connections can be discussed with this completely editable template. It is available for immediate download depending on the needs and requirements of the user.

Data Project Lifecycle Management Dashboard To Ensure Better Decision Making Icons PDF
This slide covers data lifecycle management dashboard to ensure better decision making. It involves details such as capacity based on department, classification of files and email audit.Showcasing this set of slides titled Data Project Lifecycle Management Dashboard To Ensure Better Decision Making Icons PDF. The topics addressed in these templates are Redudant Content, Abandoned Files, Capacity Department. All the content presented in this PPT design is completely editable. Download it and make adjustments in color, background, font etc. as per your unique business setting.

Modern Security Observation Plan To Eradicate Cybersecurity Risk And Data Breach Security Monitoring Dashboard Sample PDF
Deliver an awe inspiring pitch with this creative modern security observation plan to eradicate cybersecurity risk and data breach security monitoring dashboard sample pdf bundle. Topics like security monitoring dashboard with application control and operating system statistics can be discussed with this completely editable template. It is available for immediate download depending on the needs and requirements of the user.
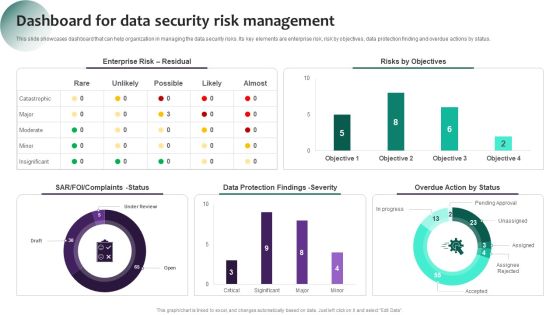
Information Systems Security And Risk Management Plan Dashboard For Data Security Risk Management Information PDF
This slide showcases dashboard that can help organization in managing the data security risks. Its key elements are enterprise risk, risk by objectives, data protection finding and overdue actions by status. If you are looking for a format to display your unique thoughts, then the professionally designed Information Systems Security And Risk Management Plan Dashboard For Data Security Risk Management Information PDF is the one for you. You can use it as a Google Slides template or a PowerPoint template. Incorporate impressive visuals, symbols, images, and other charts. Modify or reorganize the text boxes as you desire. Experiment with shade schemes and font pairings. Alter, share or cooperate with other people on your work. Download Information Systems Security And Risk Management Plan Dashboard For Data Security Risk Management Information PDF and find out how to give a successful presentation. Present a perfect display to your team and make your presentation unforgettable.
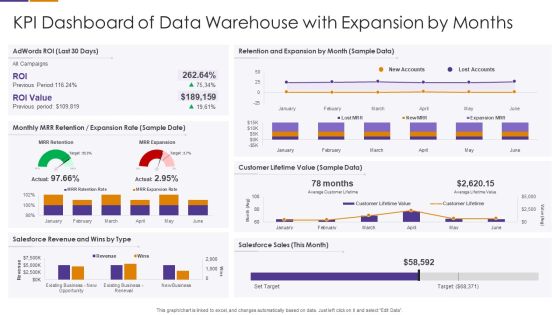
KPI Dashboard Of Data Warehouse With Expansion By Months Themes PDF
Showcasing this set of slides titled KPI Dashboard Of Data Warehouse With Expansion By Months Themes PDF The topics addressed in these templates are Customer Lifetime Value, Salesforce Revenue, Retention And Expansion All the content presented in this PPT design is completely editable. Download it and make adjustments in color, background, font etc. as per your unique business setting.
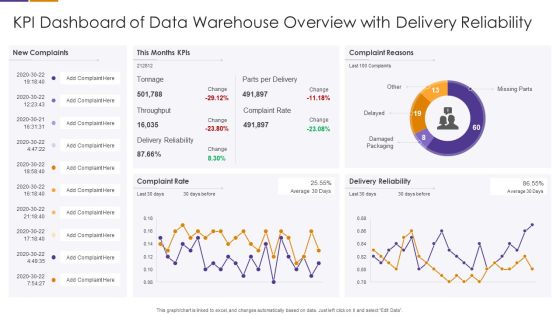
KPI Dashboard Of Data Warehouse Overview With Delivery Reliability Clipart PDF
Pitch your topic with ease and precision using this KPI Dashboard Of Data Warehouse Overview With Delivery Reliability Clipart PDF This layout presents information on Delivery Reliability, Complaint Reasons, Delivery Reliability Retention And Expansion It is also available for immediate download and adjustment. So, changes can be made in the color, design, graphics or any other component to create a unique layout.

AIM Principles For Data Storage Application Cost Dashboard Ppt Icon Diagrams PDF
Deliver an awe inspiring pitch with this creative aim principles for data storage application cost dashboard ppt icon diagrams pdf bundle. Topics like investment, department, budget, cost, comparison can be discussed with this completely editable template. It is available for immediate download depending on the needs and requirements of the user.
Information Security Compliance Dashboard Of Data Security Ppt Icon Vector PDF
This slide depicts the data security compliance report on how data and hardware are monitored in different categories such as standard, regulation, and asset type control. Deliver an awe inspiring pitch with this creative information security compliance dashboard of data security ppt icon vector pdf bundle. Topics like asset type control, control issues by standard, control issues by regulation can be discussed with this completely editable template. It is available for immediate download depending on the needs and requirements of the user.

Database Expansion And Optimization Dashboard For Data Repository Monitoring Ppt Model Infographic Template
This slide presents the dashboard for effective monitoring of the data repository. It visually shows the information regarding the databases throughput, response time, query type, error code, etc. Deliver and pitch your topic in the best possible manner with this database expansion and optimization dashboard for data repository monitoring ppt model infographic template. Use them to share invaluable insights on database throughput, average database response, live database connections and impress your audience. This template can be altered and modified as per your expectations. So, grab it now.
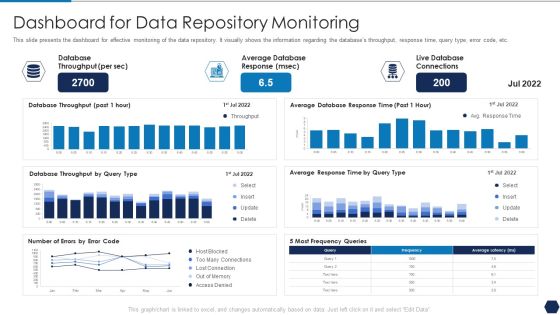
Tactical Plan For Upgrading DBMS Dashboard For Data Repository Monitoring Diagrams PDF
This slide presents the dashboard for effective monitoring of the data repository. It visually shows the information regarding the databases throughput, response time, query type, error code, etc. Deliver and pitch your topic in the best possible manner with this tactical plan for upgrading dbms dashboard for data repository monitoring diagrams pdf. Use them to share invaluable insights on database throughput, average database response, live database connections and impress your audience. This template can be altered and modified as per your expectations. So, grab it now.
Marketers Guide To Data Analysis Optimization KPI Dashboard For Tracking Paid Ad Campaign Performance Clipart PDF
This slide covers the dashboard for analyzing paid search metrics such as ad cost, clicks, impressions, click-through rate, cost per conversion, conversion rate, cost per click, etc. Here you can discover an assortment of the finest PowerPoint and Google Slides templates. With these templates, you can create presentations for a variety of purposes while simultaneously providing your audience with an eye catching visual experience. Download Marketers Guide To Data Analysis Optimization KPI Dashboard For Tracking Paid Ad Campaign Performance Clipart PDF to deliver an impeccable presentation. These templates will make your job of preparing presentations much quicker, yet still, maintain a high level of quality. Slidegeeks has experienced researchers who prepare these templates and write high quality content for you. Later on, you can personalize the content by editing the Marketers Guide To Data Analysis Optimization KPI Dashboard For Tracking Paid Ad Campaign Performance Clipart PDF.

Data Safety Initiatives KPI Dashboard To Track Security Risk Events Portrait PDF
This slide displays KPI dashboard that company will use to track multiple risk events. Metrics covered in the dashboard are residual risks by period and risk category by total risk rating. Deliver and pitch your topic in the best possible manner with this data safety initiatives kpi dashboard to track security risk events portrait pdf. Use them to share invaluable insights on risk category, total risk rating, residual risk by period, technology risk and impress your audience. This template can be altered and modified as per your expectations. So, grab it now.

PIM Software Deployment To Enhance Conversion Rates Product Information Dashboard Representing Data Quality Statistics Download PDF
This slide represents the KPI dashboard representing PIM data quality statistics. It includes details related to top users, channels, number of entities created etc. Coming up with a presentation necessitates that the majority of the effort goes into the content and the message you intend to convey. The visuals of a PowerPoint presentation can only be effective if it supplements and supports the story that is being told. Keeping this in mind our experts created PIM Software Deployment To Enhance Conversion Rates Product Information Dashboard Representing Data Quality Statistics Download PDF to reduce the time that goes into designing the presentation. This way, you can concentrate on the message while our designers take care of providing you with the right template for the situation.
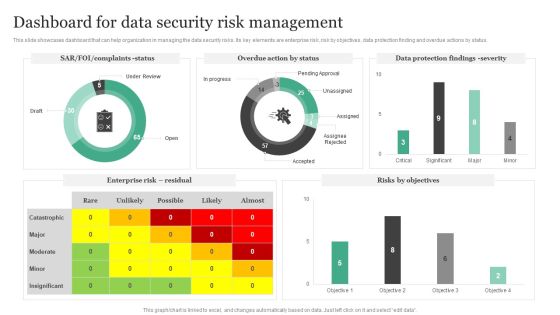
Dashboard For Data Security Risk Management Information Security Risk Administration Formats PDF
This slide showcases dashboard that can help organization in managing the data security risks. Its key elements are enterprise risk, risk by objectives, data protection finding and overdue actions by status.Slidegeeks is one of the best resources for PowerPoint templates. You can download easily and regulate Dashboard For Data Security Risk Management Information Security Risk Administration Formats PDF for your personal presentations from our wonderful collection. A few clicks is all it takes to discover and get the most relevant and appropriate templates. Use our Templates to add a unique zing and appeal to your presentation and meetings. All the slides are easy to edit and you can use them even for advertisement purposes.
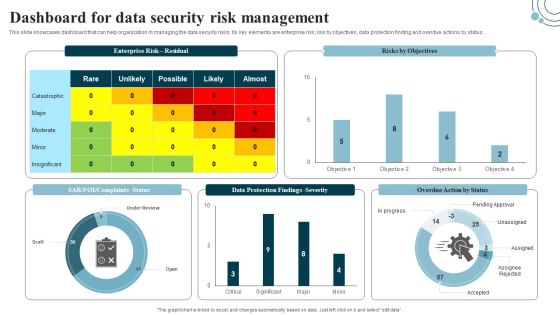
Developing IT Security Strategy Dashboard For Data Security Risk Management Pictures PDF
This slide showcases dashboard that can help organization in managing the data security risks. Its key elements are enterprise risk, risk by objectives, data protection finding and overdue actions by status. Slidegeeks has constructed Developing IT Security Strategy Dashboard For Data Security Risk Management Pictures PDF after conducting extensive research and examination. These presentation templates are constantly being generated and modified based on user preferences and critiques from editors. Here, you will find the most attractive templates for a range of purposes while taking into account ratings and remarks from users regarding the content. This is an excellent jumping-off point to explore our content and will give new users an insight into our top-notch PowerPoint Templates.
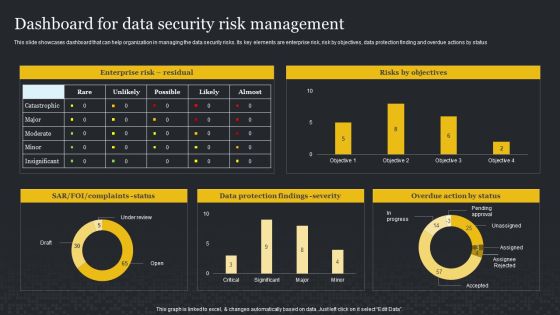
Dashboard For Data Security Risk Management Cybersecurity Risk Assessment Template PDF
This slide showcases dashboard that can help organization in managing the data security risks. Its key elements are enterprise risk, risk by objectives, data protection finding and overdue actions by status. Welcome to our selection of the Dashboard For Data Security Risk Management Cybersecurity Risk Assessment Template PDF. These are designed to help you showcase your creativity and bring your sphere to life. Planning and Innovation are essential for any business that is just starting out. This collection contains the designs that you need for your everyday presentations. All of our PowerPoints are 100 parcent editable, so you can customize them to suit your needs. This multi-purpose template can be used in various situations. Grab these presentation templates today.
Marketers Guide To Data Analysis Optimization KPI Dashboard For Tracking SEO Analytics Template PDF
This slide covers the KPI dashboard for analyzing SEO metrics such as authority score, organic traffic, organic keywords, paid keywords, ref. Domains, site audit, link-building tool, organic traffic, on-page SEO checker, backlink audit, etc. This Marketers Guide To Data Analysis Optimization KPI Dashboard For Tracking SEO Analytics Template PDF from Slidegeeks makes it easy to present information on your topic with precision. It provides customization options, so you can make changes to the colors, design, graphics, or any other component to create a unique layout. It is also available for immediate download, so you can begin using it right away. Slidegeeks has done good research to ensure that you have everything you need to make your presentation stand out. Make a name out there for a brilliant performance.

Dashboard For Big Data Management Ppt PowerPoint Presentation File Diagrams PDF
This slide represents the dashboards for big data deployment by covering details of visitors and return visitors, subscribers, top 3 articles by readers, avg duration, and pages per visit. Deliver an awe inspiring pitch with this creative Dashboard For Big Data Management Ppt PowerPoint Presentation File Diagrams PDF bundle. Topics like Dashboard, Big Data Management can be discussed with this completely editable template. It is available for immediate download depending on the needs and requirements of the user.

Company Payout Dashboard Icon For Data Analysis Ppt Professional Design Inspiration PDF
Presenting Company Payout Dashboard Icon For Data Analysis Ppt Professional Design Inspiration PDF to dispense important information. This template comprises three stages. It also presents valuable insights into the topics including Company Payout, Dashboard Icon, Data Analysis. This is a completely customizable PowerPoint theme that can be put to use immediately. So, download it and address the topic impactfully.

Dashboard Showing Medical Data Of Patient With Daily Activities Brochure PDF
Showcasing this set of slides titled Dashboard Showing Medical Data Of Patient With Daily Activities Brochure PDF. The topics addressed in these templates are Dashboard Showing Medical Data Of Patient With Daily Activities. All the content presented in this PPT design is completely editable. Download it and make adjustments in color, background, font etc. as per your unique business setting.
Vendor Performance KPI Analytical Dashboard Icon For Data Management Background PDF
Persuade your audience using this Vendor Performance KPI Analytical Dashboard Icon For Data Management Background PDF. This PPT design covers three stages, thus making it a great tool to use. It also caters to a variety of topics including Vendor Performance, KPI Analytical Dashboard, Icon Data Management. Download this PPT design now to present a convincing pitch that not only emphasizes the topic but also showcases your presentation skills.
Business Intelligence Dashboard Icon For Data Analysis And Visualization Information PDF
Persuade your audience using this Business Intelligence Dashboard Icon For Data Analysis And Visualization Information PDF. This PPT design covers three stages, thus making it a great tool to use. It also caters to a variety of topics including Business Intelligence Dashboard Icon, Data Analysis And Visualization. Download this PPT design now to present a convincing pitch that not only emphasizes the topic but also showcases your presentation skills.

Iot Digital Twin Technology Post Covid Expenditure Management Healthcare Dashboard Showing Analytical Data Brochure PDF
This slide shows the healthcare dashboard that presents analytical data such as occupancy, patient turnover, efficiency and costs, satisfaction and service indicators. Deliver an awe inspiring pitch with this creative iot digital twin technology post covid expenditure management healthcare dashboard showing analytical data brochure pdf bundle. Topics like service, indicators, cost, appointments, turnover can be discussed with this completely editable template. It is available for immediate download depending on the needs and requirements of the user.

Identifying And Increasing Brand Awareness Dashboard Depicting Website Data Insights Rules PDF
This slide shows the dashboard that depicts website data insights which covers channels such as display, social and email with total sessions, pages, average session duration, bounce rate, goal completion. There are so many reasons you need a Identifying And Increasing Brand Awareness Dashboard Depicting Website Data Insights Rules PDF. The first reason is you can not spend time making everything from scratch, Thus, Slidegeeks has made presentation templates for you too. You can easily download these templates from our website easily.

Data Quality Kpis Completeness Metrics Dashboard For Web Based Platform Graphics PDF
This slide covers dashboard based on different data categories from website. It includes data quality scores in context to data completeness and accuracy based metrics for data source ID, IP address, device ID, county codes, user agent data, horizontal accuracy, etc. Pitch your topic with ease and precision using this Data Quality Kpis Completeness Metrics Dashboard For Web Based Platform Graphics PDF. This layout presents information on Country Code, User Agent, Longitude. It is also available for immediate download and adjustment. So, changes can be made in the color, design, graphics or any other component to create a unique layout.

Data Assimilation Business Intelligence KPI Dashboard Media Ppt Layouts Show PDF
Deliver an awe inspiring pitch with this creative data assimilation business intelligence kpi dashboard media ppt layouts show pdf bundle. Topics like business intelligence kpi dashboard can be discussed with this completely editable template. It is available for immediate download depending on the needs and requirements of the user.
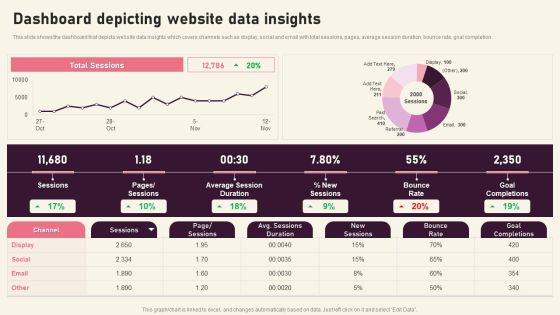
Dashboard Depicting Website Data Insights Creating Branding Techniques To Increase Brand Awareness Structure PDF
This slide shows the dashboard that depicts website data insights which covers channels such as display, social and email with total sessions, pages, average session duration, bounce rate, goal completion.Do you have to make sure that everyone on your team knows about any specific topic I yes, then you should give Dashboard Depicting Website Data Insights Creating Branding Techniques To Increase Brand Awareness Structure PDF a try. Our experts have put a lot of knowledge and effort into creating this impeccable Dashboard Depicting Website Data Insights Creating Branding Techniques To Increase Brand Awareness Structure PDF. You can use this template for your upcoming presentations, as the slides are perfect to represent even the tiniest detail. You can download these templates from the Slidegeeks website and these are easy to edit. So grab these today.
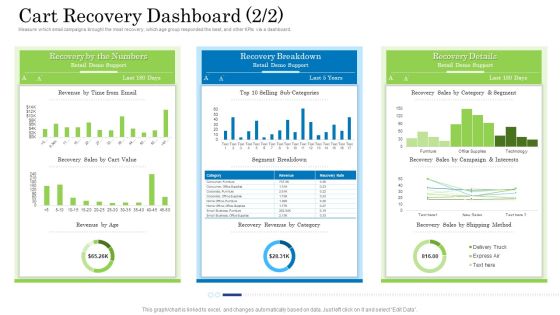
Customer Behavioral Data And Analytics Cart Recovery Dashboard Value Inspiration PDF
Measure which email campaigns brought the most recovery, which age group responded the best, and other KPIs via a dashboard. Deliver and pitch your topic in the best possible manner with this customer behavioral data and analytics cart recovery dashboard value inspiration pdf. Use them to share invaluable insights on cart recovery dashboard and impress your audience. This template can be altered and modified as per your expectations. So, grab it now.

Customer Behavioral Data And Analytics Email Engagement Dashboard Email Structure PDF
Email engagement dashboards can also capture the engagement rate depending on the device used and time spent on the emails. Deliver and pitch your topic in the best possible manner with this customer behavioral data and analytics email engagement dashboard email structure pdf. Use them to share invaluable insights on email engagement dashboard and impress your audience. This template can be altered and modified as per your expectations. So, grab it now.
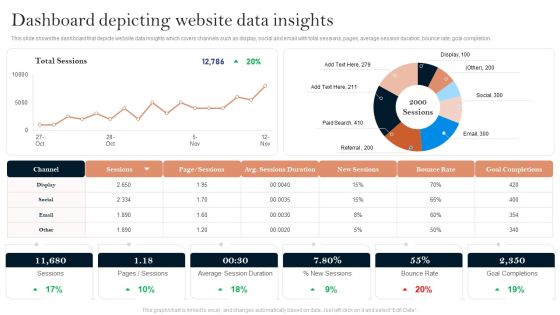
Successful Branding Technique For Electronic Commerce Corporation Dashboard Depicting Website Data Insights Microsoft PDF
Do you have to make sure that everyone on your team knows about any specific topic. I yes, then you should give Successful Branding Technique For Electronic Commerce Corporation Dashboard Depicting Website Data Insights Microsoft PDF a try. Our experts have put a lot of knowledge and effort into creating this impeccable Successful Branding Technique For Electronic Commerce Corporation Dashboard Depicting Website Data Insights Microsoft PDF. You can use this template for your upcoming presentations, as the slides are perfect to represent even the tiniest detail. You can download these templates from the Slidegeeks website and these are easy to edit. So grab these today.
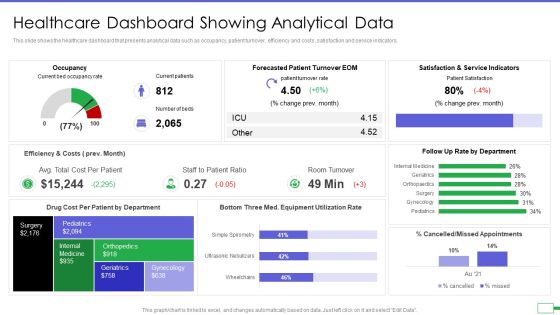
Iot And Digital Twin To Reduce Costs Post Covid Healthcare Dashboard Showing Analytical Data Elements PDF
This slide shows the healthcare dashboard that presents analytical data such as occupancy, patient turnover, efficiency and costs, satisfaction and service indicators. Deliver and pitch your topic in the best possible manner with this iot and digital twin to reduce costs post covid healthcare dashboard showing analytical data elements pdf. Use them to share invaluable insights on occupancy, patient turnover, efficiency and costs, satisfaction and service indicators and impress your audience. This template can be altered and modified as per your expectations. So, grab it now.

AIM Principles For Data Storage Application Portfolio Management Dashboard Structure PDF
Deliver an awe inspiring pitch with this creative aim principles for data storage application portfolio management dashboard structure pdf bundle. Topics like finance, human resource, cost, maintenance can be discussed with this completely editable template. It is available for immediate download depending on the needs and requirements of the user.

Data Assimilation Business Intelligence KPI Dashboard Sky Ppt Background Images PDF
Deliver an awe inspiring pitch with this creative data assimilation business intelligence kpi dashboard sky ppt background images pdf bundle. Topics like expenses, working capital, checking savings, revenues, assets can be discussed with this completely editable template. It is available for immediate download depending on the needs and requirements of the user.

Website Analytics Dashboard For Consumer Data Insights Ppt PowerPoint Presentation File Slides PDF
This slide showcases dashboard for website analytics that can help organization to gather data about visitors and formulate targeted marketing campaigns. It can also help to make individual and group buyer personas. If you are looking for a format to display your unique thoughts, then the professionally designed Website Analytics Dashboard For Consumer Data Insights Ppt PowerPoint Presentation File Slides PDF is the one for you. You can use it as a Google Slides template or a PowerPoint template. Incorporate impressive visuals, symbols, images, and other charts. Modify or reorganize the text boxes as you desire. Experiment with shade schemes and font pairings. Alter, share or cooperate with other people on your work. Download Website Analytics Dashboard For Consumer Data Insights Ppt PowerPoint Presentation File Slides PDF and find out how to give a successful presentation. Present a perfect display to your team and make your presentation unforgettable.

Targeted Marketing Strategic Plan For Audience Engagement Website Analytics Dashboard For Consumer Data Insights Guidelines PDF
This slide showcases dashboard for website analytics that can help organization to gather data about visitors and formulate targeted marketing campaigns. It can also help to make individual and group buyer personas. This Targeted Marketing Strategic Plan For Audience Engagement Website Analytics Dashboard For Consumer Data Insights Guidelines PDF is perfect for any presentation, be it in front of clients or colleagues. It is a versatile and stylish solution for organizing your meetings. The Targeted Marketing Strategic Plan For Audience Engagement Website Analytics Dashboard For Consumer Data Insights Guidelines PDF features a modern design for your presentation meetings. The adjustable and customizable slides provide unlimited possibilities for acing up your presentation. Slidegeeks has done all the homework before launching the product for you. So, do not wait, grab the presentation templates today.

Website Analytics Dashboard For Consumer Data Insights Ppt Infographic Template Samples PDF
This slide showcases dashboard for website analytics that can help organization to gather data about visitors and formulate targeted marketing campaigns. It can also help to make individual and group buyer personas. Crafting an eye catching presentation has never been more straightforward. Let your presentation shine with this tasteful yet straightforward Website Analytics Dashboard For Consumer Data Insights Ppt Infographic Template Samples PDF template. It offers a minimalistic and classy look that is great for making a statement. The colors have been employed intelligently to add a bit of playfulness while still remaining professional. Construct the ideal Website Analytics Dashboard For Consumer Data Insights Ppt Infographic Template Samples PDF that effortlessly grabs the attention of your audience Begin now and be certain to wow your customers.
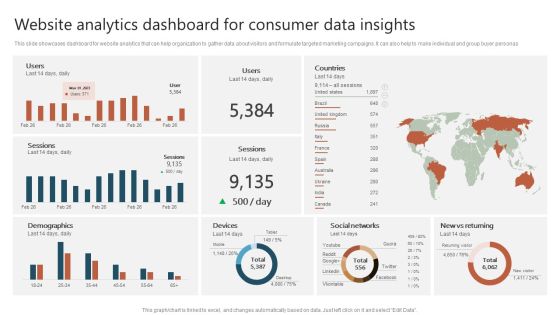
Website Analytics Dashboard For Consumer Data Insights Ppt Show Graphics Download PDF
This slide showcases dashboard for website analytics that can help organization to gather data about visitors and formulate targeted marketing campaigns. It can also help to make individual and group buyer personas. Crafting an eye catching presentation has never been more straightforward. Let your presentation shine with this tasteful yet straightforward Website Analytics Dashboard For Consumer Data Insights Ppt Show Graphics Download PDF template. It offers a minimalistic and classy look that is great for making a statement. The colors have been employed intelligently to add a bit of playfulness while still remaining professional. Construct the ideal Website Analytics Dashboard For Consumer Data Insights Ppt Show Graphics Download PDF that effortlessly grabs the attention of your audience Begin now and be certain to wow your customers.

Customer Behavioral Data And Analytics Cart Recovery Dashboard Revenue Background PDF
Measure which email campaigns brought the most recovery, which age group responded the best, and other KPIs via a dashboard. Deliver an awe inspiring pitch with this creative customer behavioral data and analytics cart recovery dashboard revenue background pdf bundle. Topics like recovery revenue, recovery rate, revenue per email can be discussed with this completely editable template. It is available for immediate download depending on the needs and requirements of the user.

Utilizing Agile Methodology In Data Transformation Project IT KPI Dashboard For Monitoring Template PDF
Mentioned slide portrays KPI dashboard for monitoring project progress. KPIS covered here are planned versus actual hours, risks and issues. Deliver and pitch your topic in the best possible manner with this utilizing agile methodology in data transformation project it kpi dashboard for monitoring template pdf. Use them to share invaluable insights on risk, planned, project and impress your audience. This template can be altered and modified as per your expectations. So, grab it now.

Brand Development Techniques To Increase Revenues Dashboard Depicting Website Data Diagrams PDF
This slide shows the dashboard that depicts website data insights which covers channels such as display, social and email with total sessions, pages, average session duration, bounce rate, goal completion. Are you in need of a template that can accommodate all of your creative concepts This one is crafted professionally and can be altered to fit any style. Use it with Google Slides or PowerPoint. Include striking photographs, symbols, depictions, and other visuals. Fill, move around, or remove text boxes as desired. Test out color palettes and font mixtures. Edit and save your work, or work with colleagues. Download Brand Development Techniques To Increase Revenues Dashboard Depicting Website Data Diagrams PDF and observe how to make your presentation outstanding. Give an impeccable presentation to your group and make your presentation unforgettable.

Echniques To Enhance Brand Dashboard Depicting Website Data Insights Clipart PDF
This slide shows the dashboard that depicts website data insights which covers channels such as display, social and email with total sessions, pages, average session duration, bounce rate, goal completion. Coming up with a presentation necessitates that the majority of the effort goes into the content and the message you intend to convey. The visuals of a PowerPoint presentation can only be effective if it supplements and supports the story that is being told. Keeping this in mind our experts created Echniques To Enhance Brand Dashboard Depicting Website Data Insights Clipart PDF to reduce the time that goes into designing the presentation. This way, you can concentrate on the message while our designers take care of providing you with the right template for the situation.
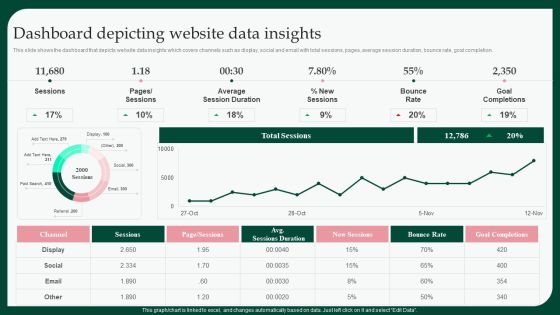
Boosting Product Sales Through Branding Dashboard Depicting Website Data Brochure PDF
This slide shows the dashboard that depicts website data insights which covers channels such as display, social and email with total sessions, pages, average session duration, bounce rate, goal completion. Coming up with a presentation necessitates that the majority of the effort goes into the content and the message you intend to convey. The visuals of a PowerPoint presentation can only be effective if it supplements and supports the story that is being told. Keeping this in mind our experts created Boosting Product Sales Through Branding Dashboard Depicting Website Data Brochure PDF to reduce the time that goes into designing the presentation. This way, you can concentrate on the message while our designers take care of providing you with the right template for the situation.

Customer Behavioral Data And Analytics Email Engagement Dashboard Rate Designs PDF
Email engagement metrics help you understand which email campaigns saw the highest open rate and click-through rate. It also gives you an idea of how different age groups interact with your emails helping you customize the content accordingly. Deliver an awe inspiring pitch with this creative customer behavioral data and analytics email engagement dashboard rate designs pdf bundle. Topics like email engagement dashboard can be discussed with this completely editable template. It is available for immediate download depending on the needs and requirements of the user.

Project Data Quality Kpis Metrics Summary Dashboard With Threshold Guidelines PDF
This slide covers different KPIs to measure performance of data quality for project completion. It includes metric such as consistency, completeness, orderliness, timeliness, accuracy, auditability and uniqueness with thresholds. Pitch your topic with ease and precision using this Project Data Quality Kpis Metrics Summary Dashboard With Threshold Guidelines PDF. This layout presents information on Consistency, Completeness, Orderliness. It is also available for immediate download and adjustment. So, changes can be made in the color, design, graphics or any other component to create a unique layout.
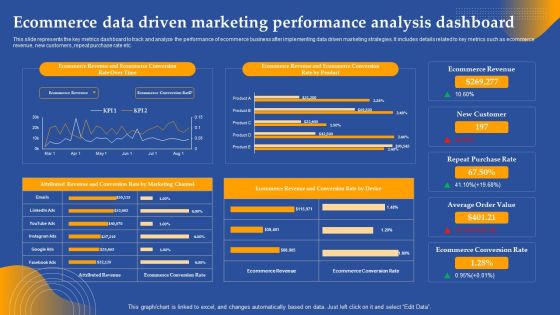
Ecommerce Data Driven Marketing Performance Analysis Dashboard Ppt Visual Aids Styles PDF
This slide represents the key metrics dashboard to track and analyze the performance of ecommerce business after implementing data driven marketing strategies. It includes details related to key metrics such as ecommerce revenue, new customers, repeat purchase rate etc. Slidegeeks has constructed Ecommerce Data Driven Marketing Performance Analysis Dashboard Ppt Visual Aids Styles PDF after conducting extensive research and examination. These presentation templates are constantly being generated and modified based on user preferences and critiques from editors. Here, you will find the most attractive templates for a range of purposes while taking into account ratings and remarks from users regarding the content. This is an excellent jumping off point to explore our content and will give new users an insight into our top notch PowerPoint Templates.

Ecommerce Data Driven Marketing Performance Analysis Dashboard Ppt Pictures Demonstration PDF
This slide represents the key metrics dashboard to track and analyze the performance of ecommerce business after implementing data driven marketing strategies. It includes details related to key metrics such as ecommerce revenue, new customers, repeat purchase rate etc. Slidegeeks has constructed Ecommerce Data Driven Marketing Performance Analysis Dashboard Ppt Pictures Demonstration PDF after conducting extensive research and examination. These presentation templates are constantly being generated and modified based on user preferences and critiques from editors. Here, you will find the most attractive templates for a range of purposes while taking into account ratings and remarks from users regarding the content. This is an excellent jumping off point to explore our content and will give new users an insight into our top notch PowerPoint Templates.
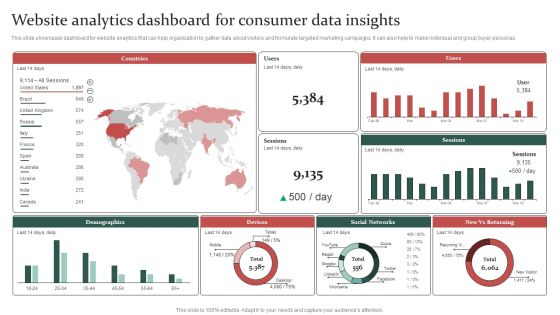
Gathering Customer Website Analytics Dashboard For Consumer Data Insights Formats PDF
This slide showcases dashboard for website analytics that can help organization to gather data about visitors and formulate targeted marketing campaigns. It can also help to make individual and group buyer personas. Present like a pro with Gathering Customer Website Analytics Dashboard For Consumer Data Insights Formats PDF Create beautiful presentations together with your team, using our easy-to-use presentation slides. Share your ideas in real-time and make changes on the fly by downloading our templates. So whether youre in the office, on the go, or in a remote location, you can stay in sync with your team and present your ideas with confidence. With Slidegeeks presentation got a whole lot easier. Grab these presentations today.
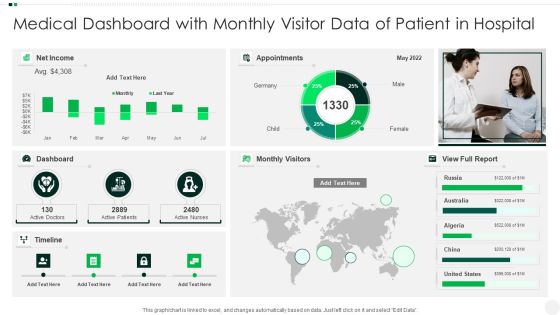
Medical Dashboard With Monthly Visitor Data Of Patient In Hospital Topics PDF
Pitch your topic with ease and precision using this Medical Dashboard With Monthly Visitor Data Of Patient In Hospital Topics PDF. This layout presents information on Medical Dashboard With Monthly Visitor Data Of Patient In Hospital. It is also available for immediate download and adjustment. So, changes can be made in the color, design, graphics or any other component to create a unique layout.

Data Theft And Breach Threats Monitoring Dashboard Ppt Outline Designs PDF
This slide covers dashboard to monitor top data breaches and loss of confidential data in organization. It includes KPIs such percentage of data risks detected, number of data risks, data risk analysis, response progress for data risks, data risk ratings. Showcasing this set of slides titled Data Theft And Breach Threats Monitoring Dashboard Ppt Outline Designs PDF. The topics addressed in these templates are Number Risk Threshold, Data Analysts Progress, Action Plan Breakdown. All the content presented in this PPT design is completely editable. Download it and make adjustments in color, background, font etc. as per your unique business setting.

Marketing And Advertising Analysis Dashboard Based On Demographic Data Demonstration PDF
This slide defines the dashboard analyzing the marketing and advertising based on demographic status. It includes information related to the impression gender, age and designated market area DMA. Showcasing this set of slides titled Marketing And Advertising Analysis Dashboard Based On Demographic Data Demonstration PDF. The topics addressed in these templates are Gender, Impressions, Demographic Data All the content presented in this PPT design is completely editable. Download it and make adjustments in color, background, font etc. as per your unique business setting.

Data Driven Marketing Campaigns Key Metrics Dashboard Ppt Icon Graphics Pictures PDF
This slide represents the KPI dashboard to track and monitor performance of data driven marketing campaigns launched by the marketing team. It includes details related to conversions by google ads, Facebook and Instagram etc. Explore a selection of the finest Data Driven Marketing Campaigns Key Metrics Dashboard Ppt Icon Graphics Pictures PDF here. With a plethora of professionally designed and pre made slide templates, you can quickly and easily find the right one for your upcoming presentation. You can use our Data Driven Marketing Campaigns Key Metrics Dashboard Ppt Icon Graphics Pictures PDF to effectively convey your message to a wider audience. Slidegeeks has done a lot of research before preparing these presentation templates. The content can be personalized and the slides are highly editable. Grab templates today from Slidegeeks.

Data Driven Marketing Campaigns Key Metrics Dashboard Ppt Outline Example Introduction PDF
This slide represents the KPI dashboard to track and monitor performance of data driven marketing campaigns launched by the marketing team. It includes details related to conversions by google ads, Facebook and Instagram etc. Explore a selection of the finest Data Driven Marketing Campaigns Key Metrics Dashboard Ppt Outline Example Introduction PDF here. With a plethora of professionally designed and pre made slide templates, you can quickly and easily find the right one for your upcoming presentation. You can use our Data Driven Marketing Campaigns Key Metrics Dashboard Ppt Outline Example Introduction PDF to effectively convey your message to a wider audience. Slidegeeks has done a lot of research before preparing these presentation templates. The content can be personalized and the slides are highly editable. Grab templates today from Slidegeeks.

1 Big Data Technology Icons Analytics Storage Replication Dashboard Magnify Ppt Slide
This image slide displays technology icons. This image slide has been crafted with graphic of big data technology icons like analytic storage, replication, dashboard and magnifying glass. This image slide may be used to express views on technology, internet and communication. This image slide will enhance the quality of your presentations.
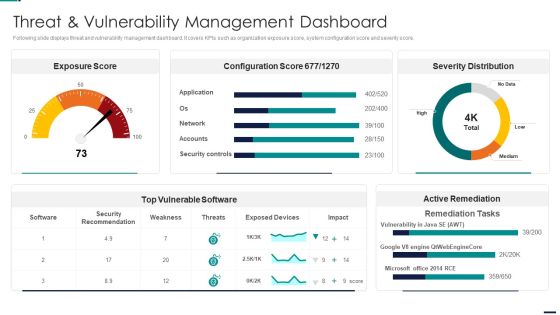
Risk Management Model For Data Security Threat And Vulnerability Management Dashboard Diagrams PDF
Following slide displays threat and vulnerability management dashboard. It covers KPIs such as organization exposure score, system configuration score and severity score. Deliver an awe inspiring pitch with this creative Risk Management Model For Data Security Threat And Vulnerability Management Dashboard Diagrams PDF bundle. Topics like Exposure Score, Configuration Score, Severity Distribution, Top Vulnerable Software, Active Remediation can be discussed with this completely editable template. It is available for immediate download depending on the needs and requirements of the user.
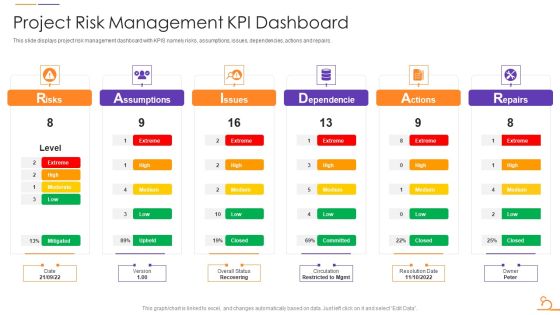
Agile Techniques For Data Migration Project Risk Management KPI Dashboard Guidelines PDF
This slide displays project risk management dashboard with KPIS namely risks, assumptions, issues, dependencies, actions and repairs. Deliver an awe inspiring pitch with this creative Agile Techniques For Data Migration Project Risk Management KPI Dashboard Guidelines PDF bundle. Topics like Risks, Assumptions, Issues, Dependencie, Actions, Repairs can be discussed with this completely editable template. It is available for immediate download depending on the needs and requirements of the user.

Customer Relationship Management Dashboard With Industry Operations Data Statistics Pictures PDF
This slide illustrates graphical representation of statistical data of sales operation. It includes sales pipeline, closed operations, open operations, operations by closing date etc. Pitch your topic with ease and precision using this Customer Relationship Management Dashboard With Industry Operations Data Statistics Pictures PDF. This layout presents information on Sales Pipeline, Insurance, Telecommunic. It is also available for immediate download and adjustment. So, changes can be made in the color, design, graphics or any other component to create a unique layout.

Ml And Big Data In Information Technology Processes Aiops Dashboard To Monitor IT Operations Sample PDF
The following slide highlights the various key performance indicators of the AIOp, these can be problem quick review, cloud and infrastructure and applications health If you are looking for a format to display your unique thoughts, then the professionally designed Ml And Big Data In Information Technology Processes Aiops Dashboard To Monitor IT Operations Sample PDF is the one for you. You can use it as a Google Slides template or a PowerPoint template. Incorporate impressive visuals, symbols, images, and other charts. Modify or reorganize the text boxes as you desire. Experiment with shade schemes and font pairings. Alter, share or cooperate with other people on your work. Download Ml And Big Data In Information Technology Processes Aiops Dashboard To Monitor IT Operations Sample PDF and find out how to give a successful presentation. Present a perfect display to your team and make your presentation unforgettable.
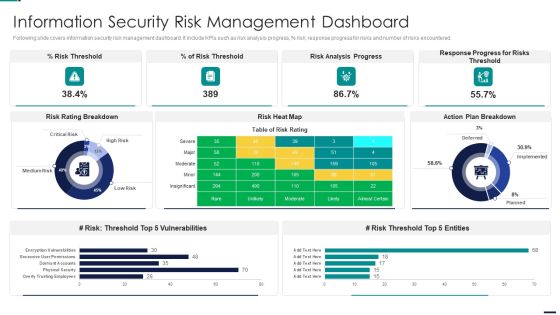
Risk Management Model For Data Security Information Security Risk Management Dashboard Pictures PDF
Following slide covers information security risk management dashboard. It include KPIs such as risk analysis progress, percent risk, response progress for risks and number of risks encountered. Deliver an awe inspiring pitch with this creative Risk Management Model For Data Security Information Security Risk Management Dashboard Pictures PDF bundle. Topics like Risk Threshold, Risk Analysis Progress, Response Progress For Risks Threshold, Action Plan Breakdown can be discussed with this completely editable template. It is available for immediate download depending on the needs and requirements of the user.

BI Technique For Data Informed Decisions Sap Analytics Cloud Dashboard For Financial Reporting Portrait PDF
This slide illustrates the SAP Analytics Cloud dashboard for financial reporting in terms of net revenue, operating profit, cost of goods sold, profitability trend and net revenue by country. It also provides details of net worth of incoming order and order distribution by country. Coming up with a presentation necessitates that the majority of the effort goes into the content and the message you intend to convey. The visuals of a PowerPoint presentation can only be effective if it supplements and supports the story that is being told. Keeping this in mind our experts created BI Technique For Data Informed Decisions Sap Analytics Cloud Dashboard For Financial Reporting Portrait PDF to reduce the time that goes into designing the presentation. This way, you can concentrate on the message while our designers take care of providing you with the right template for the situation.

BI Technique For Data Informed Decisions Sap Analytics Cloud Dashboard For HR Department Background PDF
This slide represents the SAP Analytics Cloud Dashboard for HR department of the organization. It includes information regarding the workforce employed, average salary department wise, age diversity, gender distribution and reasons for leaving firm. This modern and well-arranged BI Technique For Data Informed Decisions Sap Analytics Cloud Dashboard For HR Department Background PDF provides lots of creative possibilities. It is very simple to customize and edit with the Powerpoint Software. Just drag and drop your pictures into the shapes. All facets of this template can be edited with Powerpoint no extra software is necessary. Add your own material, put your images in the places assigned for them, adjust the colors, and then you can show your slides to the world, with an animated slide included.

Data Breach Trend Analysis With KPI Dashboard Ppt PowerPoint Presentation File Portfolio PDF
The following slide depicts the data breach trends to minimize information leakage and patch affected system. It includes elements such as breach risk trend, breach by risk category, current and future goal analysis etc. This modern and well arranged Data Breach Trend Analysis With KPI Dashboard Ppt PowerPoint Presentation File Portfolio PDF provides lots of creative possibilities. It is very simple to customize and edit with the Powerpoint Software. Just drag and drop your pictures into the shapes. All facets of this template can be edited with Powerpoint no extra software is necessary. Add your own material, put your images in the places assigned for them, adjust the colors, and then you can show your slides to the world, with an animated slide included.

BI Technique For Data Informed Decisions Sap Analytics Cloud Dashboard For Product Sales Analysis Sample PDF
This slide illustrates the SAP Analytics Cloud dashboard to monitor product sales performance. It provides information regarding the gross margin and net revenue earned, product performance state wise and year wise. Welcome to our selection of the Budget Plan For BI Technique For Data Informed Decisions Clipart PDF. These are designed to help you showcase your creativity and bring your sphere to life. Planning and Innovation are essential for any business that is just starting out. This collection contains the designs that you need for your everyday presentations. All of our PowerPoints are 100 percent editable, so you can customize them to suit your needs. This multi purpose template can be used in various situations. Grab these presentation templates today.

Data Safety Initiatives Risk Management KPI Dashboard With Loss Events And Actions Rules PDF
Following slide illustrates a risk management KPI dashboard. KPIs covered are top ten risks, loss events, actions, key risk indicators and compliance. Deliver an awe inspiring pitch with this creativedata safety initiatives overview of new it policy framework pictures pdf bundle. Topics like actions, key risk indicators, compliance, top 10 risks, loss events can be discussed with this completely editable template. It is available for immediate download depending on the needs and requirements of the user.
Modern Security Observation Plan To Eradicate Cybersecurity Risk And Data Breach Security Monitoring Dashboard With Malicious Icons PDF
Deliver an awe inspiring pitch with this creative modern security observation plan to eradicate cybersecurity risk and data breach security monitoring dashboard with malicious icons pdf bundle. Topics like security monitoring dashboard with malicious requests and average latency rate can be discussed with this completely editable template. It is available for immediate download depending on the needs and requirements of the user.
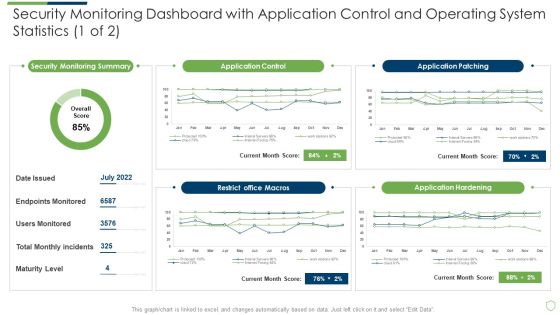
Modern Security Observation Plan To Eradicate Cybersecurity Risk And Data Breach Security Monitoring Dashboard With Application Slides PDF
Deliver and pitch your topic in the best possible manner with this modern security observation plan to eradicate cybersecurity risk and data breach security monitoring dashboard with application slides pdf. Use them to share invaluable insights on security monitoring dashboard with application control and operating system statistics and impress your audience. This template can be altered and modified as per your expectations. So, grab it now.
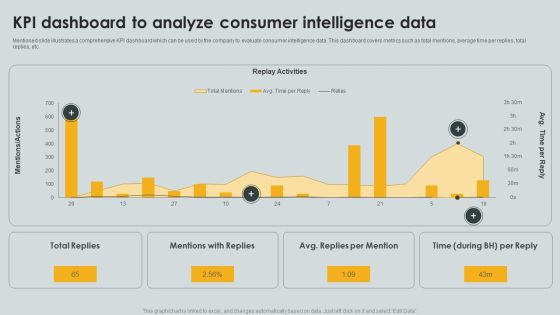
KPI Dashboard To Analyze Consumer Intelligence Data Ppt PowerPoint Presentation File Portfolio PDF
Mentioned slide illustrates a comprehensive KPI dashboard which can be used by the company to evaluate consumer intelligence data. This dashboard covers metrics such as total mentions, average time per replies, total replies, etc. Pitch your topic with ease and precision using this KPI Dashboard To Analyze Consumer Intelligence Data Ppt PowerPoint Presentation File Portfolio PDF. This layout presents information on Replay Activities, Total Replies, Mentions Replies. It is also available for immediate download and adjustment. So, changes can be made in the color, design, graphics or any other component to create a unique layout.

Personnel Salary Summary Dashboard With EPF And ESI Data Brochure PDF
The following highlights the slide employee payroll summary dashboard with EPF and ESI data illustrating key headings which includes payroll period, tasks to do, payroll deductions, employee summary and payroll cost. Pitch your topic with ease and precision using this Personnel Salary Summary Dashboard With EPF And ESI Data Brochure PDF. This layout presents information on Employee Provident Fund, Employee State Insurance, Tax Deducted At Source. It is also available for immediate download and adjustment. So, changes can be made in the color, design, graphics or any other component to create a unique layout.
Information Security Dashboard For Threat Tracking In Data Security Summary PDF
Deliver an awe inspiring pitch with this creative information security dashboard for threat tracking in data security summary pdf bundle. Topics like monthly threat status, current risk status, threats based on role, threats by owners, risk by threats can be discussed with this completely editable template. It is available for immediate download depending on the needs and requirements of the user.

Data Strategy Roadmap Including Insights And Interactive Dashboard Ppt PowerPoint Presentation File Elements PDF
Presenting this set of slides with name data strategy roadmap including insights and interactive dashboard ppt powerpoint presentation file elements pdf. This is a eight stage process. The stages in this process are sources, developing, decisions. This is a completely editable PowerPoint presentation and is available for immediate download. Download now and impress your audience.
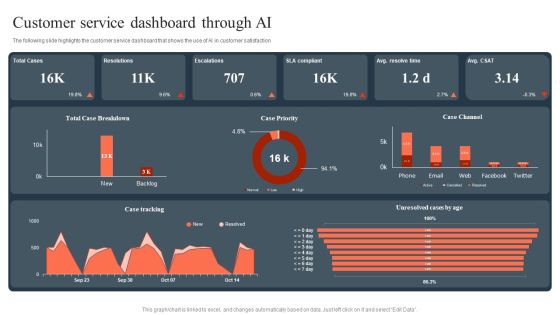
Ml And Big Data In Information Technology Processes Customer Service Dashboard Through AI Guidelines PDF
The following slide highlights the customer service dashboard that shows the use of AI in customer satisfaction Crafting an eye catching presentation has never been more straightforward. Let your presentation shine with this tasteful yet straightforward Ml And Big Data In Information Technology Processes Customer Service Dashboard Through AI Guidelines PDF template. It offers a minimalistic and classy look that is great for making a statement. The colors have been employed intelligently to add a bit of playfulness while still remaining professional. Construct the ideal Ml And Big Data In Information Technology Processes Customer Service Dashboard Through AI Guidelines PDF that effortlessly grabs the attention of your audience. Begin now and be certain to wow your customers.

KPI Dashboard To Monitor Workforce Diversity Data And Inclusion Of IT Firm Slides PDF
Following slide demonstrates KPI dashboard to track diversity and inclusion which can be used by managers to develop workforce for business . It includes elements such as hiring data diversity, performance rating, promotion rate, promotion percentage, employee turnover, top management gender diversity, etc. Showcasing this set of slides titled KPI Dashboard To Monitor Workforce Diversity Data And Inclusion Of IT Firm Slides PDF. The topics addressed in these templates are Employee Turnover, Management, Promotion Rate. All the content presented in this PPT design is completely editable. Download it and make adjustments in color, background, font etc. as per your unique business setting.

Marketers Guide To Data Analysis Optimization Social Media Analytics KPI Dashboard Clipart PDF
This slide covers a dashboard for tracking social media KPIs such as face engagements, total likes, followers, audience growth, YouTube subscribers, views, Instagram reach and , likes, LinkedIn impressions, etc. Find a pre designed and impeccable Marketers Guide To Data Analysis Optimization Social Media Analytics KPI Dashboard Clipart PDF. The templates can ace your presentation without additional effort. You can download these easy to edit presentation templates to make your presentation stand out from others. So, what are you waiting for Download the template from Slidegeeks today and give a unique touch to your presentation.

Predictive Data Model Predictive Analytics Model Performance Tracking Dashboard Themes PDF
This slide represents the predictive analytics model performance tracking dashboard, and it covers the details of total visitors, total buyers, total products added to the cart, filters by date and category, visitors to clients conversion rate, and so on. Find a pre-designed and impeccable Predictive Data Model Predictive Analytics Model Performance Tracking Dashboard Themes PDF. The templates can ace your presentation without additional effort. You can download these easy-to-edit presentation templates to make your presentation stand out from others. So, what are you waiting for Download the template from Slidegeeks today and give a unique touch to your presentation.
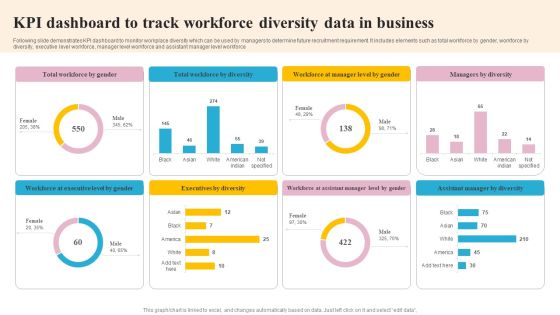
KPI Dashboard To Track Workforce Diversity Data In Business Mockup PDF
Following slide demonstrates KPI dashboard to monitor workplace diversity which can be used by managers to determine future recruitment requirement. It includes elements such as total workforce by gender, workforce by diversity, executive level workforce, manager level workforce and assistant manager level workforce. Pitch your topic with ease and precision using this KPI Dashboard To Track Workforce Diversity Data In Business Mockup PDF. This layout presents information on Executives By Diversity, Workforce By Diversity, Executive Level By Gender. It is also available for immediate download and adjustment. So, changes can be made in the color, design, graphics or any other component to create a unique layout.
Marketers Guide To Data Analysis Optimization Website Landing Page KPI Tracking Dashboard Information PDF
This slide covers a dashboard for analyzing the metrics of the website landing page. It includes KPIs such as conversions, conversion rate, sessions, bounce rate, engagement sickness, etc. Present like a pro with Marketers Guide To Data Analysis Optimization Website Landing Page KPI Tracking Dashboard Information PDF Create beautiful presentations together with your team, using our easy to use presentation slides. Share your ideas in real time and make changes on the fly by downloading our templates. So whether you are in the office, on the go, or in a remote location, you can stay in sync with your team and present your ideas with confidence. With Slidegeeks presentation got a whole lot easier. Grab these presentations today.

Kpi Dashboard To Track Agile Release Management Change Strategy Data Mockup PDF
The following slide exhibits dashboard to track data sets relating to sprint and release management. It presents information related to velocity, task status, etc. Showcasing this set of slides titled Kpi Dashboard To Track Agile Release Management Change Strategy Data Mockup PDF. The topics addressed in these templates are Velocity, Task Status, Incomplete Tasks. All the content presented in this PPT design is completely editable. Download it and make adjustments in color, background, font etc. as per your unique business setting.
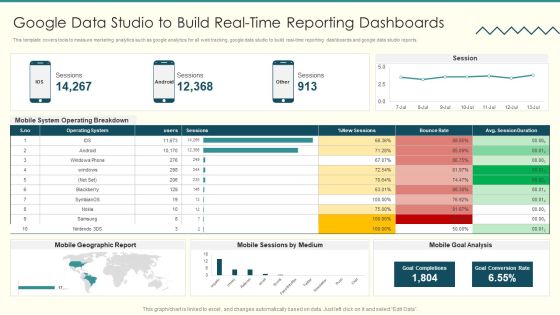
Security And Performance Digital Marketing Google Data Studio To Build Realtime Reporting Dashboards Information PDF
This template covers tools to measure marketing analytics such as google analytics for all web tracking, google data studio to build real time reporting dashboards and google data studio reports.Deliver an awe inspiring pitch with this creative Security And Performance Digital Marketing Google Data Studio To Build Realtime Reporting Dashboards Information PDF bundle. Topics like Operating Breakdown, Session Duration, Goal Completions can be discussed with this completely editable template. It is available for immediate download depending on the needs and requirements of the user.
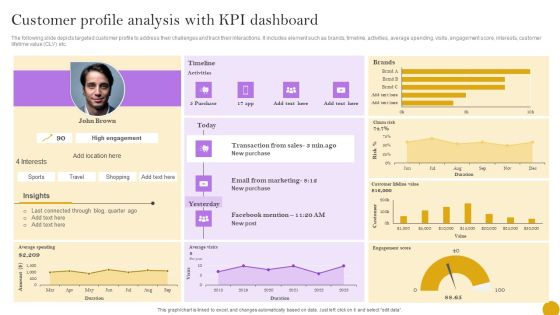
Comprehensive Customer Data Platform Guide Optimizing Promotional Initiatives Customer Profile Analysis KPI Dashboard Pictures PDF
The following slide depicts targeted customer profile to address their challenges and track their interactions. It includes element such as brands, timeline, activities, average spending, visits, engagement score, interests, customer lifetime value CLV etc. The best PPT templates are a great way to save time, energy, and resources. Slidegeeks have 100 percent editable powerpoint slides making them incredibly versatile. With these quality presentation templates, you can create a captivating and memorable presentation by combining visually appealing slides and effectively communicating your message. Download Comprehensive Customer Data Platform Guide Optimizing Promotional Initiatives Customer Profile Analysis KPI Dashboard Pictures PDF from Slidegeeks and deliver a wonderful presentation.
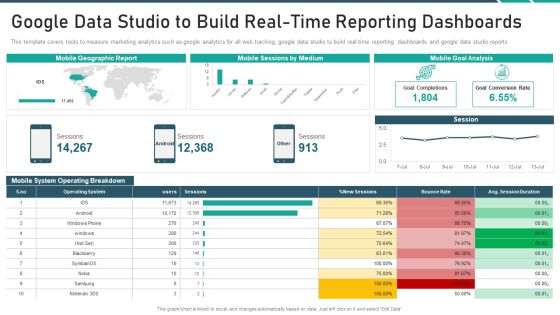
Online Promotion Playbook Google Data Studio To Build Real Time Reporting Dashboards Topics PDF
This template covers tools to measure marketing analytics such as google analytics for all web tracking, google data studio to build real time reporting dashboards and google data studio reports. Deliver and pitch your topic in the best possible manner with this online promotion playbook google data studio to build real time reporting dashboards topics pdf. Use them to share invaluable insights on google data studio to build real time reporting dashboards and impress your audience. This template can be altered and modified as per your expectations. So, grab it now.
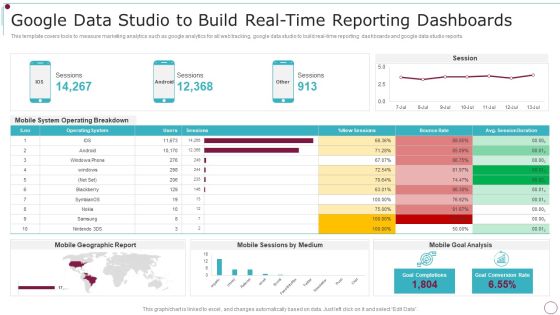
Playbook For Content Advertising Google Data Studio To Build Real Time Reporting Dashboards Formats PDF
This template covers tools to measure marketing analytics such as google analytics for all web tracking, google data studio to build real-time reporting dashboards and google data studio reports. Deliver and pitch your topic in the best possible manner with this Playbook For Content Advertising Google Data Studio To Build Real Time Reporting Dashboards Formats PDF. Use them to share invaluable insights on Mobile System, Operating Breakdown, Geographic Report and impress your audience. This template can be altered and modified as per your expectations. So, grab it now.

Operational Dashboard Powerpoint Images
This is a operational dashboard powerpoint images. This is a four stage process. The stages in this process are cash and equivalents, revenue and expenses actual and forecast, store sales vs budget, expenses actual budget forecast.

Financial Dashboard Powerpoint Slide
This is a financial dashboard powerpoint slide. This is a two stage process. The stages in this process are current assets, accounts receivable, prepaid expenses, short team investments.
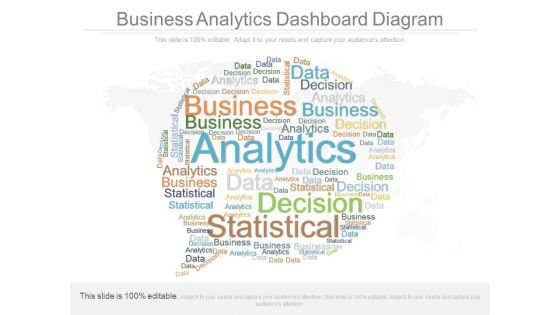
Business Analytics Dashboard Diagram
This is a business analytics dashboard diagram. This is a one stage process. The stages in this process are analytics, decision, data, business, statistics.

Dashboard Template Formats PDF
Deliver an awe inspiring pitch with this creative dashboard template formats pdf bundle. Topics like dashboard template can be discussed with this completely editable template. It is available for immediate download depending on the needs and requirements of the user.

Dashboard Template Ideas PDF
Deliver an awe-inspiring pitch with this creative dashboard template ideas pdf. bundle. Topics like dashboard template can be discussed with this completely editable template. It is available for immediate download depending on the needs and requirements of the user.
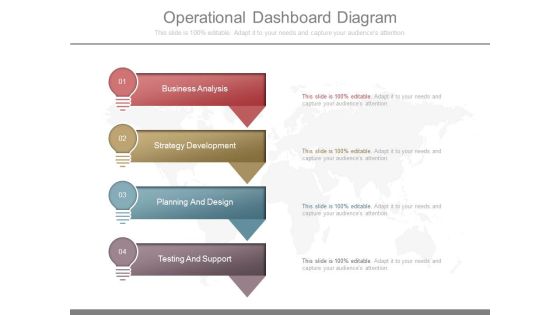
Operational Dashboard Diagram
This is a operational dashboard diagram. This is a four stage process. The stages in this process are business analysis, strategy development, planning and design, testing and support.

Inventory Dashboard Information PDF
Deliver an awe inspiring pitch with this creative inventory dashboard information pdf bundle. Topics like total inventories, received, shipment status can be discussed with this completely editable template. It is available for immediate download depending on the needs and requirements of the user.
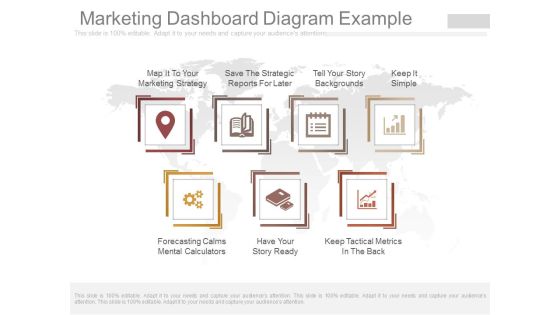
Marketing Dashboard Diagram Example
This is a marketing dashboard diagram example. This is a seven stage process. The stages in this process are map it to your marketing strategy, save the strategic reports for later, tell your story backgrounds, keep it simple, forecasting calms mental calculators, have your story ready, keep tactical metrics in the back.

Investment Dashboard Themes PDF
Deliver and pitch your topic in the best possible manner with this investment dashboard themes pdf. Use them to share invaluable insights on account activity, portfolio suggestions, portfolio summary and impress your audience. This template can be altered and modified as per your expectations. So, grab it now.
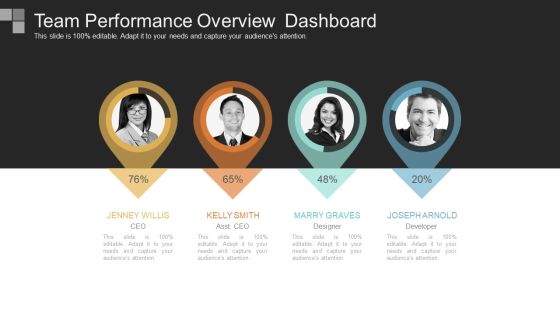
Team Performance Overview Dashboard
This is a team performance overview dashboard. This is a four stage process. The stages in this process are jenney willis ceo, kelly smith asst ceo, marry graves designer, joseph arnold developer.

Data Analytics Management Big Data Types Structured Data Introduction PDF
This slide represents the structured data type of big data and how data is kept in specific formats that are handled by machines only.Deliver an awe inspiring pitch with this creative Data Analytics Management Big Data Types Structured Data Introduction PDF bundle. Topics like Handled By Machines, Information, Business Databases can be discussed with this completely editable template. It is available for immediate download depending on the needs and requirements of the user.

Data Analytics Management Big Data Types Unstructured Data Brochure PDF
This slide depicts the unstructured data form of big data and how it can be any form such as videos, audio, likes, and comments. Deliver and pitch your topic in the best possible manner with this Data Analytics Management Big Data Types Unstructured Data Brochure PDF. Use them to share invaluable insights on Unorganized Information, Format Collected, Document Stored and impress your audience. This template can be altered and modified as per your expectations. So, grab it now.

Data Lineage Methods Data Lineage And Data Provenance Download PDF
This slide represents the data lineage and data provenance that represents data flow at summary and detail levels. The components of both concepts include a file transfer protocol server, data staging area, data warehouse, master data, data marts, and so on. Are you searching for a Data Lineage Methods Data Lineage And Data Provenance Download PDF that is uncluttered, straightforward, and original Its easy to edit, and you can change the colors to suit your personal or business branding. For a presentation that expresses how much effort you have put in, this template is ideal With all of its features, including tables, diagrams, statistics, and lists, its perfect for a business plan presentation. Make your ideas more appealing with these professional slides. Download Data Lineage Methods Data Lineage And Data Provenance Download PDF from Slidegeeks today.

Data Lineage Implementation Data Lineage And Data Provenance Download PDF
This slide represents the data lineage and data provenance that represents data flow at summary and detail levels. The components of both concepts include a file transfer protocol server, data staging area, data warehouse, master data, data marts, and so on. Do you have an important presentation coming up Are you looking for something that will make your presentation stand out from the rest Look no further than Data Lineage Implementation Data Lineage And Data Provenance Download PDF. With our professional designs, you can trust that your presentation will pop and make delivering it a smooth process. And with Slidegeeks, you can trust that your presentation will be unique and memorable. So why wait Grab Data Lineage Implementation Data Lineage And Data Provenance Download PDF today and make your presentation stand out from the rest.

Big Data Architect Big Data Types Structured Data Infographics PDF
This slide represents the structured data type of big data and how data is kept in specific formats that are handled by machines only.Deliver an awe inspiring pitch with this creative Big Data Architect Big Data Types Structured Data Infographics PDF bundle. Topics like Already Controlled, Databases Spreadsheets, Data Warehouses can be discussed with this completely editable template. It is available for immediate download depending on the needs and requirements of the user.

Data Mining Implementation Data Mining With Data Analytics Structure PDF
This slide represents the difference between data science and data analytics based on skillset, scope, exploration and goals and how both will work together Deliver and pitch your topic in the best possible manner with this data mining implementation data mining with data analytics structure pdf Use them to share invaluable insights on advanced statistics, predictive analytics, data modelling and impress your audience. This template can be altered and modified as per your expectations. So, grab it now.

Big Data Architect Big Data Types Unstructured Data Pictures PDF
This slide depicts the unstructured data form of big data and how it can be any form such as videos, audio, likes, and comments. Deliver and pitch your topic in the best possible manner with this Big Data Architect Big Data Types Unstructured Data Pictures PDF. Use them to share invaluable insights on Unorganized Information, Media Platforms, Document Clusters and impress your audience. This template can be altered and modified as per your expectations. So, grab it now.

Data Warehouse Implementation Data Warehouse Vs Data Mart Summary PDF
This slide represents a comparison between data warehouse and data mart and how data marts can be designed for sole operational reasons.Deliver and pitch your topic in the best possible manner with this Data Warehouse Implementation Data Warehouse Vs Data Mart Summary PDF. Use them to share invaluable insights on Processed Data, Data Warehouse, Marketing Finance and impress your audience. This template can be altered and modified as per your expectations. So, grab it now.

Dashboard Ppt PowerPoint Presentation Slide
This is a dashboard ppt powerpoint presentation slide. This is a four stage process. The stages in this process are business, strategy, marketing, dashboard, management.
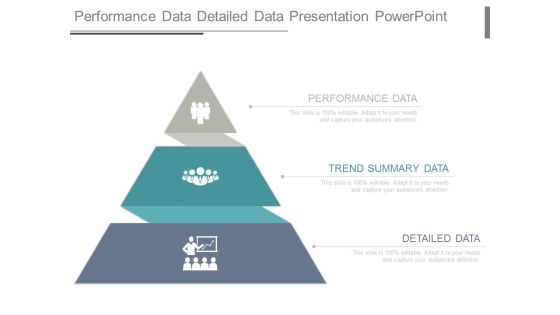
Performance Data Detailed Data Presentation Powerpoint
This is a performance data detailed data presentation powerpoint. This is a three stage process. The stages in this process are performance data, trend summary data, detailed data.

Data Understanding Data Preparation Ppt Slides
This is a data understanding data preparation ppt slides. This is a three stage process. The stages in this process are data understanding, data preparation, business understanding.

Data Steward Vs Data Analyst Background PDF
This slide represents the difference between data stewards and data analysts, including the functions they perform and the annual package. Both of them handle information but still possess different roles and responsibilities. Whether you have daily or monthly meetings, a brilliant presentation is necessary. Data Steward Vs Data Analyst Background PDF can be your best option for delivering a presentation. Represent everything in detail using Data Steward Vs Data Analyst Background PDF and make yourself stand out in meetings. The template is versatile and follows a structure that will cater to your requirements. All the templates prepared by Slidegeeks are easy to download and edit. Our research experts have taken care of the corporate themes as well. So, give it a try and see the results.

Dashboard Ppt PowerPoint Presentation Samples
This is a dashboard ppt powerpoint presentation samples. This is a three stage process. The stages in this process are medium, low, high.
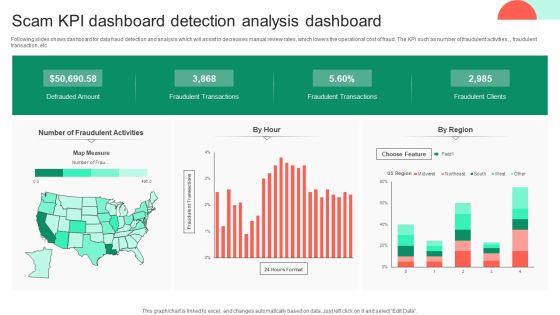
Scam KPI Dashboard Detection Analysis Dashboard Background PDF
Following slides shows dashboard for data fraud detection and analysis which will assist in decreases manual review rates, which lowers the operational cost of fraud. The KPI such as number of fraudulent activities, , fraudulent transaction, etc. Showcasing this set of slides titled Scam KPI Dashboard Detection Analysis Dashboard Background PDF. The topics addressed in these templates are Scam Kpi Dashboard, Detection Analysis Dashboard. All the content presented in this PPT design is completely editable. Download it and make adjustments in color, background, font etc. as per your unique business setting.

Data Lake Implementation Comparison Between Data Warehouse Data Lake And Data Infographics PDF
This slide represents the comparison between data warehouse, data lake and data lakehouse based on the period and components of both, along with information insights carried out. From laying roadmaps to briefing everything in detail, our templates are perfect for you. You can set the stage with your presentation slides. All you have to do is download these easy-to-edit and customizable templates. Data Lake Implementation Comparison Between Data Warehouse Data Lake And Data Infographics PDF will help you deliver an outstanding performance that everyone would remember and praise you for. Do download this presentation today.

Data Lake Architecture Future Of Data Analysis How Data Lakehouse Solves Data Lake Challenges Demonstration PDF
This slide describes how data lakehouse solves data lake challenges through transactional storage layer, comparable data structures, data management capabilities, classical analytics, and so on.Deliver an awe inspiring pitch with this creative Data Lake Architecture Future Of Data Analysis How Data Lakehouse Solves Data Lake Challenges Demonstration PDF bundle. Topics like Metadata And Governance, Machine Learning, Structured And Unstructured can be discussed with this completely editable template. It is available for immediate download depending on the needs and requirements of the user.

Data Lake Architecture Future Of Data Analysis Difference Between Data Lake And Data Warehouse Information PDF
This slide depicts the difference between a data lake and a data warehouse based on characteristics such as data, schema, price, performance, users, and analytics.Deliver an awe inspiring pitch with this creative Data Lake Architecture Future Of Data Analysis Difference Between Data Lake And Data Warehouse Information PDF bundle. Topics like Relational And Transactional, Systems Operational, Databases can be discussed with this completely editable template. It is available for immediate download depending on the needs and requirements of the user.
Collecting Data Ppt Slides
This is a collecting data ppt slides. This is a four stage process. The stages in this process are provide grantee, provide insurance, methods of collecting data, collecting data.

Data Lake Architecture Future Of Data Analysis Data Lakes Vs Data Lakehouses Vs Data Warehouses Portrait PDF
This slide represents a comparison between data lakes, data lake houses, and data warehouses based on factors such as type of data, cost, format, scalability, reliability, and so on.Deliver and pitch your topic in the best possible manner with this Data Lake Architecture Future Of Data Analysis Data Lakes Vs Data Lakehouses Vs Data Warehouses Portrait PDF. Use them to share invaluable insights on Reliability, Machine Learning, Data Scientists and impress your audience. This template can be altered and modified as per your expectations. So, grab it now.

Dashboard Ppt PowerPoint Presentation Icon
This is a dashboard ppt powerpoint presentation icon. This is a three stage process. The stages in this process are revenue, units sold, purchase value revenue, units sold, purchase value.

Dashboard Ppt PowerPoint Presentation Graphics
This is a dashboard ppt powerpoint presentation graphics. This is a four stage process. The stages in this process are business, marketing, management, dashboard, analysis.

Dashboard Ppt PowerPoint Presentation Microsoft
This is a dashboard ppt powerpoint presentation microsoft. This is a three stage process. The stages in this process are dashboard, business, marketing, speed, meter.

Dashboard Ppt PowerPoint Presentation Designs
This is a dashboard ppt powerpoint presentation designs. This is a three stage process. The stages in this process are business, strategy, marketing, analysis, success, dashboard.

Dashboard Ppt PowerPoint Presentation Sample
This is a dashboard ppt powerpoint presentation sample. This is a three stage process. The stages in this process are business, strategy, marketing, analysis, success, dashboard.

Dashboard Ppt PowerPoint Presentation Good
This is a dashboard ppt powerpoint presentation good. This is a three stage process. The stages in this process are dashboard, marketing, analysis, strategy, business.

Dashboard Ppt PowerPoint Presentation Rules
This is a dashboard ppt powerpoint presentation rules. This is a three stage process. The stages in this process are dashboard, measurement, percentage, analysis, business.

Dashboard Ppt PowerPoint Presentation Picture
This is a dashboard ppt powerpoint presentation picture. This is a three stage process. The stages in this process are business, dashboard, marketing, strategy, analysis.

Dashboard Ppt PowerPoint Presentation Templates
This is a dashboard ppt powerpoint presentation templates. This is a one stage process. The stages in this process are business, marketing, percentage, dashboard, management.

Dashboard Ppt PowerPoint Presentation Ideas
This is a dashboard ppt powerpoint presentation ideas. This is a three stage process. The stages in this process are dashboard, management, strategy, marketing, business.

Dashboard Ppt PowerPoint Presentation Slides
This is a dashboard ppt powerpoint presentation slides. This is a three stage process. The stages in this process are dashboard, measure, marketing, strategy, business.

Dashboard Ppt PowerPoint Presentation Backgrounds
This is a dashboard ppt powerpoint presentation backgrounds. This is a two stage process. The stages in this process are dashboard, percentage, finance, measurement, business.

Dashboard Ppt PowerPoint Presentation Visuals
This is a dashboard ppt powerpoint presentation visuals. This is a four stage process. The stages in this process are dashboard, measure, management, business, marketing.

Dashboard Ppt PowerPoint Presentation Introduction
This is a dashboard ppt powerpoint presentation introduction. This is a four stage process. The stages in this process are dashboard, measure, strategy, business, success.

Dashboard Ppt PowerPoint Presentation Tips
This is a dashboard ppt powerpoint presentation tips. This is a four stage process. The stages in this process are dashboard, time management, strategy, business.

Dashboard Ppt PowerPoint Presentation Example
This is a dashboard ppt powerpoint presentation example. This is a three stage process. The stages in this process are dashboard, management, marketing, strategy, success.

Dashboard Ppt PowerPoint Presentation Summary
This is a dashboard ppt powerpoint presentation summary. This is a three stage process. The stages in this process are business, management, marketing, dashboard, measure.

Dashboard Ppt PowerPoint Presentation Inspiration
This is a dashboard ppt powerpoint presentation inspiration. This is a three stage process. The stages in this process are business, marketing, dashboard, finance, percentage.

Dashboard Ppt PowerPoint Presentation Layouts
This is a dashboard ppt powerpoint presentation layouts. This is a one stage process. The stages in this process are dashboard, strategy, business, process, management.

Dashboard Ppt PowerPoint Presentation Influencers
This is a dashboard ppt powerpoint presentation influencers. This is a three stage process. The stages in this process are dashboard, process, management, marketing, strategy.

Dashboard Ppt PowerPoint Presentation Deck
This is a dashboard ppt powerpoint presentation deck. This is a three stage process. The stages in this process are dashboard, planning, management, business, strategy.

Dashboard Ppt PowerPoint Presentation Model
This is a dashboard ppt powerpoint presentation model. This is a two stage process. The stages in this process are dashboard, process, success, marketing, strategy.

Dashboard Ppt PowerPoint Presentation Layout
This is a dashboard ppt powerpoint presentation layout. This is a one stage process. The stages in this process are dashboard, measurement, business, marketing.

Dashboard Ppt PowerPoint Presentation Template
This is a dashboard ppt powerpoint presentation template. This is a one stage process. The stages in this process are dashboard, planning, marketing, business, management, strategy.

Dashboard Ppt PowerPoint Presentation Images
This is a dashboard ppt powerpoint presentation images. This is a one stage process. The stages in this process are dashboard, meter, speed, measure, business.

Dashboard Ppt PowerPoint Presentationmodel Brochure
This is a dashboard ppt powerpoint presentationmodel brochure. This is a one stage process. The stages in this process are dashboard, business, management, planning, strategy.

API Ecosystem Dashboard Clipart PDF
This is a api ecosystem dashboard clipart pdf template with various stages. Focus and dispense information on three stages using this creative set, that comes with editable features. It contains large content boxes to add your information on topics like dashboard. You can also showcase facts, figures, and other relevant content using this PPT layout. Grab it now.

Dashboard Ppt PowerPoint Presentation Guide
This is a dashboard ppt powerpoint presentation guide. This is a four stage process. The stages in this process are business, marketing, management, dashboard, analysis.

Dashboard Ppt PowerPoint Presentation Guidelines
This is a dashboard ppt powerpoint presentation guidelines. This is a three stage process. The stages in this process are dashboard, strategy, business, success, marketing, management.

Dashboard Ppt PowerPoint Presentation Portfolio
This is a dashboard ppt powerpoint presentation portfolio. This is a four stage process. The stages in this process are business, marketing, management, dashboard, finance.

Dashboard Ppt PowerPoint Presentation Diagrams
This is a dashboard ppt powerpoint presentation diagrams. This is a four stage process. The stages in this process are performance, energy, speed.

Dashboard Ppt PowerPoint Presentation Files
This is a dashboard ppt powerpoint presentation files. This is a four stage process. The stages in this process are sales rate, progress, profits, safety.

Dashboard Ppt PowerPoint Presentation Gallery
This is a dashboard ppt powerpoint presentation gallery. This is a three stage process. The stages in this process are low, medium, high.

Dashboard Ppt PowerPoint Presentation Outline
This is a dashboard ppt powerpoint presentation outline. This is a one stage process. The stages in this process are medium, low, high.

Dashboard Ppt PowerPoint Presentation Themes
This is a dashboard ppt powerpoint presentation themes. This is a two stage process. The stages in this process are low, high, poor, good, excellent.

Dashboard Ppt PowerPoint Presentation Styles
This is a dashboard ppt powerpoint presentation styles. This is a three stage process. The stages in this process are dashboard, business, marketing, meter, speed.

Dashboard Ppt PowerPoint Presentation Pictures
This is a dashboard ppt powerpoint presentation pictures. This is a three stage process. The stages in this process are dashboard, measure, marketing, strategy, business.

Crm Dashboard Sales Dashboard Template Ppt PowerPoint Presentation Professional Layout
This is a crm dashboard sales dashboard template ppt powerpoint presentation professional layout. This is a four stage process. The stages in this process are lead owner breakdown, sales by product march 2017, total lead ownership, month over month closing trend.

Dashboard Ppt PowerPoint Presentation Shapes
This is a dashboard ppt powerpoint presentation shapes. This is a five stage process. The stages in this process are very poor, poor, fair, good, excllent.

Dashboard Ppt PowerPoint Presentation Show
This is a dashboard ppt powerpoint presentation show. This is a three stage process. The stages in this process are speed, meter, measure, needle, calculate.

Dashboard Ppt PowerPoint Presentation Examples
This is a dashboard ppt powerpoint presentation examples. This is a three stage process. The stages in this process are low, medium, high.
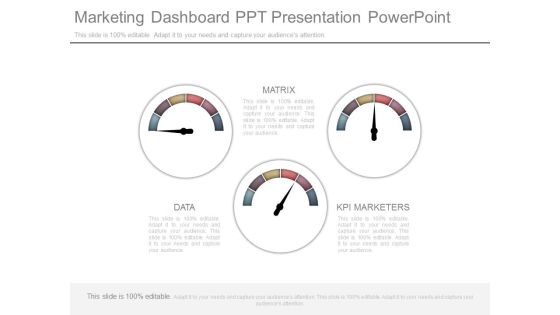
Marketing Dashboard Ppt Presentation Powerpoint
This is a marketing dashboard ppt presentation powerpoint. This is a three stage process. The stages in this process are data, matrix, kpi marketers.

Service Level Dashboard Ppt Slides
This is a service level dashboard ppt slides. This is a three stage process. The stages in this process are dashboard, graph, growth.

Crm Dashboard Intranet Dashboard Ppt PowerPoint Presentation Information
This is a crm dashboard intranet dashboard ppt powerpoint presentation information. This is a five stage process. The stages in this process are informatics, research, practice, network, expertise.

Kpi And Dashboard Kpi Dashboards Ppt PowerPoint Presentation Layouts
This is a kpi and dashboard kpi dashboards ppt powerpoint presentation layouts. This is a two stage process. The stages in this process are finance, strategy, analysis, marketing.
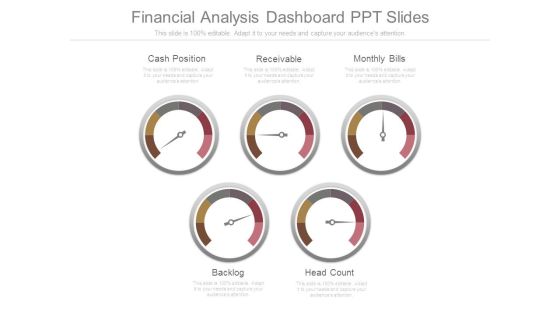
Financial Analysis Dashboard Ppt Slides
This is a financial analysis dashboard ppt slides. This is a five stage process. The stages in this process are cash position, receivable, monthly bills, backlog, head count.

Crm Dashboard Sales Dashboard Template Ppt PowerPoint Presentation Microsoft
This is a crm dashboard sales dashboard template ppt powerpoint presentation microsoft. This is a four stage process. The stages in this process are lead owner breakdown, month over month closing trend, total lead ownership, sales by product march 2017.

Crm Dashboard Intranet Dashboard Ppt PowerPoint Presentation Outline Professional
This is a crm dashboard intranet dashboard ppt powerpoint presentation outline professional. This is a four stage process. The stages in this process are events count, page views, page views, country.

Crm Dashboard Intranet Dashboard Ppt PowerPoint Presentation Model
This is a crm dashboard intranet dashboard ppt powerpoint presentation model. This is a four stage process. The stages in this process are events count, page views, page views, country.

Crm Dashboard Sales Dashboard Ppt PowerPoint Presentation Themes
This is a crm dashboard sales dashboard ppt powerpoint presentation themes. This is a four stage process. The stages in this process are month over month closing trend, lead owner breakdown, total lead ownership, sales by product march 2017.

Financial Planning Dashboard Ppt Slide
This is a financial planning dashboard ppt slide. This is a three stage process. The stages in this process are portfolio accounting, crm, financial planning.
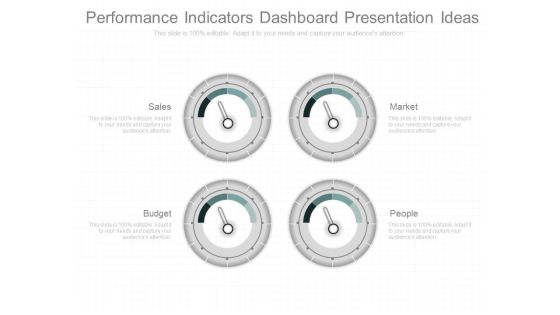
Performance Indicators Dashboard Presentation Ideas
This is a performance indicators dashboard presentation ideas. This is a four stage process. The stages in this process are sales, market, budget, people.

Dashboard System Ppt Powerpoint Ideas
This is a dashboard system ppt powerpoint ideas. This is a four stage process. The stages in this process are description.
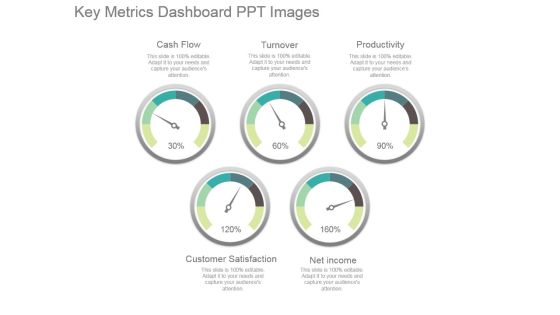
Key Metrics Dashboard Ppt Images
This is a key metrics dashboard ppt images. This is a five stage process. The stages in this process are cash flow, turnover, productivity, net income, customer satisfaction.

Crm Dashboard Sales Dashboard Template Ppt PowerPoint Presentation Inspiration
This is a crm dashboard sales dashboard template ppt powerpoint presentation inspiration. This is a five stage process. The stages in this process are sales by product march, lead owner breakdown, total lead ownership, month over month closing trend.

Crm Dashboard Intranet Dashboard Ppt PowerPoint Presentation Sample
This is a crm dashboard intranet dashboard ppt powerpoint presentation sample. This is a four stage process. The stages in this process are page views, events count, country, page views.

Crm Dashboard Intranet Dashboard Ppt PowerPoint Presentation Ideas Images
This is a crm dashboard intranet dashboard ppt powerpoint presentation ideas images. This is a four stage process. The stages in this process are page views, country, page views, events count.

Customer Relationship Management Dashboard CRM Application Dashboard Quarter Icons PDF
This graph or chart is linked to excel, and changes automatically based on data. Just left click on it and select Edit Data.Deliver and pitch your topic in the best possible manner with this customer relationship management dashboard crm application dashboard quarter icons pdf. Use them to share invaluable insights on marketing funnel all time, opportunity generation by quarter, active prospects, new prospects, new opportunities and impress your audience. This template can be altered and modified as per your expectations. So, grab it now.

Customer Relationship Management Dashboard CRM Application Dashboard Month Microsoft PDF
This graph or chart is linked to excel, and changes automatically based on data. Just left click on it and select Edit Data.Deliver an awe-inspiring pitch with this creative customer relationship management dashboard crm application dashboard month microsoft pdf bundle. Topics like show me the deals by each stage, what is the revenue this month, get me the number of leads created this month by source as a chart can be discussed with this completely editable template. It is available for immediate download depending on the needs and requirements of the user.
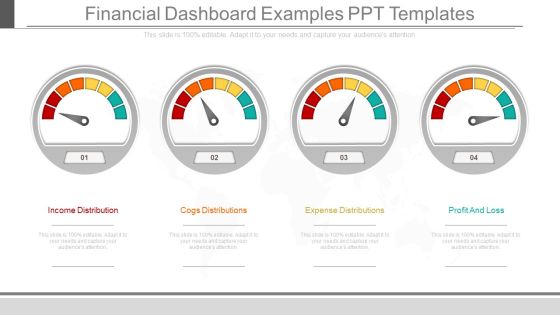
Financial Dashboard Examples Ppt Templates
This is a financial dashboard examples ppt templates. This is a four stage process. The stages in this process are income distribution, cogs distributions, expense distributions, profit and loss.

Dashboard Program Ppt Presentation Powerpoint
This is a dashboard program ppt presentation powerpoint. This is a six stage process. The stages in this process are tasks, progress, matrix, resource, utilization, time, safety, progress, sales rate.

Customer Relationship Management Dashboard CRM Application Dashboard Risk Guidelines PDF
Deliver an awe inspiring pitch with this creative customer relationship management dashboard crm application dashboard risk guidelines pdf bundle. Topics like about to renew, accounts at risk, ongoing project, ongoing accounts can be discussed with this completely editable template. It is available for immediate download depending on the needs and requirements of the user.

Risk Metrics Dashboard And Mitigation Expenditure Dashboard Ideas PDF
This slide illustrates facts and figures of expenditure incurred on different risks. It includes financial risk, operational risks and competition risks. Pitch your topic with ease and precision using this Risk Metrics Dashboard And Mitigation Expenditure Dashboard Ideas PDF. This layout presents information on Management, Expenditure, Risk. It is also available for immediate download and adjustment. So, changes can be made in the color, design, graphics or any other component to create a unique layout.
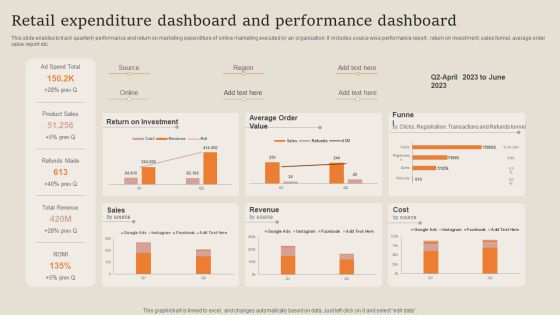
Retail Expenditure Dashboard And Performance Dashboard Formats PDF
This slide enables to track quarterly performance and return on marketing expenditure of online marketing executed by an organization. It includes source wise performance report , return on investment, sales funnel, average order value report etc. Pitch your topic with ease and precision using this Retail Expenditure Dashboard And Performance Dashboard Formats PDF. This layout presents information on Return On Investment, Product Sales, Revenue. It is also available for immediate download and adjustment. So, changes can be made in the color, design, graphics or any other component to create a unique layout.
 Home
Home