AI PPT Maker
Templates
PPT Bundles
Design Services
Business PPTs
Business Plan
Management
Strategy
Introduction PPT
Roadmap
Self Introduction
Timelines
Process
Marketing
Agenda
Technology
Medical
Startup Business Plan
Cyber Security
Dashboards
SWOT
Proposals
Education
Pitch Deck
Digital Marketing
KPIs
Project Management
Product Management
Artificial Intelligence
Target Market
Communication
Supply Chain
Google Slides
Research Services
 One Pagers
All Categories
-
Home
- Customer Favorites
- Data Dashboard
Data Dashboard

6 Stages Stack Blocks Of Data Construction Business Plan PowerPoint Templates
We present our 6 stages stack blocks of data construction business plan PowerPoint templates.Present our Ladders PowerPoint Templates because our PowerPoint Templates and Slides are the string of your bow. Fire of your ideas and conquer the podium. Present our Shapes PowerPoint Templates because Our PowerPoint Templates and Slides are the chords of your song. String them along and provide the lilt to your views. Present our Business PowerPoint Templates because You should Throw the gauntlet with our PowerPoint Templates and Slides. They are created to take up any challenge. Download our Circle Charts PowerPoint Templates because Our PowerPoint Templates and Slides help you meet the demand of the Market. Just browse and pick the slides that appeal to your intuitive senses. Use our Success PowerPoint Templates because Our PowerPoint Templates and Slides will give good value for money. They also have respect for the value of your time.Use these PowerPoint slides for presentations relating to podium, stand, stair, step, roundly, base, winner, platform, white, stage, success, first, award, championship, silver, third, foot-stall, achievement, rung, foot stall, prize, ladder rung, win, second, champion, foundation, best, illustration, number, jaggies, position, place, round ladder, circular ladder, competition, station, circular podium, pedestal, victory, game, sport. The prominent colors used in the PowerPoint template are Blue, Gray, Black.

6 Stages Stack Blocks Of Data Ppt Example Business Plan Outline PowerPoint Slides
We present our 6 stages stack blocks of data ppt example business plan outline PowerPoint Slides.Download our Business PowerPoint Templates because Our PowerPoint Templates and Slides will let you meet your Deadlines. Present our Layers PowerPoint Templates because Our PowerPoint Templates and Slides are created by a hardworking bunch of busybees. Always flitting around with solutions gauranteed to please. Use our Steps PowerPoint Templates because Our PowerPoint Templates and Slides will provide weight to your words. They will bring out the depth of your thought process. Download our Shapes PowerPoint Templates because Our PowerPoint Templates and Slides will generate and maintain the level of interest you desire. They will create the impression you want to imprint on your audience. Present our Leadership PowerPoint Templates because They will Put the wind in your sails. Skim smoothly over the choppy waters of the market.Use these PowerPoint slides for presentations relating to stacked, stacking, pattern, surface, stonemason, solid, blocks, many, feature, row, rubble, rock, masonry, brickwork, surrounding, revetment, brickwall, blotch, reduction, fence, pieces, building, frame, backdrop, strength, outdoors, ordinary, scene, background, idyllic, construction, weathered, stability, metal, material. The prominent colors used in the PowerPoint template are Blue, Gray, Black.
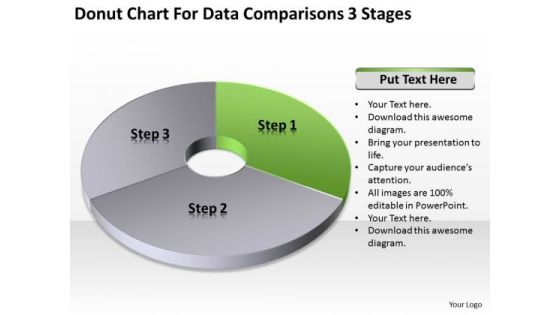
Chart For Data Comparisons 3 Stages How To Complete Business Plan PowerPoint Templates
We present our chart for data comparisons 3 stages how to complete business plan PowerPoint templates.Download and present our Business PowerPoint Templates because You canTake a leap off the starting blocks with our PowerPoint Templates and Slides. They will put you ahead of the competition in quick time. Download our Ring Charts PowerPoint Templates because You canTake a leap off the starting blocks with our PowerPoint Templates and Slides. They will put you ahead of the competition in quick time. Use our Process and Flows PowerPoint Templates because Our PowerPoint Templates and Slides are created with admirable insight. Use them and give your group a sense of your logical mind. Download our Shapes PowerPoint Templates because Our PowerPoint Templates and Slides will give you great value for your money. Be assured of finding the best projection to highlight your words. Present our Flow Charts PowerPoint Templates because Our PowerPoint Templates and Slides are designed to help you succeed. They have all the ingredients you need.Use these PowerPoint slides for presentations relating to Chart, flow, diagram, around, numbers, model, perspective, green, white, red, business, rotation, presentation, shadow, representation, circle, ring,flowchart, rotate, marketing, repeat, abstract, management, cycle, illustration, icon, three, guidance, connection, strategy, direction, recurrent, motion, connect,variation, contrast, background, commerce, repetitive. The prominent colors used in the PowerPoint template are Green, Gray, White.
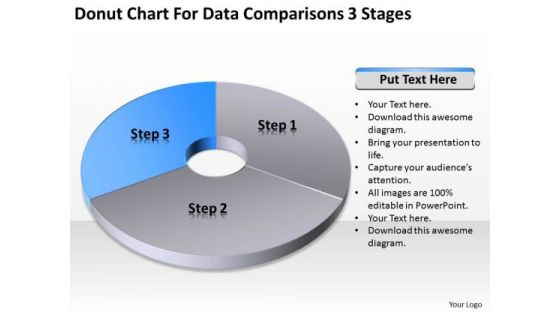
Chart For Data Comparisons 3 Stages Ppt Business Plan PowerPoint Templates
We present our chart for data comparisons 3 stages ppt business plan PowerPoint templates.Use our Business PowerPoint Templates because Our PowerPoint Templates and Slides are innately eco-friendly. Their high recall value negate the need for paper handouts. Present our Ring Charts PowerPoint Templates because Our PowerPoint Templates and Slides will Embellish your thoughts. They will help you illustrate the brilliance of your ideas. Present our Process and Flows PowerPoint Templates because You aspire to touch the sky with glory. Let our PowerPoint Templates and Slides provide the fuel for your ascent. Use our Shapes PowerPoint Templates because It can be used to Set your controls for the heart of the sun. Our PowerPoint Templates and Slides will be the propellant to get you there. Use our Flow Charts PowerPoint Templates because Our PowerPoint Templates and Slides ensures Effective communication. They help you put across your views with precision and clarity.Use these PowerPoint slides for presentations relating to Chart, flow, diagram, around, numbers, model, perspective, green, white, red, business, rotation, presentation, shadow, representation, circle, ring,flowchart, rotate, marketing, repeat, abstract, management, cycle, illustration, icon, three, guidance, connection, strategy, direction, recurrent, motion, connect,variation, contrast, background, commerce, repetitive. The prominent colors used in the PowerPoint template are Blue, White, Gray.
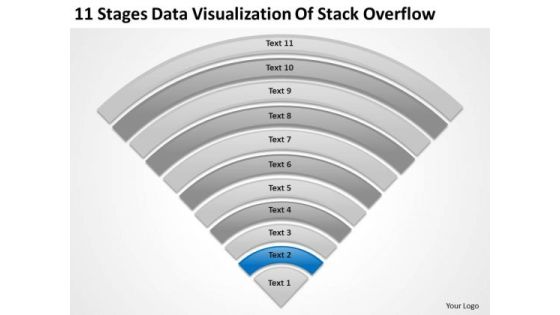
Data Visualization Of Stack Overflow Template For Writing Business Plan PowerPoint Slides
We present our data visualization of stack overflow template for writing business plan PowerPoint Slides.Download our Business PowerPoint Templates because Our PowerPoint Templates and Slides will embellish your thoughts. See them provide the desired motivation to your team. Present our Process and Flows PowerPoint Templates because Our PowerPoint Templates and Slides are the chords of your song. String them along and provide the lilt to your views. Use our Flow Charts PowerPoint Templates because Our PowerPoint Templates and Slides are effectively colour coded to prioritise your plans They automatically highlight the sequence of events you desire. Use our Shapes PowerPoint Templates because You can Bask in the warmth of our PowerPoint Templates and Slides. Enjoy the heartfelt glowing response of your listeners. Use our Triangles PowerPoint Templates because Our PowerPoint Templates and Slides help you meet the demand of the Market. Just browse and pick the slides that appeal to your intuitive senses.Use these PowerPoint slides for presentations relating to Saturation, strip, saturated, line, spectrum, pantone, bright, diagram, circle, sampler, guide, element, paint, scale,shape, ten, multicolored, palette, illustration, spectral, guidance, chart, collection, abstraction, selection, choice, visible, variation, painter, contrast, ,gradient, pattern, chooser, analyzer. The prominent colors used in the PowerPoint template are Blue navy, White, Gray.
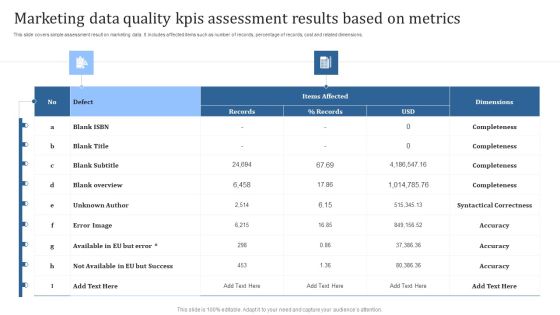
Marketing Data Quality Kpis Assessment Results Based On Metrics Summary PDF
This slide covers simple assessment result on marketing data. It includes affected items such as number of records, percentage of records, cost and related dimensions. Showcasing this set of slides titled Error Image, Unknown Author, Blank Overview. The topics addressed in these templates are Error Image, Unknown Author, Blank Overview. All the content presented in this PPT design is completely editable. Download it and make adjustments in color, background, font etc. as per your unique business setting.

Business Diagram Three Bulbs With Text Boxes For Data Flow PowerPoint Template
This power point template has been designed with graphic of three bulbs and text boxes. These text boxes are used to show the text and data. Display your business and marketing related text in any presentation with this exclusive PPT.

Recruitment Metrics For Data Driven Selection Process Ppt PowerPoint Presentation Inspiration Graphics Download PDF
This slide highlights the key performance indicators to analyze hiring process in organization which includes time to fill, first year attrition rate, cost per hire, candidate job satisfaction and interview to hire ratio. Persuade your audience using this Recruitment Metrics For Data-Driven Selection Process Ppt PowerPoint Presentation Inspiration Graphics Download PDF. This PPT design covers one stage, thus making it a great tool to use. It also caters to a variety of topics including Candidate Job, Satisfaction, Attrition Rate. Download this PPT design now to present a convincing pitch that not only emphasizes the topic but also showcases your presentation skills.
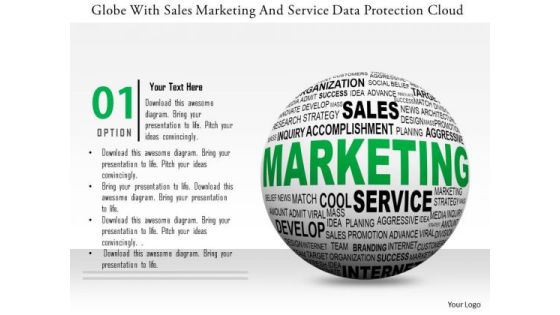
Stock Photo Globe With Sales Marketing And Service Data Protection Cloud PowerPoint Slide
This power point template has been designed with graphic of globe and cloud. This image template contains the concept of global sales and marketing service with cloud technology. Use this image template for global business related presentations.

Business Diagram 3d Bulb With Text Boxes For Data Representation Presentation Template
This business diagram has been designed with 3d bulb with text boxes. This bulb graphic is displaying the concept of idea generation. Use this diagram to portray concepts like strategy, idea , success etc.
Business Diagram Four Staged Text Infographics For Data Representation Presentation Template
Four staged info graphics has been used to design this PowerPoint template. This slide can be used for text representation. Present your views using this innovative slide and be assured of leaving a lasting impression.

Business Diagram Four Data Text Boxes With Year 2015 For New Year Presentation Template
Four text boxes with year text 2015 has been used to design this power point template. This PPT contains the concept of new year celebration. Use this PPT for your new year based topics in any presentation.
Business Diagram Paper Tags On Mobile Screen For Data Representation Presentation Template
This business diagram has been designed with graphic of text boxes with mobile phone. This diagram helps to depict concepts of technology and communication. Make your presentation more interactive with this business slide.
Business Diagram Technology Icons With Globe For Data Transfer Presentation Template
This business slide contains various technology icons moving towards globe. Display concept of technology and global communication in visual manner with this diagram. Download this diagram slide to make professional presentations.

1 High Tech Devices Laptop Tablet Phone Connected To Centralized Data Center With Globe Ppt Slides
This Power Point image slide has been designed with cloud computing concept. To elaborate the concept of cloud computing we have used graphic of high tech devices. Laptop, tablet and phone are connected with centralized datacentre with the help of cloud computing. use this PPT slide in your presentation and build a presentation for cloud computing technology.
Business Diagram Four Staged Linear Text Boxes For Data Representation Presentation Template
This business diagram displays four staged linear text boxes. This diagram is suitable to depict flow of business activities or steps. Download this professional slide to present information in an attractive manner
Business Diagram Infographics With Multiple Icons For Data Representation Presentation Template
This business diagram has been designed with graphic of multiple icons info graphics. Download this diagram to analyze the key points. This diagram offers a way for your audience to visually conceptualize the process.
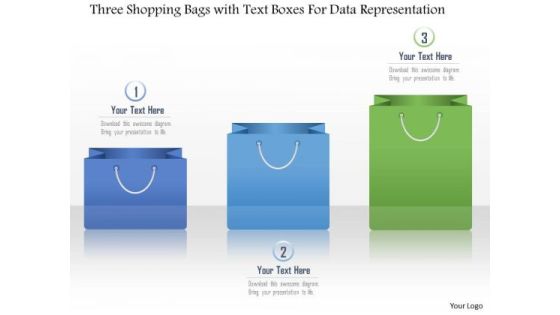
Business Diagram Three Shopping Bags With Text Boxes For Data Representation Presentation Template
This Power Point diagram has been crafted with graphic of three shopping bags. It contains diagram of colorful shopping bag graphics depicting progress steps. Use this diagram to build professional presentation for your viewers.

Business Diagram 3d Thumbs Up Style Text Boxes For Data Presentation Template
This Power Point diagram has been crafted with graphic of text boxes with icons. It contains diagram of thumb up hand graphics with communication icons. Use this diagram to build professional presentation for your viewers.
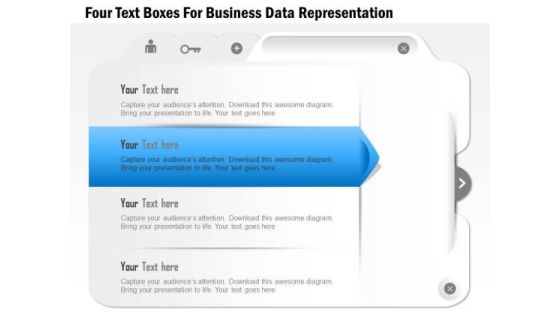
Business Diagram Four Text Boxes For Business Data Representation Presentation Template
This diagram can be used to display 4 staged business plan. Your thoughts need to be organized. This PowerPoint template contains graphics of four text boxes. Use this innovative diagram slide to build exclusive presentation.

Stock Photo Globe And Server For Global Data Storage PowerPoint Slide
Graphic of globe and server has been used to design this PowerPoint template. This image slide contains the concept of technology and internet. Use this professional slide for technology related topics.
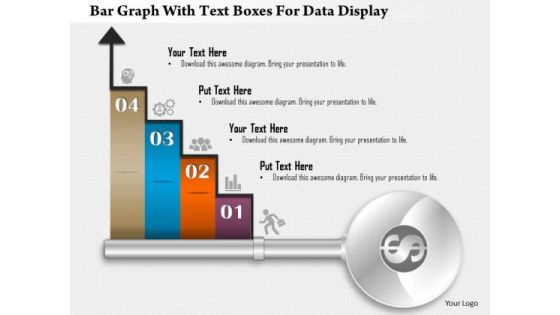
Business Diagram Bar Graph With Text Boxes For Data Display Presentation Template
Our above business diagram displays bar graph. It contains four steps on bar graph with icons. Use this diagram to display four stages of business growth. Download this Power Point slide to build quality presentation for your viewers.
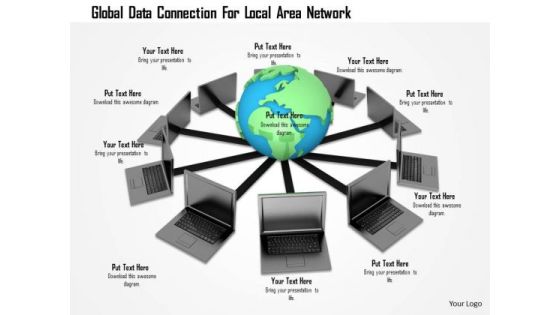
Stock Photo Global Data Connection For Local Area Network PowerPoint Slide
This Power point template has been designed with graphic of globe connected with laptops. This image slide contains the concept of global networking. Use this slide for your business network and communication related topics in any presentation.

Business Diagram Puzzles Under Magnifier For Marketing Data Research Presentation Template
Our above business slide displays magnifying glass over puzzles. You may use this diagram for presentations on market research. Grab the attention of your listeners with this professional slide.

Busines Diagram Three Staged Text Boxes For Data Representation Presentation Template
Three staged text boxes are used to design this business diagram. This slide helps to depict business process flow. This slide offers an excellent background to build professional presentations.
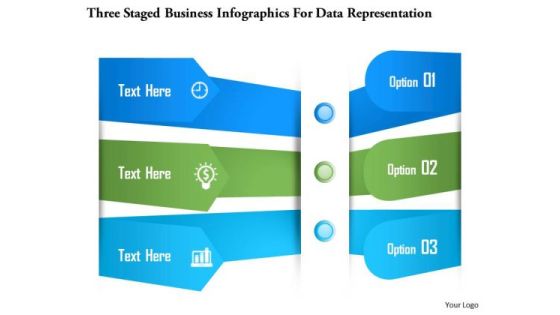
Business Diagram Three Staged Business Infographics For Data Representation Presentation Template
Three staged info graphics has been used to design this PowerPoint template. This slide can be used for text representation. Present your views using this innovative slide and be assured of leaving a lasting impression.

Business Finance Strategy Development Annual Data On Timeline Roadmap Diagram Marketing Diagram
Be The Doer With Our Business Diagram See Business Timeline Roadmap Diagram Strategy Diagram Powerpoint Templates. Put Your Thoughts Into Practice.

Stock Photo World Map On Bar Graph For Data Growth Image Graphics For PowerPoint Slide
This image is designed with blue graph with world map printed on it. This conceptual image portrays the concepts of global business and global economy. This image slide will help you express your views to target audience.
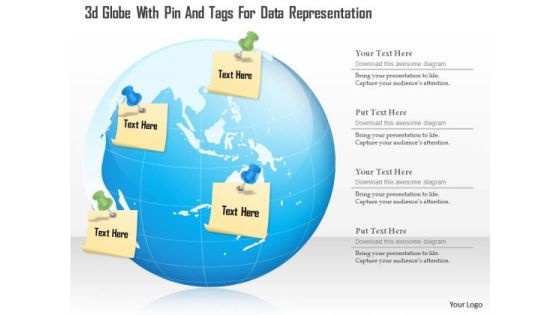
Business Diagram 3d Globe With Pin And Tags For Data Representation Presentation Template
This business diagram has been designed with graphic of 3d globe with pin and tags. This slide helps to depict concept of global communication. Download this diagram slide to make professional presentations.

Business Diagram Five Staged Colored Infographics For Business Data Presentation Template
Five staged colored info graphics has been used to design this PowerPoint template. Download our above diagram to express information in a visual way. This diagram offers a way for your audience to visually conceptualize the process.

1 Replication Of Data From Main Office To Regional Office To Branch Offices Ppt Slide
This image slide explains the concept database replication in an organization. This image slide has been designed with graphic of database system transfers in main, regional and local office branches. You may change color, size and orientation of any icon to your liking. Use this image slide, in your presentations to express views on backup, storage, networking, communication and technology. Create wonderful presentations using this image slide.

1 Geographically Distributed Servers Across Data Centers Connected To A Centralized Cloud Ppt Slides
This image slide displays geographically distributed server. This image slide has been designed with graphic of could, servers and globe. This image depicts cloud computing. You may change size, color and orientation of any icon to your liking. Use this PowerPoint template, in your presentations to explain concept of cloud computing both at local and global scale. This image slide will help you make professional presentations.

Data Breach Prevention Recognition Ppt PowerPoint Presentation Complete Deck With Slides
This complete deck acts as a great communication tool. It helps you in conveying your business message with personalized sets of graphics, icons etc. Comprising a set of fifty slides, this complete deck can help you persuade your audience. It also induces strategic thinking as it has been thoroughly researched and put together by our experts. Not only is it easily downloadable but also editable. The color, graphics, theme any component can be altered to fit your individual needs. So grab it now.

Companys Data Safety Recognition Ppt PowerPoint Presentation Complete Deck With Slides
This complete deck acts as a great communication tool. It helps you in conveying your business message with personalized sets of graphics, icons etc. Comprising a set of fifty one slides, this complete deck can help you persuade your audience. It also induces strategic thinking as it has been thoroughly researched and put together by our experts. Not only is it easily downloadable but also editable. The color, graphics, theme any component can be altered to fit your individual needs. So grab it now.
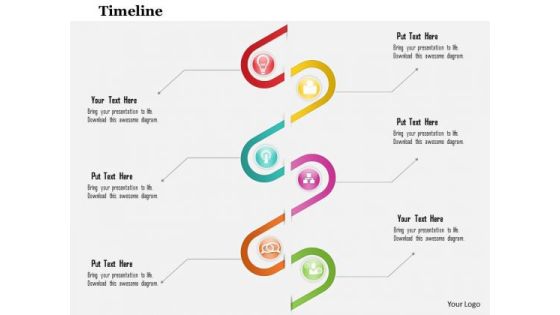
Business Diagram Six Staged Spiral Diagram For Data Flow Presentation Template
This business slide depicts six staged spiral diagram. This diagram provides an effective way of displaying information you can edit text, color, shade and style as per you need. Present your views using this innovative slide and be assured of leaving a lasting impression.
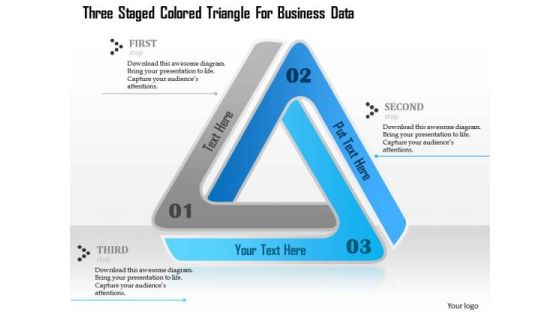
Business Diagram Three Staged Colored Triangle For Business Data Presentation Template
Three staged blue colored triangle has been used to design this business diagram. This slide contains triangle diagram to depict process flow. Use this PPT slide for your business and marketing presentations
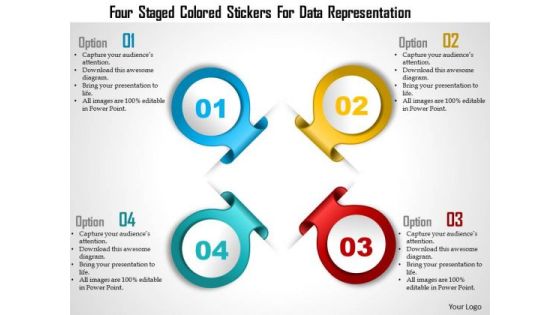
Business Diagram Four Staged Colored Stickers For Data Representation Presentation Template
Graphic of four staged colored stickers been used to design this business slide. This slide depicts four steps of a business process. Make your presentation more interactive with this business slide.
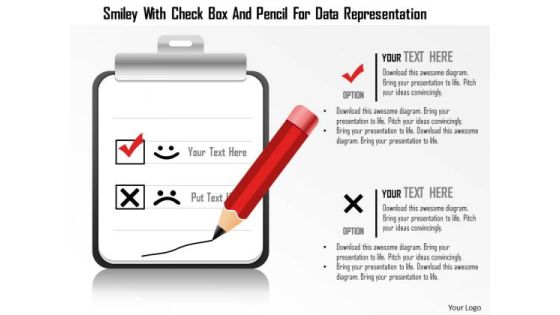
Business Diagram Smiley With Check Box And Pencil For Data Representation Presentation Template
This business diagram has been designed with smiley with check box and pencil. Download this diagram to analyze the key points. This diagram offers a way for your audience to visually conceptualize the process.
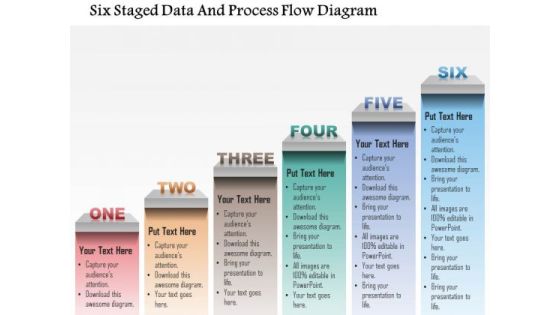
Busines Diagram Six Staged Data And Process Flow Diagram Presentation Template
Six staged diagram has been used to design this business slide. This diagram can be used to show the business processes or workflows. Deliver amazing presentations to mesmerize your audience.

Business Diagram Four Colorful Pie Charts For Data Representation Presentation Template
This diagram is designed with four colorful pie charts. Download this diagram to analyze the key points. This diagram offers a way for your audience to visually conceptualize the process.

Business Diagram Six Staged Step Diagram For Business Data Presentation Template
Download this diagram to display business development strategies, business plans, decisions, and stages. This Business diagram contains graphics of six steps cubes with icons. Present your views using this innovative slide and be assured of leaving a lasting impression.

Business Diagram Spiral Road Diagram For Data And Timeline Presentation Template
this power point template slide has been designed with graphic of spiral road diagram. This diagram can be used for timeline and business process flow related topics. Use this PPT slide in your business and marketing related presentations.
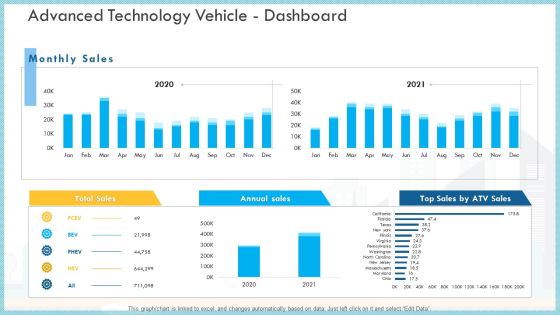
Loss Of Income And Financials Decline In An Automobile Organization Case Study Advanced Technology Vehicle Dashboard Infographics PDF
This graph or chart is linked to excel, and changes automatically based on data. Just left click on it and select Edit Data.Deliver an awe inspiring pitch with this creative loss of income and financials decline in an automobile organization case study advanced technology vehicle dashboard infographics pdf bundle. Topics like total sales, annual sales, monthly sales can be discussed with this completely editable template. It is available for immediate download depending on the needs and requirements of the user.
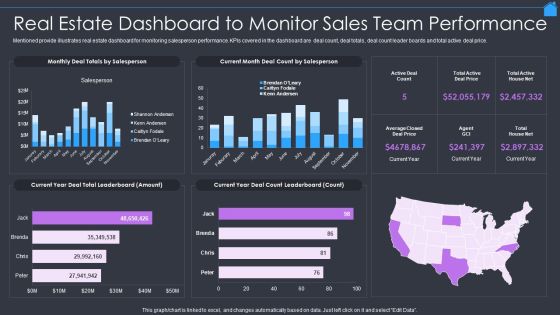
Marketing Strategy To Enhance Real Estate Sales Real Estate Dashboard To Monitor Sales Team Performance Infographics PDF
Mentioned provide illustrates real estate dashboard for monitoring salesperson performance. KPIs covered in the dashboard are deal count, deal totals, deal count leader boards and total active deal price. Deliver an awe inspiring pitch with this creative Marketing Strategy To Enhance Real Estate Sales Real Estate Dashboard To Monitor Sales Team Performance Infographics PDF bundle. Topics like Real Estate Dashboard, Monitor Sales Team Performance can be discussed with this completely editable template. It is available for immediate download depending on the needs and requirements of the user.

Case Competition Inflated Fuel Price In Logistics Firm Logistics Dashboard For XYZ Logistic Company Sales Microsoft PDF
The slide shows the logistic measurement dashboard for measuring inventory turnover ratio, inventory carrying cost, inventory accuracy, percentage of out of stock items etc. Deliver an awe inspiring pitch with this creative case competition inflated fuel price in logistics firm logistics dashboard for xyz logistic company sales microsoft pdf bundle. Topics like logistics dashboard for xyz logistic company can be discussed with this completely editable template. It is available for immediate download depending on the needs and requirements of the user.
Global Cyber Terrorism Incidents On The Rise IT Dashboard For Threat Tracking Of Cyber Terrorism Clipart PDF
This slide depicts the dashboard for threat tracking of cyber terrorism by covering top threats, threats by class name, etc. Deliver and pitch your topic in the best possible manner with this global cyber terrorism incidents on the rise it dashboard for threat tracking of cyber terrorism clipart pdf. Use them to share invaluable insights on dashboard for threat tracking of cyber terrorism and impress your audience. This template can be altered and modified as per your expectations. So, grab it now.
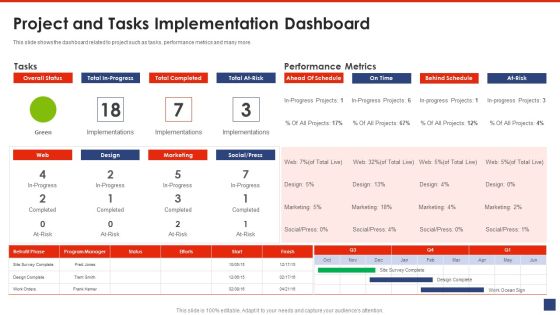
Writing A List Of Specific Project Objective For Project Review Project And Tasks Implementation Dashboard Background PDF
This slide shows the dashboard related to project such as tasks, performance metrics and many more.Deliver an awe inspiring pitch with this creative writing a list of specific project objective for project review project and tasks implementation dashboard background pdf bundle. Topics like project and tasks implementation dashboard can be discussed with this completely editable template. It is available for immediate download depending on the needs and requirements of the user.

Tech Support Services Cost And Pricing IT Application And Managed Services Dashboard Ppt PowerPoint Presentation Ideas Designs
Presenting this set of slides with name tech support services cost and pricing it application and managed services dashboard ppt powerpoint presentation ideas designs. The topics discussed in these slide is it application and managed services dashboard. This is a completely editable PowerPoint presentation and is available for immediate download. Download now and impress your audience.

Tech Support Services Cost And Pricing IT Server Downtime Issue And Support Dashboard Ppt PowerPoint Presentation Summary Inspiration
Presenting this set of slides with name tech support services cost and pricing it server downtime issue and support dashboard ppt powerpoint presentation summary inspiration. The topics discussed in these slide is it server downtime issue and support dashboard. This is a completely editable PowerPoint presentation and is available for immediate download. Download now and impress your audience.

Key Prioritization Techniques For Project Team Management Project Management Dashboard Tool Ppt PowerPoint Presentation Professional Pictures PDF
Presenting this set of slides with name key prioritization techniques for project team management project management dashboard tool ppt powerpoint presentation professional pictures pdf. The topics discussed in these slides are project management dashboard tool. This is a completely editable PowerPoint presentation and is available for immediate download. Download now and impress your audience.

Cloud Managed Services Pricing Guide IT Server Downtime Issue And Support Dashboard Ppt Portfolio Infographic Template PDF
Presenting this set of slides with name cloud managed services pricing guide it server downtime issue and support dashboard ppt portfolio infographic template pdf. The topics discussed in these slide is it server downtime issue and support dashboard. This is a completely editable PowerPoint presentation and is available for immediate download. Download now and impress your audience.

Cross Selling Initiatives For Online And Offline Store Sales Dashboard For FMCG Cross Selling Sales Elements PDF
Deliver an awe inspiring pitch with this creative cross selling initiatives for online and offline store sales dashboard for fmcg cross selling sales elements pdf bundle. Topics like sales dashboard for fmcg cross selling can be discussed with this completely editable template. It is available for immediate download depending on the needs and requirements of the user.

Case Competition Reduction In Existing Customer Of Telecommunication Company Telecom Company User Base Dashboard Ppt Professional Picture PDF
Deliver an awe inspiring pitch with this creative case competition reduction in existing customer of telecommunication company telecom company user base dashboard ppt professional picture pdf bundle. Topics like telecom company user base dashboard can be discussed with this completely editable template. It is available for immediate download depending on the needs and requirements of the user.
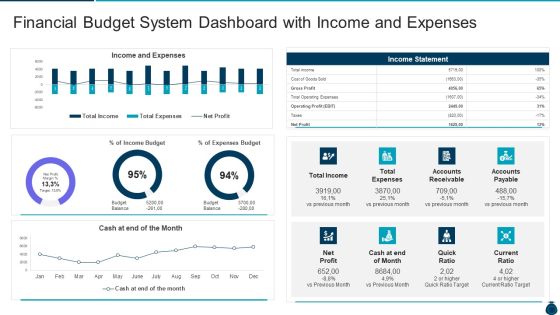
Key Elements And Techniques Of A Budgeting System Financial Budget System Dashboard With Income And Expenses Rules PDF
Deliver an awe inspiring pitch with this creative key elements and techniques of a budgeting system financial budget system dashboard with income and expenses rules pdf bundle. Topics like financial budget system dashboard with income and expenses can be discussed with this completely editable template. It is available for immediate download depending on the needs and requirements of the user.
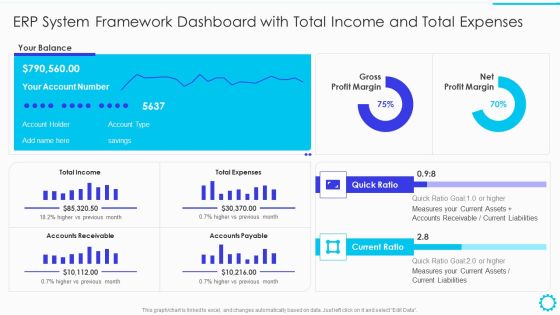
Summary Of Cloud ERP System Framework ERP System Framework Dashboard With Total Income And Total Expenses Guidelines PDF
Deliver an awe inspiring pitch with this creative Summary Of Cloud ERP System Framework ERP System Framework Dashboard With Total Income And Total Expenses Guidelines PDF bundle. Topics like ERP System Framework Dashboard With Total Income And Total Expenses can be discussed with this completely editable template. It is available for immediate download depending on the needs and requirements of the user.
Improving Brand Awareness Through WOM Marketing Dashboard For Tracking Marketing Activities At Social Media Platform Diagrams PDF
This slide covers information regarding the dashboard for tracking essential marketing activities at social media platform in terms of social traffic and conversion, referral traffic by site, key social media metrics. Deliver an awe inspiring pitch with this creative improving brand awareness through wom marketing dashboard for tracking marketing activities at social media platform diagrams pdf bundle. Topics like dashboard for tracking marketing activities at social media platform can be discussed with this completely editable template. It is available for immediate download depending on the needs and requirements of the user.
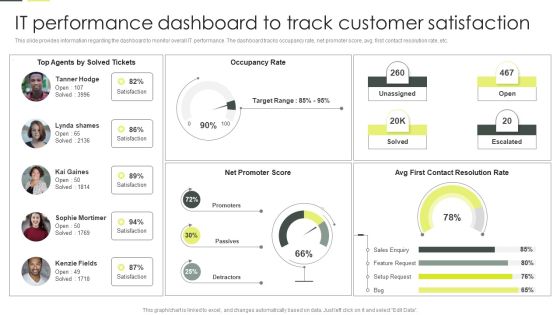
Building An IT Strategy Plan For Business Expansion IT Performance Dashboard To Track Customer Satisfaction Download PDF
This slide provides information regarding the dashboard to monitor overall IT performance. The dashboard tracks occupancy rate, net promoter score, avg. first contact resolution rate, etc. Find a pre designed and impeccable Building An IT Strategy Plan For Business Expansion IT Performance Dashboard To Track Customer Satisfaction Download PDF. The templates can ace your presentation without additional effort. You can download these easy to edit presentation templates to make your presentation stand out from others. So, what are you waiting for Download the template from Slidegeeks today and give a unique touch to your presentation.

Retail Kpi Dashboard Showing Revenue Vs Units Sold Top 5 Product Categories Ppt PowerPoint Presentation Layouts Designs Download
This is a retail kpi dashboard showing revenue vs units sold top 5 product categories ppt powerpoint presentation layouts designs download. This is a four stage process. The stages in this process are finance, strategy, analysis, marketing.
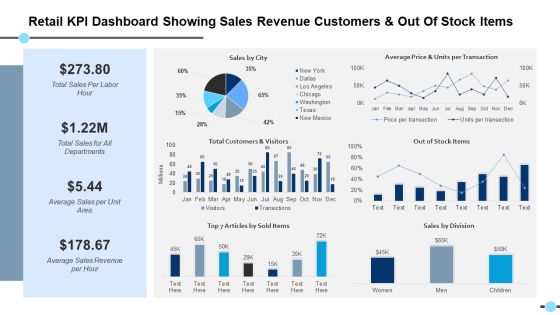
Retail Kpi Dashboard Showing Sales Revenue Customers And Out Of Stock Items Out Of Stock Items Ppt PowerPoint Presentation Files
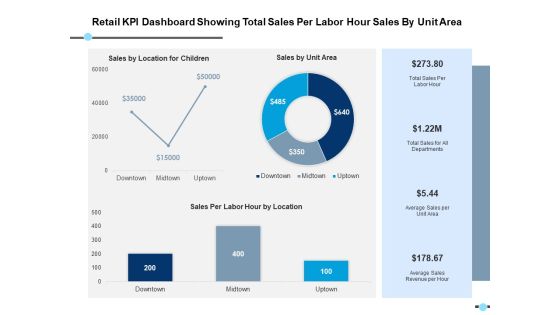
Retail Kpi Dashboard Showing Total Sales Per Labor Hour Sales By Unit Area Ppt PowerPoint Presentation Model Format
This is a retail kpi dashboard showing total sales per labor hour sales by unit area ppt powerpoint presentation model format. This is a three stage process. The stages in this process are finance, strategy, analysis, marketing.
