Data Dashboard
Talent Retention Initiatives For New Hire Onboarding Performance Dashboard Tracking Introduction PDF
This slide represents a dashboard tracking employee experience KPIs. It includes information about metrics such as employee engagement, experience vs expectation and intent to stay. Do you have to make sure that everyone on your team knows about any specific topic I yes, then you should give Talent Retention Initiatives For New Hire Onboarding Performance Dashboard Tracking Introduction PDF a try. Our experts have put a lot of knowledge and effort into creating this impeccable Talent Retention Initiatives For New Hire Onboarding Performance Dashboard Tracking Introduction PDF. You can use this template for your upcoming presentations, as the slides are perfect to represent even the tiniest detail. You can download these templates from the Slidegeeks website and these are easy to edit. So grab these today.
Effective Brand Reputation Management Customer Tracking Dashboard To Monitor Brand Introduction PDF
This slide provides information brand loyalty tracking dashboard in order to monitor customer engagement, average revenues, new vs. Returning visitors performance, etc. Formulating a presentation can take up a lot of effort and time, so the content and message should always be the primary focus. The visuals of the PowerPoint can enhance the presenters message, so our Effective Brand Reputation Management Customer Tracking Dashboard To Monitor Brand Introduction PDF was created to help save time. Instead of worrying about the design, the presenter can concentrate on the message while our designers work on creating the ideal templates for whatever situation is needed. Slidegeeks has experts for everything from amazing designs to valuable content, we have put everything into Effective Brand Reputation Management Customer Tracking Dashboard To Monitor Brand Introduction PDF.

Plan To Enhance Manufacturing Dashboard To Track Production Plant Machines Microsoft PDF
This slide represents the dashboard to track performance of production plants multiple machines in terms of efficiency and actual units manufactured. It also provides information regarding total machines running, down and under maintenance validation. Here you can discover an assortment of the finest PowerPoint and Google Slides templates. With these templates, you can create presentations for a variety of purposes while simultaneously providing your audience with an eye-catching visual experience. Download Plan To Enhance Manufacturing Dashboard To Track Production Plant Machines Microsoft PDF to deliver an impeccable presentation. These templates will make your job of preparing presentations much quicker, yet still, maintain a high level of quality. Slidegeeks has experienced researchers who prepare these templates and write high-quality content for you. Later on, you can personalize the content by editing the Plan To Enhance Manufacturing Dashboard To Track Production Plant Machines Microsoft PDF.
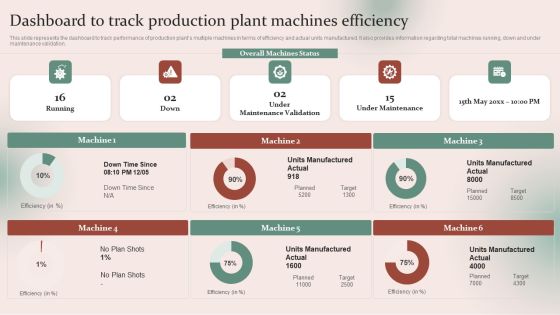
Strategies For Effective Manufacturing Dashboard To Track Production Plant Machines Themes PDF
This slide represents the dashboard to track performance of production plants multiple machines in terms of efficiency and actual units manufactured. It also provides information regarding total machines running, down and under maintenance validation. Here you can discover an assortment of the finest PowerPoint and Google Slides templates. With these templates, you can create presentations for a variety of purposes while simultaneously providing your audience with an eye-catching visual experience. Download Strategies For Effective Manufacturing Dashboard To Track Production Plant Machines Themes PDF to deliver an impeccable presentation. These templates will make your job of preparing presentations much quicker, yet still, maintain a high level of quality. Slidegeeks has experienced researchers who prepare these templates and write high-quality content for you. Later on, you can personalize the content by editing the Strategies For Effective Manufacturing Dashboard To Track Production Plant Machines Themes PDF.

KPI Metrics Dashboard To Evaluate Facebook Video Campaign Performance Introduction PDF
The following slide outlines a comprehensive KPI dashboard which can be used to analyze the performance of Facebook video campaign. It provides information about page video views, page video views organic etc. Formulating a presentation can take up a lot of effort and time, so the content and message should always be the primary focus. The visuals of the PowerPoint can enhance the presenters message, so our KPI Metrics Dashboard To Evaluate Facebook Video Campaign Performance Introduction PDF was created to help save time. Instead of worrying about the design, the presenter can concentrate on the message while our designers work on creating the ideal templates for whatever situation is needed. Slidegeeks has experts for everything from amazing designs to valuable content, we have put everything into KPI Metrics Dashboard To Evaluate Facebook Video Campaign Performance Introduction PDF.

Utilizing Twitter For Social Media Dashboard For Twitter Marketing Campaign Mockup PDF
This slide depicts the dashboard for twitter marketing campaign providing information regarding average engagement rate, hashtag and links clicks, impressions and followers gained. Formulating a presentation can take up a lot of effort and time, so the content and message should always be the primary focus. The visuals of the PowerPoint can enhance the presenters message, so our Utilizing Twitter For Social Media Dashboard For Twitter Marketing Campaign Mockup PDF was created to help save time. Instead of worrying about the design, the presenter can concentrate on the message while our designers work on creating the ideal templates for whatever situation is needed. Slidegeeks has experts for everything from amazing designs to valuable content, we have put everything into Utilizing Twitter For Social Media Dashboard For Twitter Marketing Campaign Mockup PDF.
Remodeling Experiential Departmental Store Ecosystem Dashboard To Track Retail Store Performance Icons PDF
This slide provides information regarding the dashboard to track retail store performance in terms of sales revenues, customers, sales by division, top collections generating revenues, etc. Here you can discover an assortment of the finest PowerPoint and Google Slides templates. With these templates, you can create presentations for a variety of purposes while simultaneously providing your audience with an eye catching visual experience. Download Remodeling Experiential Departmental Store Ecosystem Dashboard To Track Retail Store Performance Icons PDF to deliver an impeccable presentation. These templates will make your job of preparing presentations much quicker, yet still, maintain a high level of quality. Slidegeeks has experienced researchers who prepare these templates and write high quality content for you. Later on, you can personalize the content by editing the Remodeling Experiential Departmental Store Ecosystem Dashboard To Track Retail Store Performance Icons PDF.

Dashboard To Track IT Security Incidents Prevailing Across Firm Elements PDF
This slide portrays information regarding the dashboard that firm will track various incidents detected. These incidents will be managed in order to avoid security risks. Formulating a presentation can take up a lot of effort and time, so the content and message should always be the primary focus. The visuals of the PowerPoint can enhance the presenters message, so our Dashboard To Track IT Security Incidents Prevailing Across Firm Elements PDF was created to help save time. Instead of worrying about the design, the presenter can concentrate on the message while our designers work on creating the ideal templates for whatever situation is needed. Slidegeeks has experts for everything from amazing designs to valuable content, we have put everything into Dashboard To Track IT Security Incidents Prevailing Across Firm Elements PDF.

Deploying Corporate Aligned IT Strategy Dashboard To Track Essential Activities Associated With IT Department Structure PDF
This slide provides information regarding dashboard to monitor critical activities related to IT in terms of incident tracker, outage report, IT spend per employee, application trends, etc. Formulating a presentation can take up a lot of effort and time, so the content and message should always be the primary focus. The visuals of the PowerPoint can enhance the presenters message, so our Deploying Corporate Aligned IT Strategy Dashboard To Track Essential Activities Associated With IT Department Structure PDF was created to help save time. Instead of worrying about the design, the presenter can concentrate on the message while our designers work on creating the ideal templates for whatever situation is needed. Slidegeeks has experts for everything from amazing designs to valuable content, we have put everything into Deploying Corporate Aligned IT Strategy Dashboard To Track Essential Activities Associated With IT Department Structure PDF
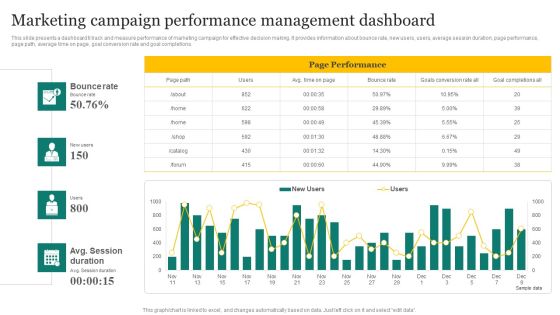
Strategic Promotion Plan Development Stages Marketing Campaign Performance Management Dashboard Formats PDF
This slide presents a dashboard ti track and measure performance of marketing campaign for effective decision making. It provides information about bounce rate, new users, users, average session duration, page performance, page path, average time on page, goal conversion rate and goal completions. Formulating a presentation can take up a lot of effort and time, so the content and message should always be the primary focus. The visuals of the PowerPoint can enhance the presenters message, so our Strategic Promotion Plan Development Stages Marketing Campaign Performance Management Dashboard Formats PDF was created to help save time. Instead of worrying about the design, the presenter can concentrate on the message while our designers work on creating the ideal templates for whatever situation is needed. Slidegeeks has experts for everything from amazing designs to valuable content, we have put everything into Strategic Promotion Plan Development Stages Marketing Campaign Performance Management Dashboard Formats PDF

Financial Kpi Dashboard To Measure Brand Performance Brand Value Estimation Guide Inspiration PDF
Mentioned slide showcases KPI dashboard that can be used to check the financial performance of a brand. Metrics covered in the dashboard are return on assets, working capital ratio, return on equity etc.Are you in need of a template that can accommodate all of your creative concepts This one is crafted professionally and can be altered to fit any style. Use it with Google Slides or PowerPoint. Include striking photographs, symbols, depictions, and other visuals. Fill, move around, or remove text boxes as desired. Test out color palettes and font mixtures. Edit and save your work, or work with colleagues. Download Financial Kpi Dashboard To Measure Brand Performance Brand Value Estimation Guide Inspiration PDF and observe how to make your presentation outstanding. Give an impeccable presentation to your group and make your presentation unforgettable.

Collaborative Robots IT Dashboard To Track Cobot Performance Ppt Slides Guidelines PDF
This slide represents the cobots performance dashboard by covering details of battery level, performance, total hours, average time, time to return, energy consumption, and so on. If you are looking for a format to display your unique thoughts, then the professionally designed Collaborative Robots IT Dashboard To Track Cobot Performance Ppt Slides Guidelines PDF is the one for you. You can use it as a Google Slides template or a PowerPoint template. Incorporate impressive visuals, symbols, images, and other charts. Modify or reorganize the text boxes as you desire. Experiment with shade schemes and font pairings. Alter, share or cooperate with other people on your work. Download Collaborative Robots IT Dashboard To Track Cobot Performance Ppt Slides Guidelines PDF and find out how to give a successful presentation. Present a perfect display to your team and make your presentation unforgettable.
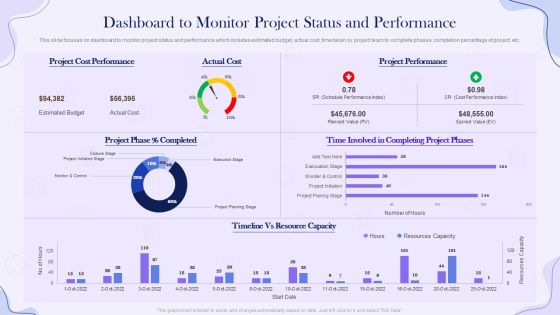
Project Time Management Execution Strategies Dashboard To Monitor Project Status And Performance Summary PDF
This slide focuses on dashboard to monitor project status and performance which includes estimated budget, actual cost, time taken by project team to complete phases, completion percentage of project, etc. If you are looking for a format to display your unique thoughts, then the professionally designed Project Time Management Execution Strategies Dashboard To Monitor Project Status And Performance Summary PDF is the one for you. You can use it as a Google Slides template or a PowerPoint template. Incorporate impressive visuals, symbols, images, and other charts. Modify or reorganize the text boxes as you desire. Experiment with shade schemes and font pairings. Alter, share or cooperate with other people on your work. Download Project Time Management Execution Strategies Dashboard To Monitor Project Status And Performance Summary PDF and find out how to give a successful presentation. Present a perfect display to your team and make your presentation unforgettable.

Introduction To New Product Portfolio Dashboard To Measure Business Performance Ppt Ideas Clipart Images PDF
This slide illustrates a dashboard that can be used by a product manager to measure the business performance. Metrics covered in the dashboard are revenue, launches, cash flow, EPS, average revenue by product and average cost by phase. Are you in need of a template that can accommodate all of your creative concepts. This one is crafted professionally and can be altered to fit any style. Use it with Google Slides or PowerPoint. Include striking photographs, symbols, depictions, and other visuals. Fill, move around, or remove text boxes as desired. Test out color palettes and font mixtures. Edit and save your work, or work with colleagues. Download Introduction To New Product Portfolio Dashboard To Measure Business Performance Ppt Ideas Clipart Images PDF and observe how to make your presentation outstanding. Give an impeccable presentation to your group and make your presentation unforgettable.

Business Restructuring Process Dashboard To Measure Business Financial Performance Rules PDF
This slide shows the dashboard to measure business financial performance which focuses on revenues, debt to equity, net profit margin, gross profit margin and return on equity. If you are looking for a format to display your unique thoughts, then the professionally designed Business Restructuring Process Dashboard To Measure Business Financial Performance Rules PDF is the one for you. You can use it as a Google Slides template or a PowerPoint template. Incorporate impressive visuals, symbols, images, and other charts. Modify or reorganize the text boxes as you desire. Experiment with shade schemes and font pairings. Alter, share or cooperate with other people on your work. Download Business Restructuring Process Dashboard To Measure Business Financial Performance Rules PDF and find out how to give a successful presentation. Present a perfect display to your team and make your presentation unforgettable.

Using Social Media Platforms To Enhance Dashboard For Monitoring Social Media Traffic Structure PDF
This slide shows dashboard for tracking social media traffic. It provides details about sessions, bounce rate, average time on platform, pages per visit, clicks, goals, goal conversion rate, Facebook, Instagram, YouTube, Snapchat, etc. If you are looking for a format to display your unique thoughts, then the professionally designed Using Social Media Platforms To Enhance Dashboard For Monitoring Social Media Traffic Structure PDF is the one for you. You can use it as a Google Slides template or a PowerPoint template. Incorporate impressive visuals, symbols, images, and other charts. Modify or reorganize the text boxes as you desire. Experiment with shade schemes and font pairings. Alter, share or cooperate with other people on your work. Download Using Social Media Platforms To Enhance Dashboard For Monitoring Social Media Traffic Structure PDF and find out how to give a successful presentation. Present a perfect display to your team and make your presentation unforgettable.
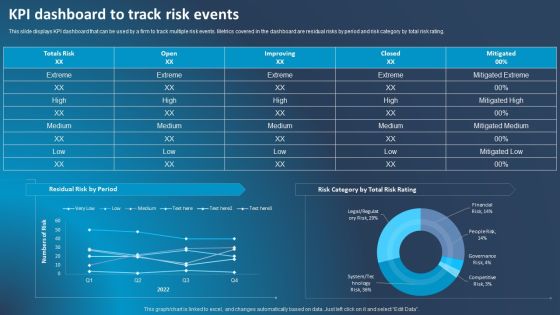
Improving Corporate Performance KPI Dashboard To Track Risk Events Sample PDF
This slide displays KPI dashboard that can be used by a firm to track multiple risk events. Metrics covered in the dashboard are residual risks by period and risk category by total risk rating. Are you in need of a template that can accommodate all of your creative concepts This one is crafted professionally and can be altered to fit any style. Use it with Google Slides or PowerPoint. Include striking photographs, symbols, depictions, and other visuals. Fill, move around, or remove text boxes as desired. Test out color palettes and font mixtures. Edit and save your work, or work with colleagues. Download Improving Corporate Performance KPI Dashboard To Track Risk Events Sample PDF and observe how to make your presentation outstanding. Give an impeccable presentation to your group and make your presentation unforgettable.

Dashboard For Cloud Storage Tracking Ppt PowerPoint Presentation File Layouts PDF
This slide represents the dashboard for cloud storage tracking by covering details of users, available workspaces, shared files, downloads, uploads, and moves. If you are looking for a format to display your unique thoughts, then the professionally designed Dashboard For Cloud Storage Tracking Ppt PowerPoint Presentation File Layouts PDF is the one for you. You can use it as a Google Slides template or a PowerPoint template. Incorporate impressive visuals, symbols, images, and other charts. Modify or reorganize the text boxes as you desire. Experiment with shade schemes and font pairings. Alter, share or cooperate with other people on your work. Download Dashboard For Cloud Storage Tracking Ppt PowerPoint Presentation File Layouts PDF and find out how to give a successful presentation. Present a perfect display to your team and make your presentation unforgettable.
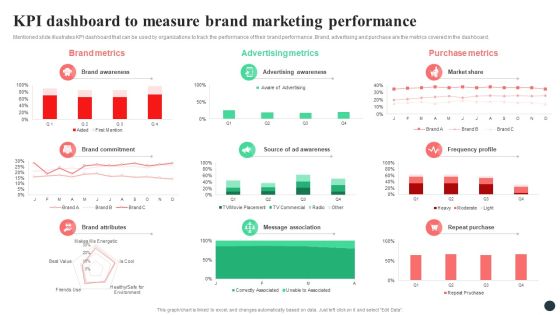
Strategic Guide For Positioning Expanded Brand KPI Dashboard To Measure Brand Marketing Performance Graphics PDF
Mentioned slide illustrates KPI dashboard that can be used by organizations to track the performance of their brand performance. Brand, advertising and purchase are the metrics covered in the dashboard. Are you in need of a template that can accommodate all of your creative concepts. This one is crafted professionally and can be altered to fit any style. Use it with Google Slides or PowerPoint. Include striking photographs, symbols, depictions, and other visuals. Fill, move around, or remove text boxes as desired. Test out color palettes and font mixtures. Edit and save your work, or work with colleagues. Download Strategic Guide For Positioning Expanded Brand KPI Dashboard To Measure Brand Marketing Performance Graphics PDF and observe how to make your presentation outstanding. Give an impeccable presentation to your group and make your presentation unforgettable.

Brand Marketing Strategy Dashboard To Track Online Brand Marketing Campaigns Template PDF
This slide showcases dashboard that can help organization to track the results of online brand marketing campaigns. Its key elements are leads breakdown,web traffic, lead to trial, organic search, website traffic, web users etc. If you are looking for a format to display your unique thoughts, then the professionally designed Brand Marketing Strategy Dashboard To Track Online Brand Marketing Campaigns Template PDF is the one for you. You can use it as a Google Slides template or a PowerPoint template. Incorporate impressive visuals, symbols, images, and other charts. Modify or reorganize the text boxes as you desire. Experiment with shade schemes and font pairings. Alter, share or cooperate with other people on your work. Download Brand Marketing Strategy Dashboard To Track Online Brand Marketing Campaigns Template PDF and find out how to give a successful presentation. Present a perfect display to your team and make your presentation unforgettable.

Brand Marketing Strategy Dashboard To Track Traffic On Brand Website Template PDF
This slide showcases dashboard that can help organization to analyze and evaluate the website traffic after new brand launch. Its key elements are unique page views, average time on page, channel sessions, page views, bounce rate etc. If you are looking for a format to display your unique thoughts, then the professionally designed Brand Marketing Strategy Dashboard To Track Traffic On Brand Website Template PDF is the one for you. You can use it as a Google Slides template or a PowerPoint template. Incorporate impressive visuals, symbols, images, and other charts. Modify or reorganize the text boxes as you desire. Experiment with shade schemes and font pairings. Alter, share or cooperate with other people on your work. Download Brand Marketing Strategy Dashboard To Track Traffic On Brand Website Template PDF and find out how to give a successful presentation. Present a perfect display to your team and make your presentation unforgettable.

Customer Service Plan To Improve Sales Dashboard Depicting Customer Service Insights Inspiration PDF
This slide shows the dashboard that depicts customer service insights which includes number of solved tickets, average resolution and response time, customer feedback, total visitors and chats. If you are looking for a format to display your unique thoughts, then the professionally designed Customer Service Plan To Improve Sales Dashboard Depicting Customer Service Insights Inspiration PDF is the one for you. You can use it as a Google Slides template or a PowerPoint template. Incorporate impressive visuals, symbols, images, and other charts. Modify or reorganize the text boxes as you desire. Experiment with shade schemes and font pairings. Alter, share or cooperate with other people on your work. Download Customer Service Plan To Improve Sales Dashboard Depicting Customer Service Insights Inspiration PDF and find out how to give a successful presentation. Present a perfect display to your team and make your presentation unforgettable.

Optimizing Production Process Smart Manufacturing Dashboard To Track Production Diagrams PDF
This slide represents smart manufacturing dashboard. It covers production volume, downtime causes, top product sold item, sales revenue, active machinery etc. If you are looking for a format to display your unique thoughts, then the professionally designed Optimizing Production Process Smart Manufacturing Dashboard To Track Production Diagrams PDF is the one for you. You can use it as a Google Slides template or a PowerPoint template. Incorporate impressive visuals, symbols, images, and other charts. Modify or reorganize the text boxes as you desire. Experiment with shade schemes and font pairings. Alter, share or cooperate with other people on your work. Download Optimizing Production Process Smart Manufacturing Dashboard To Track Production Diagrams PDF and find out how to give a successful presentation. Present a perfect display to your team and make your presentation unforgettable.

Direct Response Marketing Guide Ultimate Success Dashboard To Track Progress Diagrams PDF
This slide provides an overview of the dashboard depicting the status of the digital marketing campaign with the help of performance metrics. The dashboard includes ad spend, return on ad spend, purchase rate and cost per order. Are you in need of a template that can accommodate all of your creative concepts This one is crafted professionally and can be altered to fit any style. Use it with Google Slides or PowerPoint. Include striking photographs, symbols, depictions, and other visuals. Fill, move around, or remove text boxes as desired. Test out color palettes and font mixtures. Edit and save your work, or work with colleagues. Download Direct Response Marketing Guide Ultimate Success Dashboard To Track Progress Diagrams PDF and observe how to make your presentation outstanding. Give an impeccable presentation to your group and make your presentation unforgettable.
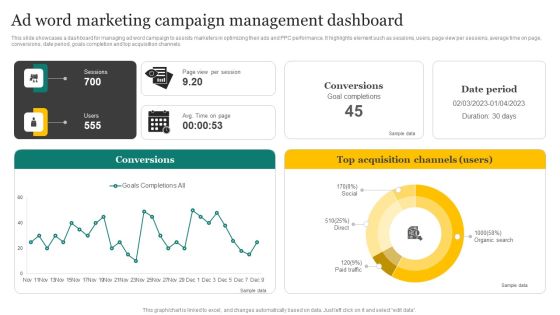
Strategic Promotion Plan Development Stages Ad Word Marketing Campaign Management Dashboard Template PDF
This slide showcases a dashboard for managing ad word campaign to assists marketers in optimizing their ads and PPC performance. It highlights element such as sessions, users, page view per sessions, average time on page, conversions, date period, goals completion and top acquisition channels. If you are looking for a format to display your unique thoughts, then the professionally designed Strategic Promotion Plan Development Stages Ad Word Marketing Campaign Management Dashboard Template PDF is the one for you. You can use it as a Google Slides template or a PowerPoint template. Incorporate impressive visuals, symbols, images, and other charts. Modify or reorganize the text boxes as you desire. Experiment with shade schemes and font pairings. Alter, share or cooperate with other people on your work. Download Strategic Promotion Plan Development Stages Ad Word Marketing Campaign Management Dashboard Template PDF and find out how to give a successful presentation. Present a perfect display to your team and make your presentation unforgettable.

Categories Of Segmenting And Profiling Customers Customer Demographics Segmentation Dashboard Guidelines PDF
This slide showcases a dashboard for segmenting customers based on demographics factors. It includes key components such as make population by age, female population by age, number of male customers and number of female customers. If you are looking for a format to display your unique thoughts, then the professionally designed Categories Of Segmenting And Profiling Customers Customer Demographics Segmentation Dashboard Guidelines PDF is the one for you. You can use it as a Google Slides template or a PowerPoint template. Incorporate impressive visuals, symbols, images, and other charts. Modify or reorganize the text boxes as you desire. Experiment with shade schemes and font pairings. Alter, share or cooperate with other people on your work. Download Categories Of Segmenting And Profiling Customers Customer Demographics Segmentation Dashboard Guidelines PDF and find out how to give a successful presentation. Present a perfect display to your team and make your presentation unforgettable.
Effective Lead Generation For Higher Conversion Rates Dashboard For Tracking Leads Generated From Various Guidelines PDF
This slide covers the KPI dashboard for tracking metrics such as leads, ACV wins, customer acquisition cost, click-through rate, and cost per conversion. It also includes leads per various campaigns such as social media, paid marketing, email marketing, etc. If you are looking for a format to display your unique thoughts, then the professionally designed Effective Lead Generation For Higher Conversion Rates Dashboard For Tracking Leads Generated From Various Guidelines PDF is the one for you. You can use it as a Google Slides template or a PowerPoint template. Incorporate impressive visuals, symbols, images, and other charts. Modify or reorganize the text boxes as you desire. Experiment with shade schemes and font pairings. Alter, share or cooperate with other people on your work. Download Effective Lead Generation For Higher Conversion Rates Dashboard For Tracking Leads Generated From Various Guidelines PDF and find out how to give a successful presentation. Present a perfect display to your team and make your presentation unforgettable.
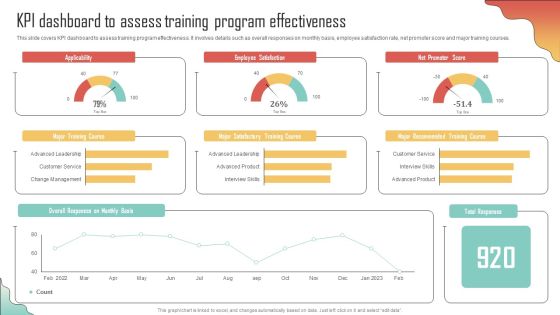
KPI Dashboard Assess Training Program Effectiveness Enhancing Organization Productivity By Implementing Graphics PDF
This slide covers KPI dashboard to assess training program effectiveness. It involves details such as overall responses on monthly basis, employee satisfaction rate, net promoter score and major training courses. If you are looking for a format to display your unique thoughts, then the professionally designed KPI Dashboard Assess Training Program Effectiveness Enhancing Organization Productivity By Implementing Graphics PDF is the one for you. You can use it as a Google Slides template or a PowerPoint template. Incorporate impressive visuals, symbols, images, and other charts. Modify or reorganize the text boxes as you desire. Experiment with shade schemes and font pairings. Alter, share or cooperate with other people on your work. Download KPI Dashboard Assess Training Program Effectiveness Enhancing Organization Productivity By Implementing Graphics PDF and find out how to give a successful presentation. Present a perfect display to your team and make your presentation unforgettable.

Iot Integration In Manufacturing Predictive Analytics Dashboard To Track Manufacturing Operations Background PDF
This slide depicts the predictive analytics dashboard to track manufacturing operations, including production volume, order volume, active machines, sales revenue, top five products, downtime causes, production volume by top five machines, and so on. If you are looking for a format to display your unique thoughts, then the professionally designed Iot Integration In Manufacturing Predictive Analytics Dashboard To Track Manufacturing Operations Background PDF is the one for you. You can use it as a Google Slides template or a PowerPoint template. Incorporate impressive visuals, symbols, images, and other charts. Modify or reorganize the text boxes as you desire. Experiment with shade schemes and font pairings. Alter, share or cooperate with other people on your work. Download Iot Integration In Manufacturing Predictive Analytics Dashboard To Track Manufacturing Operations Background PDF and find out how to give a successful presentation. Present a perfect display to your team and make your presentation unforgettable.
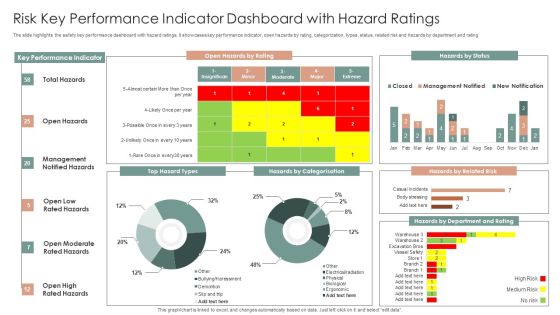
Risk Key Performance Indicator Dashboard With Hazard Ratings Ppt Layouts Slideshow PDF
The slide highlights the safety key performance dashboard with hazard ratings. It showcases key performance indicator, open hazards by rating, categorization, types, status, related risk and hazards by department and rating. Showcasing this set of slides titled Risk Key Performance Indicator Dashboard With Hazard Ratings Ppt Layouts Slideshow PDF. The topics addressed in these templates are Key Performance Indicator, Open Hazards, Hazards By Status. All the content presented in this PPT design is completely editable. Download it and make adjustments in color, background, font etc. as per your unique business setting.

You Tube Advertising Dashboard With Key Performance Indicators Ppt Outline Graphics Example PDF
This slide represents the dashboard showing the performance of the you tube marketing channel along with their key performance indicators. It includes details related to the no. of subscribers, top 5 most viewed videos etc. Showcasing this set of slides titled You Tube Advertising Dashboard With Key Performance Indicators Ppt Outline Graphics Example PDF. The topics addressed in these templates are Subscribers Gender, Subscribers Age Group, Top 5 Videos. All the content presented in this PPT design is completely editable. Download it and make adjustments in color, background, font etc. as per your unique business setting.

Comparative Health And Risk Key Performance Indicator Dashboard Ppt Portfolio Slide PDF
The slide highlights the comparative health and safety key performance indicator dashboard. It shows current year and previous events, safety incident classification, safety cases by place, map and safety consequence. Showcasing this set of slides titled Comparative Health And Risk Key Performance Indicator Dashboard Ppt Portfolio Slide PDF. The topics addressed in these templates are Safety Consequence, Safety Incidents Classification, Map. All the content presented in this PPT design is completely editable. Download it and make adjustments in color, background, font etc. as per your unique business setting.

Employee Health And Risk Key Performance Indicator Dashboard Ppt Layouts Brochure PDF
The following slide highlights the employee health and safety key performance indicator dashboard illustrating narrow escapes, potential hazards, improvement opportunity, total incidents, health and safety learning, safety visit by management, ltir and trir, severe injuries and fatalities and safety goals. Showcasing this set of slides titled Employee Health And Risk Key Performance Indicator Dashboard Ppt Layouts Brochure PDF. The topics addressed in these templates are Narrow Escapes, Potential Hazards, Improvement Opportunity. All the content presented in this PPT design is completely editable. Download it and make adjustments in color, background, font etc. as per your unique business setting.
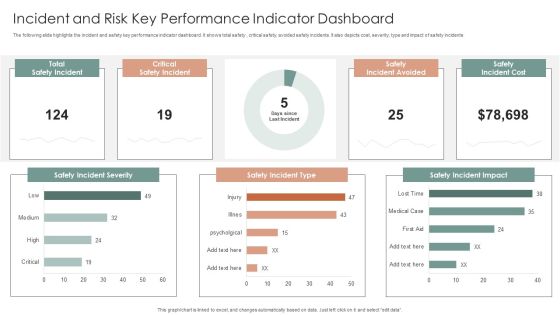
Incident And Risk Key Performance Indicator Dashboard Ppt Gallery Mockup PDF
The following slide highlights the incident and safety key performance indicator dashboard. It shows total safety, critical safety, avoided safety incidents. It also depicts cost, severity, type and impact of safety incidents. Showcasing this set of slides titled Incident And Risk Key Performance Indicator Dashboard Ppt Gallery Mockup PDF. The topics addressed in these templates are Safety Incident Severity, Safety Incident Type, Safety Incident Impact. All the content presented in this PPT design is completely editable. Download it and make adjustments in color, background, font etc. as per your unique business setting.

Risk Awareness And Risk Key Performance Indicator Dashboard Ppt Inspiration Ideas PDF
The following slide highlights the risk awareness and safety key performance indicator dashboard illustrating risk awareness, clear leadership, risk mitigation preparedness, risk incidents last month, safety incidents last months, inspection plan adherence, risk and safety quality training, trained people last month, monitoring, safety tools change on and risk awareness. Showcasing this set of slides titled Risk Awareness And Risk Key Performance Indicator Dashboard Ppt Inspiration Ideas PDF. The topics addressed in these templates are Safety Incident Avoided, Safety Incidents, Safety Incident, Accumulated Total. All the content presented in this PPT design is completely editable. Download it and make adjustments in color, background, font etc. as per your unique business setting.
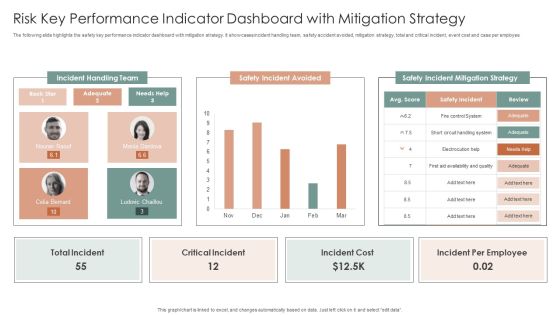
Risk Key Performance Indicator Dashboard With Mitigation Strategy Ppt Inspiration Design Templates PDF
The following slide highlights the safety key performance indicator dashboard with mitigation strategy. It showcases incident handling team, safety accident avoided, mitigation strategy, total and critical incident, event cost and case per employee. Showcasing this set of slides titled Risk Key Performance Indicator Dashboard With Mitigation Strategy Ppt Inspiration Design Templates PDF. The topics addressed in these templates are Incident Handling Team, Safety Incident Avoided, Safety Incident. All the content presented in this PPT design is completely editable. Download it and make adjustments in color, background, font etc. as per your unique business setting.
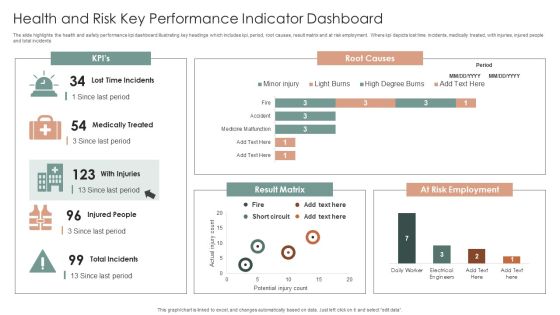
Health And Risk Key Performance Indicator Dashboard Ppt Layouts Graphics Design PDF
The slide highlights the health and safety performance kpi dashboard illustrating key headings which includes kpi, period, root causes, result matrix and at risk employment. Where kpi depicts lost time incidents, medically treated, with injuries, injured people and total incidents. Showcasing this set of slides titled Health And Risk Key Performance Indicator Dashboard Ppt Layouts Graphics Design PDF. The topics addressed in these templates are Root Causes, Result Matrix, At Risk Employment. All the content presented in this PPT design is completely editable. Download it and make adjustments in color, background, font etc. as per your unique business setting.

Digital And Offline Marketing Campaign Comparison Dashboard Ppt Inspiration Microsoft PDF
This slide showcases analysis of offline and online marketing in a dashboard covering key metrics. Performance indicators involved are purchases, free trial pay up rate and sign ups and monthly visitors. Pitch your topic with ease and precision using this Digital And Offline Marketing Campaign Comparison Dashboard Ppt Inspiration Microsoft PDF. This layout presents information on Online Marketing, Offline Marketing, Free Trial Sign, UPS. It is also available for immediate download and adjustment. So, changes can be made in the color, design, graphics or any other component to create a unique layout.

Procedure To Establish Project Administration Program Dashboard Depicting Project Associated Risks And Issues Mockup PDF
This slide focuses on project management dashboard which covers the project name, status date overall status, monthly schedule such as analysis, development, quality assurance, user acceptance, pre production and support with actual and planned budget, pending decisions and actions, etc. Get a simple yet stunning designed Procedure To Establish Project Administration Program Dashboard Depicting Project Associated Risks And Issues Mockup PDF. It is the best one to establish the tone in your meetings. It is an excellent way to make your presentations highly effective. So, download this PPT today from Slidegeeks and see the positive impacts. Our easy to edit Procedure To Establish Project Administration Program Dashboard Depicting Project Associated Risks And Issues Mockup PDF can be your go to option for all upcoming conferences and meetings. So, what are you waiting for. Grab this template today.
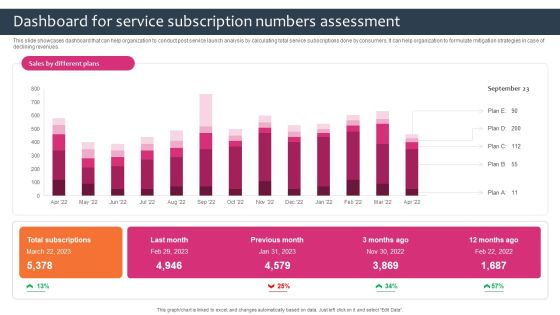
Promotion Sales Techniques For New Service Introduction Dashboard For Service Subscription Pictures PDF
This slide showcases dashboard that can help organization to conduct post service launch analysis by calculating total service subscriptions done by consumers. It can help organization to formulate mitigation strategies in case of declining revenues. Do you have to make sure that everyone on your team knows about any specific topic I yes, then you should give Promotion Sales Techniques For New Service Introduction Dashboard For Service Subscription Pictures PDF a try. Our experts have put a lot of knowledge and effort into creating this impeccable Promotion Sales Techniques For New Service Introduction Dashboard For Service Subscription Pictures PDF. You can use this template for your upcoming presentations, as the slides are perfect to represent even the tiniest detail. You can download these templates from the Slidegeeks website and these are easy to edit. So grab these today.

Logistics KPI Status Dashboard With Monthly KPI Ppt Infographic Template Layout PDF
The following slide highlights the transportation status dashboard with monthly KPI illustrating order status with customer, order date and delivery date. It shows financial performance for four quarters as well as todays order, inventory and monthly KPI with Inventory, shipping cost for past 30 days. Pitch your topic with ease and precision using this Logistics KPI Status Dashboard With Monthly KPI Ppt Infographic Template Layout PDF. This layout presents information on Order Status, Today Order, Inventory, Monthly KPI. It is also available for immediate download and adjustment. So, changes can be made in the color, design, graphics or any other component to create a unique layout.

Manager Dashboard For Tracking Team Performance Ratings Building Efficient Workplace Performance Graphics PDF
This slide illustrates manager dashboard for tracking team progress and performance rankings. It provides information about assessment progress, current status, skill feedback, team player, alignment, communication, interpersonal, etc.Find highly impressive Manager Dashboard For Tracking Team Performance Ratings Building Efficient Workplace Performance Graphics PDF on Slidegeeks to deliver a meaningful presentation. You can save an ample amount of time using these presentation templates. No need to worry to prepare everything from scratch because Slidegeeks experts have already done a huge research and work for you. You need to download Manager Dashboard For Tracking Team Performance Ratings Building Efficient Workplace Performance Graphics PDF for your upcoming presentation. All the presentation templates are 100precent editable and you can change the color and personalize the content accordingly. Download now.

Supply Chain And Logistics Rpa Management Dashboard Automated Manufacturing Process Deployment Ideas PDF
This slide illustrates supply chain and logistics robotic process automation RPA management dashboard. It provides information about active bots, bot hours, carton pickup, pickup productivity, etc.Explore a selection of the finest Supply Chain And Logistics Rpa Management Dashboard Automated Manufacturing Process Deployment Ideas PDF here. With a plethora of professionally designed and pre-made slide templates, you can quickly and easily find the right one for your upcoming presentation. You can use our Supply Chain And Logistics Rpa Management Dashboard Automated Manufacturing Process Deployment Ideas PDF to effectively convey your message to a wider audience. Slidegeeks has done a lot of research before preparing these presentation templates. The content can be personalized and the slides are highly editable. Grab templates today from Slidegeeks.
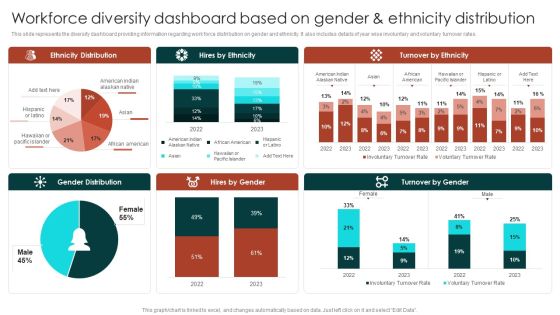
Workforce Diversity Dashboard Based On Gender And Ethnicity Distribution Guidelines PDF
This slide represents the diversity dashboard providing information regarding work force distribution on gender and ethnicity. It also includes details of year wise involuntary and voluntary turnover rates. Find highly impressive Workforce Diversity Dashboard Based On Gender And Ethnicity Distribution Guidelines PDF on Slidegeeks to deliver a meaningful presentation. You can save an ample amount of time using these presentation templates. No need to worry to prepare everything from scratch because Slidegeeks experts have already done a huge research and work for you. You need to download Workforce Diversity Dashboard Based On Gender And Ethnicity Distribution Guidelines PDF for your upcoming presentation. All the presentation templates are 100 Percent editable and you can change the color and personalize the content accordingly. Download now.
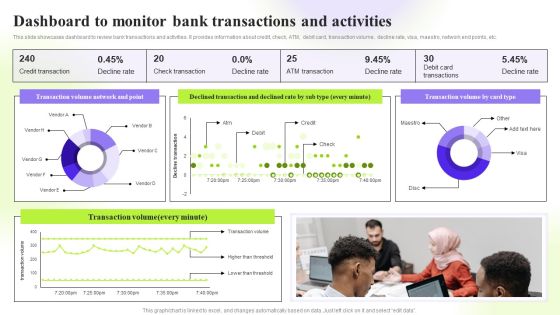
Techniques To Monitor Transactions Dashboard To Monitor Bank Transactions And Activities Introduction PDF
This slide showcases dashboard to review bank transactions and activities. It provides information about credit, check, ATM, debit card, transaction volume, decline rate, visa, maestro, network end points, etc. Find highly impressive Techniques To Monitor Transactions Dashboard To Monitor Bank Transactions And Activities Introduction PDF on Slidegeeks to deliver a meaningful presentation. You can save an ample amount of time using these presentation templates. No need to worry to prepare everything from scratch because Slidegeeks experts have already done a huge research and work for you. You need to download Techniques To Monitor Transactions Dashboard To Monitor Bank Transactions And Activities Introduction PDF for your upcoming presentation. All the presentation templates are 100 percent editable and you can change the color and personalize the content accordingly. Download now.
Umbrella Branding Measures To Boost Brand Awareness Corporate Branding Performance Tracking Dashboard Graphics PDF
This slide provides information regarding corporate branding performance tracking dashboard in terms of leads, conversion metrics, web traffic, etc. Find highly impressive Umbrella Branding Measures To Boost Brand Awareness Corporate Branding Performance Tracking Dashboard Graphics PDF on Slidegeeks to deliver a meaningful presentation. You can save an ample amount of time using these presentation templates. No need to worry to prepare everything from scratch because Slidegeeks experts have already done a huge research and work for you. You need to download Umbrella Branding Measures To Boost Brand Awareness Corporate Branding Performance Tracking Dashboard Graphics PDF for your upcoming presentation. All the presentation templates are 100 percent editable and you can change the color and personalize the content accordingly. Download now
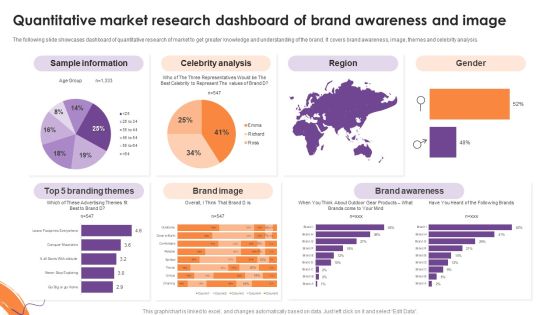
Quantitative Market Research Dashboard Of Brand Awareness And Image Inspiration PDF
The following slide showcases dashboard of quantitative research of market to get greater knowledge and understanding of the brand. It covers brand awareness, image, themes and celebrity analysis. Showcasing this set of slides titled Quantitative Market Research Dashboard Of Brand Awareness And Image Inspiration PDF. The topics addressed in these templates are Celebrity Analysis, Sample Information, Brand Awareness. All the content presented in this PPT design is completely editable. Download it and make adjustments in color, background, font etc. as per your unique business setting.
Project Resource Levelling And Budget Allocation Dashboard Ppt PowerPoint Presentation Layouts Icons PDF
This slide defines the dashboard for analyzing the resources and allocating the budget. It includes information related to the project budget, budget analysis and levelling resources. Showcasing this set of slides titled Project Resource Levelling And Budget Allocation Dashboard Ppt PowerPoint Presentation Layouts Icons PDF. The topics addressed in these templates are Project Budget, Key Members, Budget Analysis. All the content presented in this PPT design is completely editable. Download it and make adjustments in color, background, font etc. as per your unique business setting.
Multiple Project Progress Tracking Report Dashboard With Key Performance Indicators Brochure PDF
This slide shows the dashboard representing status of various projects and tracking their performance with the help of key performance indicators which are as follows schedule, budget, resources, risk and issues and quality of projects.Pitch your topic with ease and precision using this Multiple Project Progress Tracking Report Dashboard With Key Performance Indicators Brochure PDF. This layout presents information on Risks Issues, Quality Open Defects, Techno Blogger. It is also available for immediate download and adjustment. So, changes can be made in the color, design, graphics or any other component to create a unique layout.

Risk Key Performance Indicator Dashboard For Manufacturing Company Ppt Gallery Graphics Design PDF
The following slide highlights the safety key performance indicator dashboard for manufacturing company. It showcases safety incident per employee, total number of cases, safety events avoided, accumulated total and safety incidents. Pitch your topic with ease and precision using this Risk Key Performance Indicator Dashboard For Manufacturing Company Ppt Gallery Graphics Design PDF. This layout presents information on Safety Incidents, Safety Incident Avoided, Safety Incident Accumulated. It is also available for immediate download and adjustment. So, changes can be made in the color, design, graphics or any other component to create a unique layout.
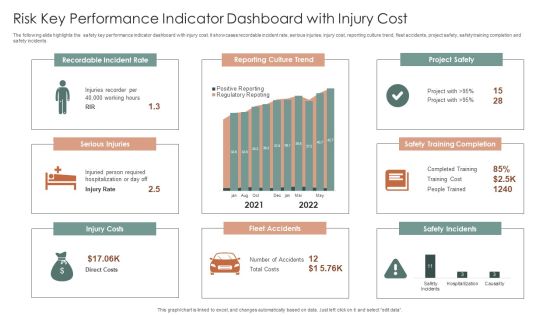
Risk Key Performance Indicator Dashboard With Injury Cost Ppt Summary Brochure PDF
The following slide highlights the safety key performance indicator dashboard with injury cost. It showcases recordable incident rate, serious injuries, injury cost, reporting culture trend, fleet accidents, project safety, safety training completion and safety incidents. Pitch your topic with ease and precision using this Risk Key Performance Indicator Dashboard With Injury Cost Ppt Summary Brochure PDF. This layout presents information on Recordable Incident Rate, Reporting Culture Trend, Project Safety. It is also available for immediate download and adjustment. So, changes can be made in the color, design, graphics or any other component to create a unique layout.
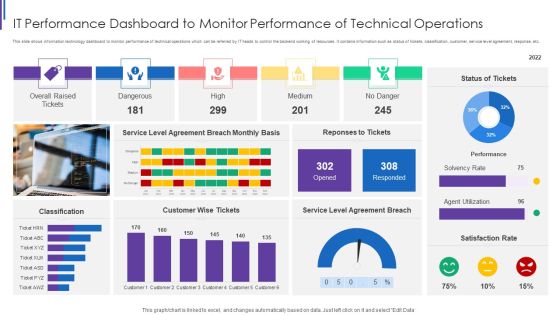
IT Performance Dashboard To Monitor Performance Of Technical Operations Download PDF
This slide shows information technology dashboard to monitor performance of technical operations which can be referred by IT heads to control the backend working of resources. It contains information such as status of tickets, classification, customer, service level agreement, response, etc. Showcasing this set of slides titled IT Performance Dashboard To Monitor Performance Of Technical Operations Download PDF. The topics addressed in these templates are Overall Raised Tickets, Dangerous High Medium, Service Level Agreement, Customer Wise Tickets. All the content presented in this PPT design is completely editable. Download it and make adjustments in color, background, font etc. as per your unique business setting.
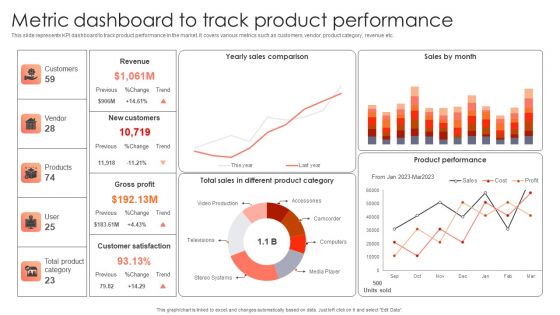
Management Plan For Product Life Cycle Metric Dashboard To Track Product Performance Infographics PDF
This slide represents KPI dashboard to track product performance in the market. It covers various metrics such as customers, vendor, product category, revenue etc. Slidegeeks has constructed Management Plan For Product Life Cycle Metric Dashboard To Track Product Performance Infographics PDF after conducting extensive research and examination. These presentation templates are constantly being generated and modified based on user preferences and critiques from editors. Here, you will find the most attractive templates for a range of purposes while taking into account ratings and remarks from users regarding the content. This is an excellent jumping-off point to explore our content and will give new users an insight into our top-notch PowerPoint Templates.

ICT Service Management Dashboard To Track Customer Support Team Performance Summary PDF
This slide represents ICT Information and Communication Technology service management dashboard. It includes KPIs such as support requests, tickets raised etc. Want to ace your presentation in front of a live audience Our ICT Service Management Dashboard To Track Customer Support Team Performance Summary PDF can help you do that by engaging all the users towards you. Slidegeeks experts have put their efforts and expertise into creating these impeccable powerpoint presentations so that you can communicate your ideas clearly. Moreover, all the templates are customizable, and easy to edit and downloadable. Use these for both personal and commercial use.
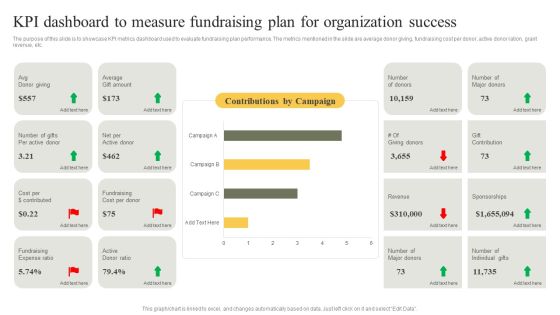
KPI Dashboard To Measure Fundraising Plan For Organization Success Infographics PDF
The purpose of this slide is to showcase KPI metrics dashboard used to evaluate fundraising plan performance. The metrics mentioned in the slide are average donor giving, fundraising cost per donor, active donor ration, grant revenue, etc. Showcasing this set of slides titled KPI Dashboard To Measure Fundraising Plan For Organization Success Infographics PDF. The topics addressed in these templates are Fundraising Cost, Average, Ratio. All the content presented in this PPT design is completely editable. Download it and make adjustments in color, background, font etc. as per your unique business setting.
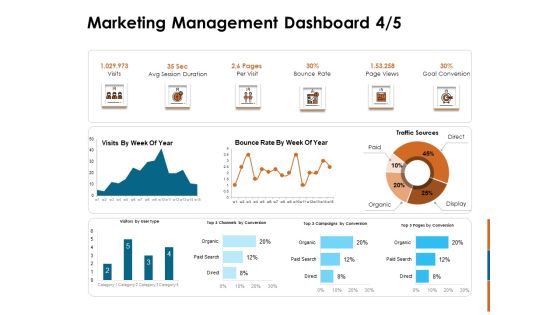
Key Statistics Of Marketing Marketing Management Dashboard Rate Ppt PowerPoint Presentation Show Graphics Template PDF
Deliver and pitch your topic in the best possible manner with this key statistics of marketing marketing management dashboard rate ppt powerpoint presentation show graphics template pdf. Use them to share invaluable insights on visits, avg session duration, per visit, bounce rate, page views, goal conversion and impress your audience. This template can be altered and modified as per your expectations. So, grab it now.
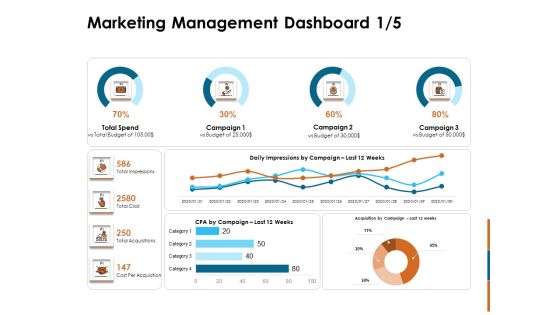
Key Statistics Of Marketing Marketing Management Dashboard Ppt PowerPoint Presentation Slides Templates PDF
Deliver and pitch your topic in the best possible manner with this key statistics of marketing marketing management dashboard ppt powerpoint presentation slides templates pdf. Use them to share invaluable insights on total impressions, total click, total acquisitions, cost per acquisition, total spend, acquisition campaign last 12 weeks and impress your audience. This template can be altered and modified as per your expectations. So, grab it now.

Dashboard Of India Country Profile Statistics Ppt Ideas Format Ideas PDF
Persuade your audience using this Dashboard Of India Country Profile Statistics Ppt Ideas Format Ideas PDF. This PPT design covers one stages, thus making it a great tool to use. It also caters to a variety of topics including Human Development Index, Global Ghg Emissions, GDP Per Capita. Download this PPT design now to present a convincing pitch that not only emphasizes the topic but also showcases your presentation skills.

Brazil Country Profile Statistics Dashboard With GDP Per Capita Mockup PDF
Persuade your audience using this Brazil Country Profile Statistics Dashboard With GDP Per Capita Mockup PDF. This PPT design covers one stages, thus making it a great tool to use. It also caters to a variety of topics including Global Ghg Emissions, Human Development Index, GDP Per Capita. Download this PPT design now to present a convincing pitch that not only emphasizes the topic but also showcases your presentation skills.

Market Research To Determine Business Opportunities Brand Analytics KPI Dashboard For Organization Inspiration PDF
The following slide outlines key performance indicator KPI dashboard that can assist marketers to evaluate brand performance on social media channels. The metrics covered are age group, gender, brand perception, branding themes, celebrity analysis, etc. There are so many reasons you need a Market Research To Determine Business Opportunities Brand Analytics KPI Dashboard For Organization Inspiration PDF. The first reason is you cannot spend time making everything from scratch, Thus, Slidegeeks has made presentation templates for you too. You can easily download these templates from our website easily.
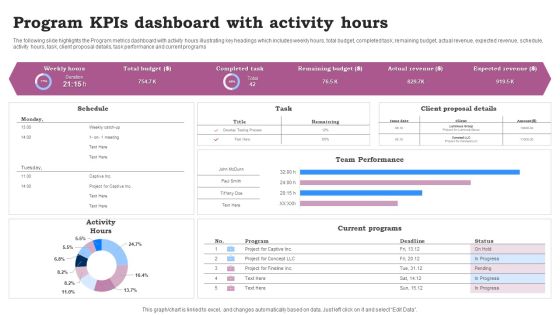
Program Kpis Dashboard With Activity Hours Ppt Infographics Clipart Images PDF
The following slide highlights the Program metrics dashboard with activity hours illustrating key headings which includes weekly hours, total budget, completed task, remaining budget, actual revenue, expected revenue, schedule, activity hours, task, client proposal details, task performance and current programs. Pitch your topic with ease and precision using this Program Kpis Dashboard With Activity Hours Ppt Infographics Clipart Images PDF. This layout presents information on Team Performance, Current Programs, Activity Hours. It is also available for immediate download and adjustment. So, changes can be made in the color, design, graphics or any other component to create a unique layout.

Creating New Product Launch Campaign Strategy Dashboard To Track Sales Opportunities Professional PDF
Mentioned slide shows dashboard that can be used by an organization to track win and lost sales opportunities. It includes metrics namely won opportunities, lost opportunities, pipeline by territory, total opportunities. Formulating a presentation can take up a lot of effort and time, so the content and message should always be the primary focus. The visuals of the PowerPoint can enhance the presenters message, so our Creating New Product Launch Campaign Strategy Dashboard To Track Sales Opportunities Professional PDF was created to help save time. Instead of worrying about the design, the presenter can concentrate on the message while our designers work on creating the ideal templates for whatever situation is needed. Slidegeeks has experts for everything from amazing designs to valuable content, we have put everything into Creating New Product Launch Campaign Strategy Dashboard To Track Sales Opportunities Professional PDF
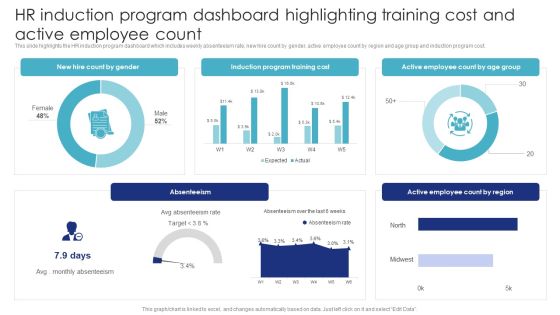
HR Induction Program Dashboard Highlighting Training Cost And Active Employee Count Brochure PDF
This slide highlights the HR induction program dashboard which includes weekly absenteeism rate, new hire count by gender, active employee count by region and age group and induction program cost. Formulating a presentation can take up a lot of effort and time, so the content and message should always be the primary focus. The visuals of the PowerPoint can enhance the presenters message, so our HR Induction Program Dashboard Highlighting Training Cost And Active Employee Count Brochure PDF was created to help save time. Instead of worrying about the design, the presenter can concentrate on the message while our designers work on creating the ideal templates for whatever situation is needed. Slidegeeks has experts for everything from amazing designs to valuable content, we have put everything into HR Induction Program Dashboard Highlighting Training Cost And Active Employee Count Brochure PDF.

Dashboard Depicting Social Media Tactical Plan To Enhance Social Media Hiring Process Download PDF
This slide depicts the dashboard showing metrics to measure social media recruitment status which covers sourcing status, bounce rate, filled positions, recruitment expenses, cost per hire, top referrers, etc.Here you can discover an assortment of the finest PowerPoint and Google Slides templates. With these templates, you can create presentations for a variety of purposes while simultaneously providing your audience with an eye-catching visual experience. Download Dashboard Depicting Social Media Tactical Plan To Enhance Social Media Hiring Process Download PDF to deliver an impeccable presentation. These templates will make your job of preparing presentations much quicker, yet still, maintain a high level of quality. Slidegeeks has experienced researchers who prepare these templates and write high-quality content for you. Later on, you can personalize the content by editing the Dashboard Depicting Social Media Tactical Plan To Enhance Social Media Hiring Process Download PDF.

Call Center Action Plan Dashboard Highlighting Agent Performance With Satisfaction Score Slides PDF
This slide showcases dashboard for call center action plan which includes total calls, average answer speed, abandon rate, average calls per minute with agent performance and overall customer satisfaction score. Here you can discover an assortment of the finest PowerPoint and Google Slides templates. With these templates, you can create presentations for a variety of purposes while simultaneously providing your audience with an eye catching visual experience. Download Call Center Action Plan Dashboard Highlighting Agent Performance With Satisfaction Score Slides PDF to deliver an impeccable presentation. These templates will make your job of preparing presentations much quicker, yet still, maintain a high level of quality. Slidegeeks has experienced researchers who prepare these templates and write high quality content for you. Later on, you can personalize the content by editing the Call Center Action Plan Dashboard Highlighting Agent Performance With Satisfaction Score Slides PDF.

Dashboard Showcasing Portfolio Investment Performance Strategies To Enhance Portfolio Management Summary PDF
This slide represents dashboard showcasing portfolio investment performance. It includes project progress, project manager, task completed etc.Formulating a presentation can take up a lot of effort and time, so the content and message should always be the primary focus. The visuals of the PowerPoint can enhance the presenters message, so our Dashboard Showcasing Portfolio Investment Performance Strategies To Enhance Portfolio Management Summary PDF was created to help save time. Instead of worrying about the design, the presenter can concentrate on the message while our designers work on creating the ideal templates for whatever situation is needed. Slidegeeks has experts for everything from amazing designs to valuable content, we have put everything into Dashboard Showcasing Portfolio Investment Performance Strategies To Enhance Portfolio Management Summary PDF.
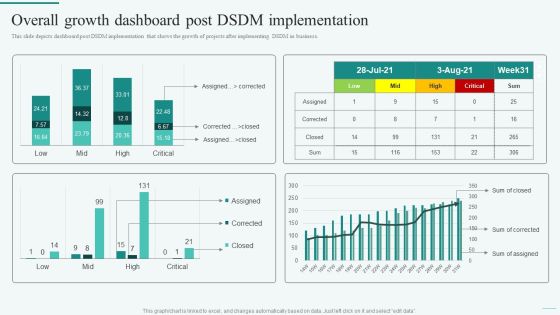
Overall Growth Dashboard Post DSDM Implementation Integration Of Dynamic System To Enhance Processes Designs PDF
This slide depicts dashboard post DSDM implementation that shows the growth of projects after implementing DSDM in business.Here you can discover an assortment of the finest PowerPoint and Google Slides templates. With these templates, you can create presentations for a variety of purposes while simultaneously providing your audience with an eye-catching visual experience. Download Overall Growth Dashboard Post DSDM Implementation Integration Of Dynamic System To Enhance Processes Designs PDF to deliver an impeccable presentation. These templates will make your job of preparing presentations much quicker, yet still, maintain a high level of quality. Slidegeeks has experienced researchers who prepare these templates and write high-quality content for you. Later on, you can personalize the content by editing the Overall Growth Dashboard Post DSDM Implementation Integration Of Dynamic System To Enhance Processes Designs PDF.

Strategic Management Dashboard With Strategy Assessment Tactics To Gain Sustainable Competitive Edge Pictures PDF
This slide showcases strategic management dashboard with technique assessment. It provides details about financial, customer, process, efficiency strategy, customer behavior, customer loyalty, customer feedbacks, marketing, suppliers, etc. Formulating a presentation can take up a lot of effort and time, so the content and message should always be the primary focus. The visuals of the PowerPoint can enhance the presenters message, so our Strategic Management Dashboard With Strategy Assessment Tactics To Gain Sustainable Competitive Edge Pictures PDF was created to help save time. Instead of worrying about the design, the presenter can concentrate on the message while our designers work on creating the ideal templates for whatever situation is needed. Slidegeeks has experts for everything from amazing designs to valuable content, we have put everything into Strategic Management Dashboard With Strategy Assessment Tactics To Gain Sustainable Competitive Edge Pictures PDF.

Dashboard For Dual Branding Campaign Performance Dual Branding Marketing Campaign Diagrams PDF
This slide showcases dashboard that can help organization to measure performance after launching dual branding campaign. Its key components are sales comparison, revenue by client, revenue by source and new customers by source. Here you can discover an assortment of the finest PowerPoint and Google Slides templates. With these templates, you can create presentations for a variety of purposes while simultaneously providing your audience with an eye-catching visual experience. Download Dashboard For Dual Branding Campaign Performance Dual Branding Marketing Campaign Diagrams PDF to deliver an impeccable presentation. These templates will make your job of preparing presentations much quicker, yet still, maintain a high level of quality. Slidegeeks has experienced researchers who prepare these templates and write high-quality content for you. Later on, you can personalize the content by editing the Dashboard For Dual Branding Campaign Performance Dual Branding Marketing Campaign Diagrams PDF.

Strategic FM Services Facilities Management Dashboard With Repair Services And Work Orders Infographics PDF
This slide highlights dashboard for facilities management services which includes tasks by work order type, task by status, lobs logged, repair services and priority work orders. Formulating a presentation can take up a lot of effort and time, so the content and message should always be the primary focus. The visuals of the PowerPoint can enhance the presenters message, so our Strategic FM Services Facilities Management Dashboard With Repair Services And Work Orders Infographics PDF was created to help save time. Instead of worrying about the design, the presenter can concentrate on the message while our designers work on creating the ideal templates for whatever situation is needed. Slidegeeks has experts for everything from amazing designs to valuable content, we have put everything into Strategic FM Services Facilities Management Dashboard With Repair Services And Work Orders Infographics PDF.
New Staff Onboarding Program HR Induction Dashboard Highlighting Employee Headcount And Turnover Ratio Icons PDF
This slide highlights the HR induction dashboard which includes average salary, headcount, turnover rate, employees hired and employees left rate, average age with employment contract and status. Formulating a presentation can take up a lot of effort and time, so the content and message should always be the primary focus. The visuals of the PowerPoint can enhance the presenters message, so our New Staff Onboarding Program HR Induction Dashboard Highlighting Employee Headcount And Turnover Ratio Icons PDF was created to help save time. Instead of worrying about the design, the presenter can concentrate on the message while our designers work on creating the ideal templates for whatever situation is needed. Slidegeeks has experts for everything from amazing designs to valuable content, we have put everything into New Staff Onboarding Program HR Induction Dashboard Highlighting Employee Headcount And Turnover Ratio Icons PDF.
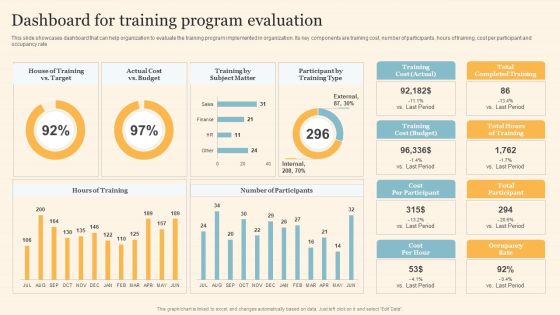
Staff On Job Coaching Program For Skills Enhancement Dashboard For Training Program Evaluation Structure PDF
This slide showcases dashboard that can help organization to evaluate the training program implemented in organization. Its key components are training cost, number of participants, hours of training, cost per participant and occupancy rate. Here you can discover an assortment of the finest PowerPoint and Google Slides templates. With these templates, you can create presentations for a variety of purposes while simultaneously providing your audience with an eye catching visual experience. Download Staff On Job Coaching Program For Skills Enhancement Dashboard For Training Program Evaluation Structure PDF to deliver an impeccable presentation. These templates will make your job of preparing presentations much quicker, yet still, maintain a high level of quality. Slidegeeks has experienced researchers who prepare these templates and write high quality content for you. Later on, you can personalize the content by editing the Staff On Job Coaching Program For Skills Enhancement Dashboard For Training Program Evaluation Structure PDF.

BPR To Develop Operational Effectiveness Dashboard To Determine Sales Profit And Conversions Slides PDF
This slide focuses on dashboard to determine sales profits and conversions that also includes revenues, profits, number of orders placed, total customers, procured items that will help company to measure the overall business performance. Formulating a presentation can take up a lot of effort and time, so the content and message should always be the primary focus. The visuals of the PowerPoint can enhance the presenters message, so our BPR To Develop Operational Effectiveness Dashboard To Determine Sales Profit And Conversions Slides PDF was created to help save time. Instead of worrying about the design, the presenter can concentrate on the message while our designers work on creating the ideal templates for whatever situation is needed. Slidegeeks has experts for everything from amazing designs to valuable content, we have put everything into BPR To Develop Operational Effectiveness Dashboard To Determine Sales Profit And Conversions Slides PDF.

BPM System Methodology Dashboard To Track Client Onboarding Operations Sample PDF
This slide covers dashboard to track customer onboarding report of a company. The purpose of this slide is to provide employee wise report of signing up customers. It includes elements such as list of customers awaiting onboarding, paying customers along with package details and other important analytics. Formulating a presentation can take up a lot of effort and time, so the content and message should always be the primary focus. The visuals of the PowerPoint can enhance the presenters message, so our BPM System Methodology Dashboard To Track Client Onboarding Operations Sample PDF was created to help save time. Instead of worrying about the design, the presenter can concentrate on the message while our designers work on creating the ideal templates for whatever situation is needed. Slidegeeks has experts for everything from amazing designs to valuable content, we have put everything into BPM System Methodology Dashboard To Track Client Onboarding Operations Sample PDF

Employee Health And Safety Workplace Safety Dashboard Highlighting Injury Severity And Costs Sample PDF
This slide highlights the dashboard which showcase the critical incidents, incident cost, injury consequence, type of incident and severity level of the injury. Formulating a presentation can take up a lot of effort and time, so the content and message should always be the primary focus. The visuals of the PowerPoint can enhance the presenters message, so our Employee Health And Safety Workplace Safety Dashboard Highlighting Injury Severity And Costs Sample PDF was created to help save time. Instead of worrying about the design, the presenter can concentrate on the message while our designers work on creating the ideal templates for whatever situation is needed. Slidegeeks has experts for everything from amazing designs to valuable content, we have put everything into Employee Health And Safety Workplace Safety Dashboard Highlighting Injury Severity And Costs Sample PDF.
Naas Architectural Framework Network As A Service Performance Tracking Dashboard Icons PDF
This slide represents the performance tracking dashboard for Naas, covering service availability, inventory details, software compliance status, service level agreement, alert notifications, number of changes and incidents. Here you can discover an assortment of the finest PowerPoint and Google Slides templates. With these templates, you can create presentations for a variety of purposes while simultaneously providing your audience with an eye-catching visual experience. Download Naas Architectural Framework Network As A Service Performance Tracking Dashboard Icons PDF to deliver an impeccable presentation. These templates will make your job of preparing presentations much quicker, yet still, maintain a high level of quality. Slidegeeks has experienced researchers who prepare these templates and write high-quality content for you. Later on, you can personalize the content by editing the Naas Architectural Framework Network As A Service Performance Tracking Dashboard Icons PDF.
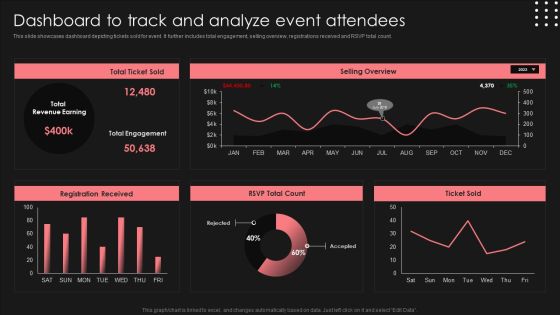
Positive Impact Of Effective Dashboard To Track And Analyze Event Attendees Elements PDF
This slide showcases dashboard depicting tickets sold for event. It further includes total engagement, selling overview, registrations received and RSVP total count. Formulating a presentation can take up a lot of effort and time, so the content and message should always be the primary focus. The visuals of the PowerPoint can enhance the presenters message, so our Positive Impact Of Effective Dashboard To Track And Analyze Event Attendees Elements PDF was created to help save time. Instead of worrying about the design, the presenter can concentrate on the message while our designers work on creating the ideal templates for whatever situation is needed. Slidegeeks has experts for everything from amazing designs to valuable content, we have put everything intoPositive Impact Of Effective Dashboard To Track And Analyze Event Attendees Elements PDF.

Crystal Methods In Agile Framework Crystal Methodology Implementation Dashboard Introduction PDF
This slide represents the crystal methodology implementation dashboard by covering annual gross revenue, product type comparison, sales rep comparison and top 10 clients. Here you can discover an assortment of the finest PowerPoint and Google Slides templates. With these templates, you can create presentations for a variety of purposes while simultaneously providing your audience with an eye catching visual experience. Download Crystal Methods In Agile Framework Crystal Methodology Implementation Dashboard Introduction PDF to deliver an impeccable presentation. These templates will make your job of preparing presentations much quicker, yet still, maintain a high level of quality. Slidegeeks has experienced researchers who prepare these templates and write high quality content for you. Later on, you can personalize the content by editing the Crystal Methods In Agile Framework Crystal Methodology Implementation Dashboard Introduction PDF.
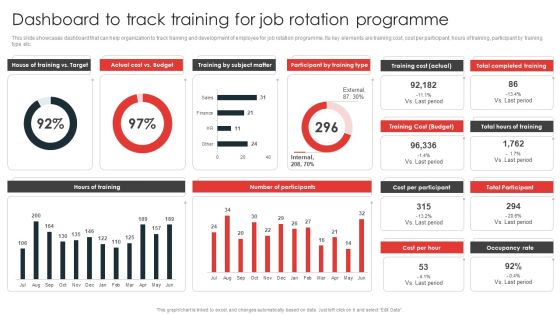
Job Rotation Plan For Staff Dashboard To Track Training For Job Rotation Programme Inspiration PDF
This slide showcases dashboard that can help organization to track training and development of employee for job rotation programme. Its key elements are training cost, cost per participant, hours of training, participant by training type etc. Here you can discover an assortment of the finest PowerPoint and Google Slides templates. With these templates, you can create presentations for a variety of purposes while simultaneously providing your audience with an eye-catching visual experience. Download Job Rotation Plan For Staff Dashboard To Track Training For Job Rotation Programme Inspiration PDF to deliver an impeccable presentation. These templates will make your job of preparing presentations much quicker, yet still, maintain a high level of quality. Slidegeeks has experienced researchers who prepare these templates and write high-quality content for you. Later on, you can personalize the content by editing the Job Rotation Plan For Staff Dashboard To Track Training For Job Rotation Programme Inspiration PDF.

Porters Strategies For Targeted Client Segment Dashboard To Track Website And Application Traffic Brochure PDF
This slide showcases dashboard that can help organization to evaluate the traffic of website and application after entering into niche market. Its key elements are users, conversions, conversion by event type and engagement rate. Here you can discover an assortment of the finest PowerPoint and Google Slides templates. With these templates, you can create presentations for a variety of purposes while simultaneously providing your audience with an eye catching visual experience. Download Porters Strategies For Targeted Client Segment Dashboard To Track Website And Application Traffic Brochure PDF to deliver an impeccable presentation. These templates will make your job of preparing presentations much quicker, yet still, maintain a high level of quality. Slidegeeks has experienced researchers who prepare these templates and write high quality content for you. Later on, you can personalize the content by editing the Porters Strategies For Targeted Client Segment Dashboard To Track Website And Application Traffic Brochure PDF.
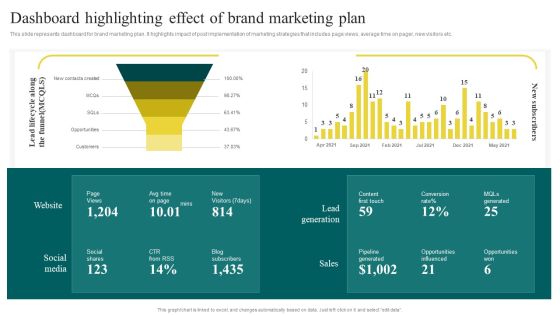
Yearly Brand Promotion Plan Dashboard Highlighting Effect Of Brand Marketing Plan Pictures PDF
This slide represents dashboard for brand marketing plan. It highlights impact of post implementation of marketing strategies that includes page views, average time on pager, new visitors etc. Formulating a presentation can take up a lot of effort and time, so the content and message should always be the primary focus. The visuals of the PowerPoint can enhance the presenters message, so our Yearly Brand Promotion Plan Dashboard Highlighting Effect Of Brand Marketing Plan Pictures PDF was created to help save time. Instead of worrying about the design, the presenter can concentrate on the message while our designers work on creating the ideal templates for whatever situation is needed. Slidegeeks has experts for everything from amazing designs to valuable content, we have put everything into Yearly Brand Promotion Plan Dashboard Highlighting Effect Of Brand Marketing Plan Pictures PDF.
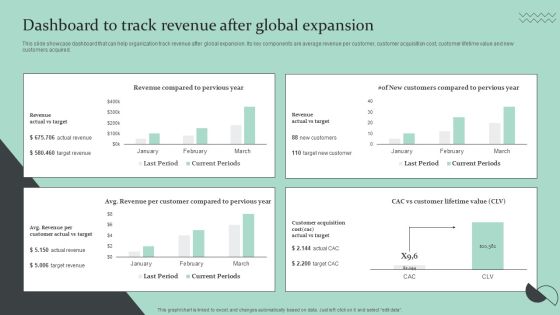
Strategic Global Expansion Business Plan Dashboard To Track Revenue After Global Expansion Topics PDF
This slide showcase dashboard that can help organization track revenue after global expansion. Its key components are average revenue per customer, customer acquisition cost, customer lifetime value and new customers acquired. Here you can discover an assortment of the finest PowerPoint and Google Slides templates. With these templates, you can create presentations for a variety of purposes while simultaneously providing your audience with an eye catching visual experience. Download Strategic Global Expansion Business Plan Dashboard To Track Revenue After Global Expansion Topics PDF to deliver an impeccable presentation. These templates will make your job of preparing presentations much quicker, yet still, maintain a high level of quality. Slidegeeks has experienced researchers who prepare these templates and write high quality content for you. Later on, you can personalize the content by editing the Strategic Global Expansion Business Plan Dashboard To Track Revenue After Global Expansion Topics PDF.

Revolutionizing Customer Support Through Digital Transformation Customer Service Dashboard Slides PDF
This slide represents customer service dashboard showcasing user experience. It includes request volume, revenue, customer satisfaction, customer retention etc. Here you can discover an assortment of the finest PowerPoint and Google Slides templates. With these templates, you can create presentations for a variety of purposes while simultaneously providing your audience with an eye catching visual experience. Download Revolutionizing Customer Support Through Digital Transformation Customer Service Dashboard Slides PDF to deliver an impeccable presentation. These templates will make your job of preparing presentations much quicker, yet still, maintain a high level of quality. Slidegeeks has experienced researchers who prepare these templates and write high quality content for you. Later on, you can personalize the content by editing the Revolutionizing Customer Support Through Digital Transformation Customer Service Dashboard Slides PDF.

Customer Segmentation Dashboard To Monitor Results Ppt PowerPoint Presentation File Deck PDF
The following slide showcases a dashboard to monitor customer segmentation based on similar traits and characteristics. It highlights elements such as total customer in each segments, segments description, segment characteristics and search customer by ID. Formulating a presentation can take up a lot of effort and time, so the content and message should always be the primary focus. The visuals of the PowerPoint can enhance the presenters message, so our Customer Segmentation Dashboard To Monitor Results Ppt PowerPoint Presentation File Deck PDF was created to help save time. Instead of worrying about the design, the presenter can concentrate on the message while our designers work on creating the ideal templates for whatever situation is needed. Slidegeeks has experts for everything from amazing designs to valuable content, we have put everything into Customer Segmentation Dashboard To Monitor Results Ppt PowerPoint Presentation File Deck PDF.

Consumer Lead Generation Process Lead Generation Dashboard For Tracking Conversion Rates Mockup PDF
This slide covers the KPI dashboard for tracking lead conversion rates. It includes metrics such as visitors, average session rate, per visit, bounce rate, page views, etc. Here you can discover an assortment of the finest PowerPoint and Google Slides templates. With these templates, you can create presentations for a variety of purposes while simultaneously providing your audience with an eye-catching visual experience. Download Consumer Lead Generation Process Lead Generation Dashboard For Tracking Conversion Rates Mockup PDF to deliver an impeccable presentation. These templates will make your job of preparing presentations much quicker, yet still, maintain a high level of quality. Slidegeeks has experienced researchers who prepare these templates and write high-quality content for you. Later on, you can personalize the content by editing the Consumer Lead Generation Process Lead Generation Dashboard For Tracking Conversion Rates Mockup PDF.
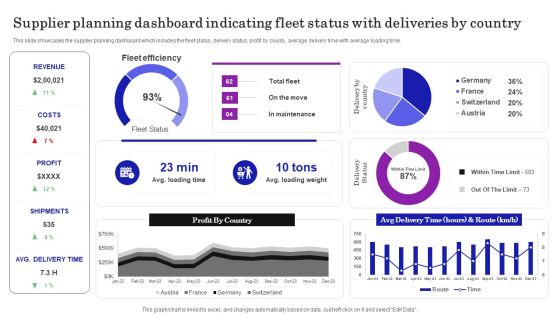
Supplier Planning Dashboard Indicating Fleet Status With Deliveries By Country Ideas PDF
This slide showcases the supplier planning dashboard which includes the fleet status, delivery status, profit by county, average delivery time with average loading time. Here you can discover an assortment of the finest PowerPoint and Google Slides templates. With these templates, you can create presentations for a variety of purposes while simultaneously providing your audience with an eye catching visual experience. Download Supplier Planning Dashboard Indicating Fleet Status With Deliveries By Country Ideas PDF to deliver an impeccable presentation. These templates will make your job of preparing presentations much quicker, yet still, maintain a high level of quality. Slidegeeks has experienced researchers who prepare these templates and write high quality content for you. Later on, you can personalize the content by editing the Supplier Planning Dashboard Indicating Fleet Status With Deliveries By Country Ideas PDF.
Marketing Success Metrics KPI Dashboard For Tracking Paid Ad Campaign Microsoft PDF
This slide covers the dashboard for analysing paid search metrics such as ad cost, clicks, impressions, click-through rate, cost per conversion, conversion rate, cost per click, etc. Here you can discover an assortment of the finest PowerPoint and Google Slides templates. With these templates, you can create presentations for a variety of purposes while simultaneously providing your audience with an eye-catching visual experience. Download Marketing Success Metrics KPI Dashboard For Tracking Paid Ad Campaign Microsoft PDF to deliver an impeccable presentation. These templates will make your job of preparing presentations much quicker, yet still, maintain a high level of quality. Slidegeeks has experienced researchers who prepare these templates and write high-quality content for you. Later on, you can personalize the content by editing the Marketing Success Metrics KPI Dashboard For Tracking Paid Ad Campaign Microsoft PDF.
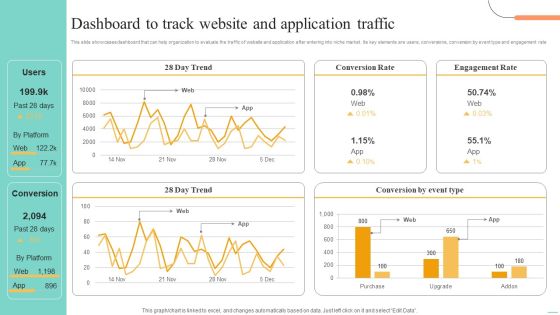
Price Leadership Technique Dashboard To Track Website And Application Traffic Themes PDF
This slide showcases dashboard that can help organization to evaluate the traffic of website and application after entering into niche market. Its key elements are users, conversions, conversion by event type and engagement rate. Here you can discover an assortment of the finest PowerPoint and Google Slides templates. With these templates, you can create presentations for a variety of purposes while simultaneously providing your audience with an eye catching visual experience. Download Price Leadership Technique Dashboard To Track Website And Application Traffic Themes PDF to deliver an impeccable presentation. These templates will make your job of preparing presentations much quicker, yet still, maintain a high level of quality. Slidegeeks has experienced researchers who prepare these templates and write high quality content for you. Later on, you can personalize the content by editing the Price Leadership Technique Dashboard To Track Website And Application Traffic Themes PDF.
IT Alignment For Strategic Dashboard For Tracking Business And IT Alignment Professional PDF
This slide depicts the dashboard for business and IT alignment by covering details of total sales, customer support service, percentage of business operations aligned IT, usage of communication channels, and top performer associates. Formulating a presentation can take up a lot of effort and time, so the content and message should always be the primary focus. The visuals of the PowerPoint can enhance the presenters message, so our IT Alignment For Strategic Dashboard For Tracking Business And IT Alignment Professional PDF was created to help save time. Instead of worrying about the design, the presenter can concentrate on the message while our designers work on creating the ideal templates for whatever situation is needed. Slidegeeks has experts for everything from amazing designs to valuable content, we have put everything into IT Alignment For Strategic Dashboard For Tracking Business And IT Alignment Professional PDF.

Banking Operation Strategy Dashboard Highlighting Deposits And Growth Rate Structure PDF
This slide highlights the banking operation strategy dashboard which showcases current account and saving account growth rate, savings account deposits, current account deposits and retail term deposits. Here you can discover an assortment of the finest PowerPoint and Google Slides templates. With these templates, you can create presentations for a variety of purposes while simultaneously providing your audience with an eye catching visual experience. Download Banking Operation Strategy Dashboard Highlighting Deposits And Growth Rate Structure PDF to deliver an impeccable presentation. These templates will make your job of preparing presentations much quicker, yet still, maintain a high level of quality. Slidegeeks has experienced researchers who prepare these templates and write high quality content for you. Later on, you can personalize the content by editing the Banking Operation Strategy Dashboard Highlighting Deposits And Growth Rate Structure PDF.
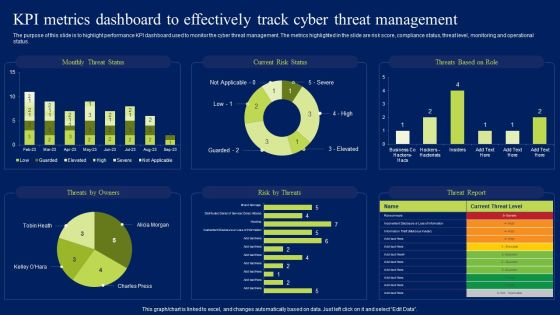
Kpi Metrics Dashboard To Effectively Track Cyber Threat Management Ppt Styles Guide PDF
The purpose of this slide is to highlight performance KPI dashboard used to monitor the cyber threat management. The metrics highlighted in the slide are risk score, compliance status, threat level, monitoring and operational status. Formulating a presentation can take up a lot of effort and time, so the content and message should always be the primary focus. The visuals of the PowerPoint can enhance the presenters message, so our Kpi Metrics Dashboard To Effectively Track Cyber Threat Management Ppt Styles Guide PDF was created to help save time. Instead of worrying about the design, the presenter can concentrate on the message while our designers work on creating the ideal templates for whatever situation is needed. Slidegeeks has experts for everything from amazing designs to valuable content, we have put everything into Kpi Metrics Dashboard To Effectively Track Cyber Threat Management Ppt Styles Guide PDF.
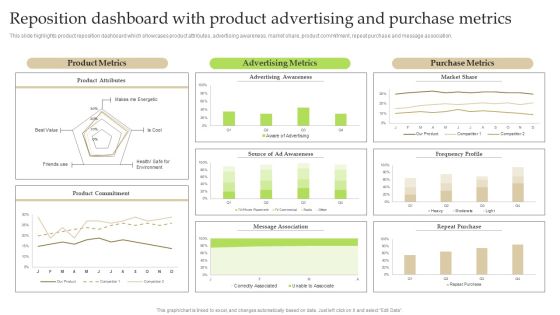
Reposition Dashboard With Product Advertising And Purchase Metrics Ppt PowerPoint Presentation File Show PDF
This slide highlights product reposition dashboard which showcases product attributes, advertising awareness, market share, product commitment, repeat purchase and message association. Formulating a presentation can take up a lot of effort and time, so the content and message should always be the primary focus. The visuals of the PowerPoint can enhance the presenters message, so our Reposition Dashboard With Product Advertising And Purchase Metrics Ppt PowerPoint Presentation File Show PDF was created to help save time. Instead of worrying about the design, the presenter can concentrate on the message while our designers work on creating the ideal templates for whatever situation is needed. Slidegeeks has experts for everything from amazing designs to valuable content, we have put everything into Reposition Dashboard With Product Advertising And Purchase Metrics Ppt PowerPoint Presentation File Show PDF

Deployment Of Process Automation To Increase Organisational Performance Dashboard For Monthly Graphics PDF
This slide presents a dashboard for monthly procurement activities in an organization. It includes number of suppliers, contract attainted, supplier share, top supplier report, average procurement cycle time, etc. Here you can discover an assortment of the finest PowerPoint and Google Slides templates. With these templates, you can create presentations for a variety of purposes while simultaneously providing your audience with an eye catching visual experience. Download Deployment Of Process Automation To Increase Organisational Performance Dashboard For Monthly Graphics PDF to deliver an impeccable presentation. These templates will make your job of preparing presentations much quicker, yet still, maintain a high level of quality. Slidegeeks has experienced researchers who prepare these templates and write high quality content for you. Later on, you can personalize the content by editing the Deployment Of Process Automation To Increase Organisational Performance Dashboard For Monthly Graphics PDF.
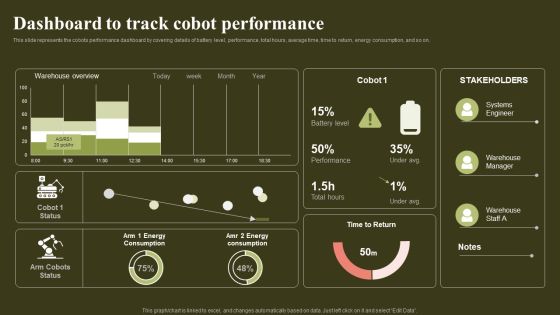
Revolutionizing Human Machine Collaboration Cobots Dashboard To Track Cobot Performance Clipart PDF
This slide represents the cobots performance dashboard by covering details of battery level, performance, total hours, average time, time to return, energy consumption, and so on. Here you can discover an assortment of the finest PowerPoint and Google Slides templates. With these templates, you can create presentations for a variety of purposes while simultaneously providing your audience with an eye catching visual experience. Download Revolutionizing Human Machine Collaboration Cobots Dashboard To Track Cobot Performance Clipart PDF to deliver an impeccable presentation. These templates will make your job of preparing presentations much quicker, yet still, maintain a high level of quality. Slidegeeks has experienced researchers who prepare these templates and write high quality content for you. Later on, you can personalize the content by editing the Revolutionizing Human Machine Collaboration Cobots Dashboard To Track Cobot Performance Clipart PDF.

Lean Manufacturing Dashboard Showcasing Production Progress Ppt PowerPoint Presentation File Model PDF
This slide represents lean manufacturing dashboard showcasing production progress. It covers production volume, order volume, downtime, returned item etc. Formulating a presentation can take up a lot of effort and time, so the content and message should always be the primary focus. The visuals of the PowerPoint can enhance the presenters message, so our Lean Manufacturing Dashboard Showcasing Production Progress Ppt PowerPoint Presentation File Model PDF was created to help save time. Instead of worrying about the design, the presenter can concentrate on the message while our designers work on creating the ideal templates for whatever situation is needed. Slidegeeks has experts for everything from amazing designs to valuable content, we have put everything into Lean Manufacturing Dashboard Showcasing Production Progress Ppt PowerPoint Presentation File Model PDF

Brand Positioning And Launch Plan For Emerging Markets Dashboard To Track Traffic Guidelines PDF
This slide showcases dashboard that can help organization to analyze and evaluate the website traffic after new brand launch. Its key elements are unique page views, average time on page, channel sessions, page views, bounce rate etc. Here you can discover an assortment of the finest PowerPoint and Google Slides templates. With these templates, you can create presentations for a variety of purposes while simultaneously providing your audience with an eye catching visual experience. Download Brand Positioning And Launch Plan For Emerging Markets Dashboard To Track Traffic Guidelines PDF to deliver an impeccable presentation. These templates will make your job of preparing presentations much quicker, yet still, maintain a high level of quality. Slidegeeks has experienced researchers who prepare these templates and write high quality content for you. Later on, you can personalize the content by editing the Brand Positioning And Launch Plan For Emerging Markets Dashboard To Track Traffic Guidelines PDF.
Influencers Marketing Campaign Performance Tracking Dashboard Ppt PowerPoint Presentation Diagram Lists PDF
This slide covers performance monitoring dashboard of influencer based referral marketing program. It includes elements such as impressions on Instagram, likes, comments, clicks, sales generated along with value calculators and campaign breakdown based on gender and age. Formulating a presentation can take up a lot of effort and time, so the content and message should always be the primary focus. The visuals of the PowerPoint can enhance the presenters message, so our Influencers Marketing Campaign Performance Tracking Dashboard Ppt PowerPoint Presentation Diagram Lists PDF was created to help save time. Instead of worrying about the design, the presenter can concentrate on the message while our designers work on creating the ideal templates for whatever situation is needed. Slidegeeks has experts for everything from amazing designs to valuable content, we have put everything into Influencers Marketing Campaign Performance Tracking Dashboard Ppt PowerPoint Presentation Diagram Lists PDF

Deploying B2B Advertising Techniques For Lead Generation Email Marketing Kpi Dashboard To Monitor Progress Designs PDF
This slide covers email marketing KPI dashboard to monitor progress from email campaign. It involves details such as monthly growth of email list, list performance and daily web performance. Formulating a presentation can take up a lot of effort and time, so the content and message should always be the primary focus. The visuals of the PowerPoint can enhance the presenters message, so our Deploying B2B Advertising Techniques For Lead Generation Email Marketing Kpi Dashboard To Monitor Progress Designs PDF was created to help save time. Instead of worrying about the design, the presenter can concentrate on the message while our designers work on creating the ideal templates for whatever situation is needed. Slidegeeks has experts for everything from amazing designs to valuable content, we have put everything into Deploying B2B Advertising Techniques For Lead Generation Email Marketing Kpi Dashboard To Monitor Progress Designs PDF

Dashboard To Track Website Visitors On Brand Landing Pages Graphics PDF
This slide showcases dashboard that can help organization to track the visitors on landing pages of different brands. Its key elements are forecast purchasers, customer acquisition cost and visitors count by landing pages. Here you can discover an assortment of the finest PowerPoint and Google Slides templates. With these templates, you can create presentations for a variety of purposes while simultaneously providing your audience with an eye catching visual experience. Download Dashboard To Track Website Visitors On Brand Landing Pages Graphics PDF to deliver an impeccable presentation. These templates will make your job of preparing presentations much quicker, yet still, maintain a high level of quality. Slidegeeks has experienced researchers who prepare these templates and write high quality content for you. Later on, you can personalize the content by editing the Dashboard To Track Website Visitors On Brand Landing Pages Graphics PDF.

Integrating Cobots To Improve Business Processes Dashboard To Track Cobot Performance Introduction PDF
This slide represents the cobots performance dashboard by covering details of battery level, performance, total hours, average time, time to return, energy consumption, and so on. Here you can discover an assortment of the finest PowerPoint and Google Slides templates. With these templates, you can create presentations for a variety of purposes while simultaneously providing your audience with an eye catching visual experience. Download Integrating Cobots To Improve Business Processes Dashboard To Track Cobot Performance Introduction PDF to deliver an impeccable presentation. These templates will make your job of preparing presentations much quicker, yet still, maintain a high level of quality. Slidegeeks has experienced researchers who prepare these templates and write high quality content for you. Later on, you can personalize the content by editing the Integrating Cobots To Improve Business Processes Dashboard To Track Cobot Performance Introduction PDF.

Dashboard To Monitor CPA Marketing Campaign Performance Ppt Slides Examples PDF
This slide showcases the dashboard to track and monitor performance of CPA marketing campaign. It incorporates metrics such as link clicks, CTR, marketing cost, overall CPA cost, website conversion rate, overall conversion rate, advertising sources, etc. Here you can discover an assortment of the finest PowerPoint and Google Slides templates. With these templates, you can create presentations for a variety of purposes while simultaneously providing your audience with an eye catching visual experience. Download Dashboard To Monitor CPA Marketing Campaign Performance Ppt Slides Examples PDF to deliver an impeccable presentation. These templates will make your job of preparing presentations much quicker, yet still, maintain a high level of quality. Slidegeeks has experienced researchers who prepare these templates and write high quality content for you. Later on, you can personalize the content by editing the Dashboard To Monitor CPA Marketing Campaign Performance Ppt Slides Examples PDF.

Marketing Mix Strategy Handbook Ad Word Marketing Campaign Management Dashboard Structure PDF
This slide showcases a dashboard for managing ad word campaign to assists marketers in optimizing their ads and PPC performance. It highlights element such as sessions, users, page view per sessions, average time on page, conversions, date period, goals completion and top acquisition channels. Here you can discover an assortment of the finest PowerPoint and Google Slides templates. With these templates, you can create presentations for a variety of purposes while simultaneously providing your audience with an eye-catching visual experience. Download Marketing Mix Strategy Handbook Ad Word Marketing Campaign Management Dashboard Structure PDF to deliver an impeccable presentation. These templates will make your job of preparing presentations much quicker, yet still, maintain a high level of quality. Slidegeeks has experienced researchers who prepare these templates and write high-quality content for you. Later on, you can personalize the content by editing the Marketing Mix Strategy Handbook Ad Word Marketing Campaign Management Dashboard Structure PDF.
Fitness Product Promotion Campaigns Sports Team And Brand Engagement Tracking Dashboard Designs PDF
This slide showcases sports team and brand engagement tracking dashboard. It provides details about owned channels, operated channels, images, videos, hashtags, image content, video content, etc. Do you have to make sure that everyone on your team knows about any specific topic I yes, then you should give Fitness Product Promotion Campaigns Sports Team And Brand Engagement Tracking Dashboard Designs PDF a try. Our experts have put a lot of knowledge and effort into creating this impeccable Fitness Product Promotion Campaigns Sports Team And Brand Engagement Tracking Dashboard Designs PDF. You can use this template for your upcoming presentations, as the slides are perfect to represent even the tiniest detail. You can download these templates from the Slidegeeks website and these are easy to edit. So grab these today

Application Of Artificial Intelligence AI Driven Dashboard With Website Kpis Formats PDF
This slide shows AI driven dashboard with website KPIs. It provides information such as total visits, traffic sources, geography, bounce rate, monthly visits, average visit time, etc. Showcasing this set of slides titled Application Of Artificial Intelligence AI Driven Dashboard With Website Kpis Formats PDF. The topics addressed in these templates are Bounce Rate, Monthly Visits, Traffic Sources. All the content presented in this PPT design is completely editable. Download it and make adjustments in color, background, font etc. as per your unique business setting.

Organizational Health And Safety Measurement Dashboard With Key Kpis Microsoft PDF
This slide shows the dashboard representing information related to measurement of safety and health performance of an organization. It includes details related to incidents and injuries etc. Showcasing this set of slides titled Organizational Health And Safety Measurement Dashboard With Key Kpis Microsoft PDF. The topics addressed in these templates are Hazard This Year, Injuries By Activity, Task This Year. All the content presented in this PPT design is completely editable. Download it and make adjustments in color, background, font etc. as per your unique business setting.
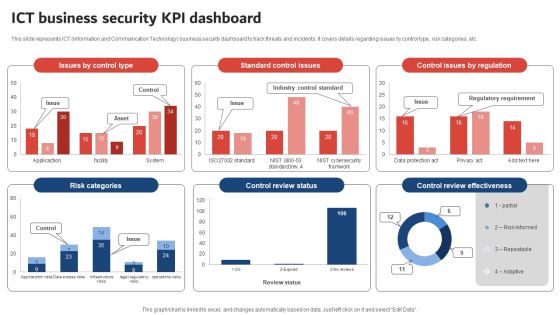
Execution Of ICT Strategic Plan ICT Business Security KPI Dashboard Designs PDF
This slide represents ICT Information and Communication Technology business security dashboard to track threats and incidents. It covers details regarding issues by control type, risk categories, etc. Boost your pitch with our creative Execution Of ICT Strategic Plan ICT Business Security KPI Dashboard Designs PDF. Deliver an awe inspiring pitch that will mesmerize everyone. Using these presentation templates you will surely catch everyones attention. You can browse the ppts collection on our website. We have researchers who are experts at creating the right content for the templates. So you do not have to invest time in any additional work. Just grab the template now and use them.

Comprehensive Market Research Guide Brand Analytics Kpi Dashboard For Organization Brochure PDF
The following slide outlines key performance indicator KPI dashboard that can assist marketers to evaluate brand performance on social media channels. The metrics covered are age group, gender, brand perception, branding themes, celebrity analysis, etc. From laying roadmaps to briefing everything in detail, our templates are perfect for you. You can set the stage with your presentation slides. All you have to do is download these easy-to-edit and customizable templates. Comprehensive Market Research Guide Brand Analytics Kpi Dashboard For Organization Brochure PDF will help you deliver an outstanding performance that everyone would remember and praise you for. Do download this presentation today.

Brand Analytics KPI Dashboard For Organization Ppt PowerPoint Presentation Diagram PDF
The following slide outlines key performance indicator KPI dashboard that can assist marketers to evaluate brand performance on social media channels. The metrics covered are age group, gender, brand perception, branding themes, celebrity analysis, etc. Take your projects to the next level with our ultimate collection of Brand Analytics KPI Dashboard For Organization Ppt PowerPoint Presentation Diagram PDF. Slidegeeks has designed a range of layouts that are perfect for representing task or activity duration, keeping track of all your deadlines at a glance. Tailor these designs to your exact needs and give them a truly corporate look with your own brand colors they will make your projects stand out from the rest.

Dashboard Of Effective Customer Service Mediums For Small Business Guidelines PDF
The following slide showcases dashboard for effective customer service channels as it provides essential information that lead to influence customer sentiments. It presents information related to traffic analysis, happiness ratings, etc. Showcasing this set of slides titled Dashboard Of Effective Customer Service Mediums For Small Business Guidelines PDF. The topics addressed in these templates are Average Tickets, Effective Customer, Small Business. All the content presented in this PPT design is completely editable. Download it and make adjustments in color, background, font etc. as per your unique business setting.

Dashboard To Analyze Performance Of Google Adwords Strategic Campaign Inspiration PDF
This slide displays dashboard for real time tracking and monitoring of marketing KPIs to review campaign performance. It includes elements such as spend, conversions, clicks, impressions, CTR, etc. Pitch your topic with ease and precision using this Dashboard To Analyze Performance Of Google Adwords Strategic Campaign Inspiration PDF. This layout presents information on Spend, Conversions, Cost Benefit Analysis . It is also available for immediate download and adjustment. So, changes can be made in the color, design, graphics or any other component to create a unique layout.

IT Security Risk Management Dashboard With Risk Rating And Breakdown Pictures PDF
This slide displays dashboard for real- time tracking and management of cybersecurity risk to help company formulate appropriate mitigation strategies. It includes kpis such as response plan progress, heat map, action plan, top 5 vulnerabilities, etc. Pitch your topic with ease and precision using this IT Security Risk Management Dashboard With Risk Rating And Breakdown Pictures PDF. This layout presents information on Risk Rating Breakdown, Action Plan Breakdown, Risk Probability Score, Risk Analysis Progress. It is also available for immediate download and adjustment. So, changes can be made in the color, design, graphics or any other component to create a unique layout.

Customer Success KPIS Overview Dashboard For Technical Support Team Ppt PowerPoint Presentation Gallery Layouts PDF
This slide covers dashboard with parameters to monitor performance for customer success programs. It includes percentage of customers helped, team report metrics, new customers, MRR, revenue churn, cancellation and refunds. Showcasing this set of slides titled Customer Success KPIS Overview Dashboard For Technical Support Team Ppt PowerPoint Presentation Gallery Layouts PDF. The topics addressed in these templates are Customer, Cancelations, New Customer, Revenue Churn. All the content presented in this PPT design is completely editable. Download it and make adjustments in color, background, font etc. as per your unique business setting.

Dashboard Indicating Status Of Change Requests For Effective Leadership Decisions Themes PDF
This slide showcase leadership dashboard indicating status of change requests for effective leadership decisions which can benefit organizations in earning additional revenues and stimulate employee performance. It contains change request due in a week, change request due in month, open changes, waiting for approval, open changes by risk, change requests by status and change requests by due date.Showcasing this set of slides titled Dashboard Indicating Status Of Change Requests For Effective Leadership Decisions Themes PDF The topics addressed in these templates are Dashboard Indicating, Requests Effective, Leadership Decisions All the content presented in this PPT design is completely editable. Download it and make adjustments in color, background, font etc. as per your unique business setting.
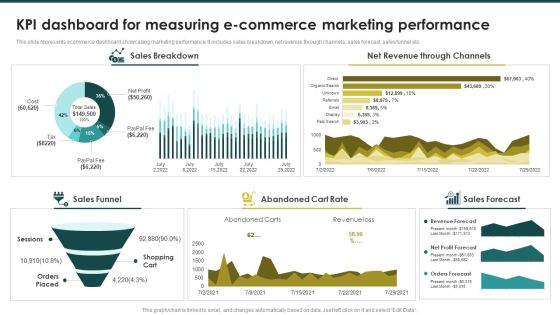
KPI Dashboard For Measuring Ecommerce Marketing Ecommerce Marketing Plan To Enhance Brochure PDF
This slide represents ecommerce dashboard showcasing marketing performance. It includes sales breakdown, net revenue through channels, sales forecast, sales funnel etc.Find highly impressive KPI Dashboard For Measuring Ecommerce Marketing Ecommerce Marketing Plan To Enhance Brochure PDF on Slidegeeks to deliver a meaningful presentation. You can save an ample amount of time using these presentation templates. No need to worry to prepare everything from scratch because Slidegeeks experts have already done a huge research and work for you. You need to download KPI Dashboard For Measuring Ecommerce Marketing Ecommerce Marketing Plan To Enhance Brochure PDF for your upcoming presentation. All the presentation templates are 100precent editable and you can change the color and personalize the content accordingly. Download now.

Kpi Dashboard To Monitor Sales Opportunities Strategic Promotion Plan To Improve Product Diagrams PDF
Mentioned slide shows the KPI dashboard that can be used to track win and lost sales opportunities. It includes metrics namely won opportunities, lost opportunities, pipeline by territory, total opportunities.Explore a selection of the finest Kpi Dashboard To Monitor Sales Opportunities Strategic Promotion Plan To Improve Product Diagrams PDF here. With a plethora of professionally designed and pre-made slide templates, you can quickly and easily find the right one for your upcoming presentation. You can use our Kpi Dashboard To Monitor Sales Opportunities Strategic Promotion Plan To Improve Product Diagrams PDF to effectively convey your message to a wider audience. Slidegeeks has done a lot of research before preparing these presentation templates. The content can be personalized and the slides are highly editable. Grab templates today from Slidegeeks.

Employer Brand Marketing On Social Media Platform Recruitment Dashboard To Track Performance Brochure PDF
This slide covers the recruitment dashboard to keep track of applications, acceptance ratio, offers accepted versus offers provided etc. Find highly impressive Employer Brand Marketing On Social Media Platform Recruitment Dashboard To Track Performance Brochure PDF on Slidegeeks to deliver a meaningful presentation. You can save an ample amount of time using these presentation templates. No need to worry to prepare everything from scratch because Slidegeeks experts have already done a huge research and work for you. You need to download Employer Brand Marketing On Social Media Platform Recruitment Dashboard To Track Performance Brochure PDF for your upcoming presentation. All the presentation templates are 100 Precent editable and you can change the color and personalize the content accordingly. Download now.
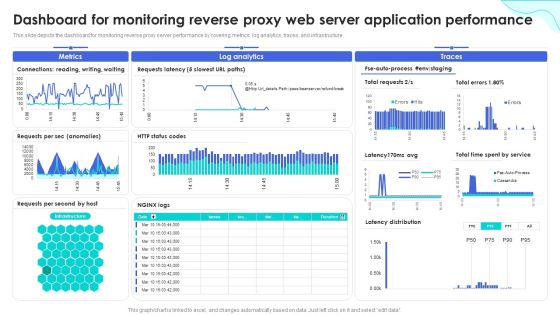
Reverse Proxy Web Server Dashboard For Monitoring Reverse Proxy Web Server Guidelines PDF
This slide depicts the dashboard for monitoring reverse proxy server performance by covering metrics, log analytics, traces, and infrastructure. Find highly impressive Reverse Proxy Web Server Dashboard For Monitoring Reverse Proxy Web Server Guidelines PDF on Slidegeeks to deliver a meaningful presentation. You can save an ample amount of time using these presentation templates. No need to worry to prepare everything from scratch because Slidegeeks experts have already done a huge research and work for you. You need to download Reverse Proxy Web Server Dashboard For Monitoring Reverse Proxy Web Server Guidelines PDF for your upcoming presentation. All the presentation templates are 100 percent editable and you can change the color and personalize the content accordingly. Download now.

Seo Reporting Dashboard To Evaluate Website Rank Search Engine Optimization Services To Minimize Template PDF
The purpose of this slide is to outline mobile search engine optimization SEO reporting dashboard. It covers different metrics such as web traffic overview, total views, content overview, goal value and conversion etc. This Seo Reporting Dashboard To Evaluate Website Rank Search Engine Optimization Services To Minimize Template PDF is perfect for any presentation, be it in front of clients or colleagues. It is a versatile and stylish solution for organizing your meetings. The Seo Reporting Dashboard To Evaluate Website Rank Search Engine Optimization Services To Minimize Template PDF features a modern design for your presentation meetings. The adjustable and customizable slides provide unlimited possibilities for acing up your presentation. Slidegeeks has done all the homework before launching the product for you. So, do not wait, grab the presentation templates today.

Guide To Develop And Estimate Brand Value Financial KPI Dashboard To Measure Brand Performance Formats PDF
Mentioned slide showcases KPI dashboard that can be used to check the financial performance of a brand. Metrics covered in the dashboard are return on assets, working capital ratio, return on equity etc.Coming up with a presentation necessitates that the majority of the effort goes into the content and the message you intend to convey. The visuals of a PowerPoint presentation can only be effective if it supplements and supports the story that is being told. Keeping this in mind our experts created Guide To Develop And Estimate Brand Value Financial KPI Dashboard To Measure Brand Performance Formats PDF to reduce the time that goes into designing the presentation. This way, you can concentrate on the message while our designers take care of providing you with the right template for the situation.

Strategies For Effective Product Metric Dashboard To Track Product Success Elements PDF
This slide represents dashboard for tracking product success. It covers new customer, total sessions, purchase, total inquires, total crashes etc. Explore a selection of the finest Strategies For Effective Product Metric Dashboard To Track Product Success Elements PDF here. With a plethora of professionally designed and pre-made slide templates, you can quickly and easily find the right one for your upcoming presentation. You can use our Strategies For Effective Product Metric Dashboard To Track Product Success Elements PDF to effectively convey your message to a wider audience. Slidegeeks has done a lot of research before preparing these presentation templates. The content can be personalized and the slides are highly editable. Grab templates today from Slidegeeks.
 Home
Home