Data Dashboard
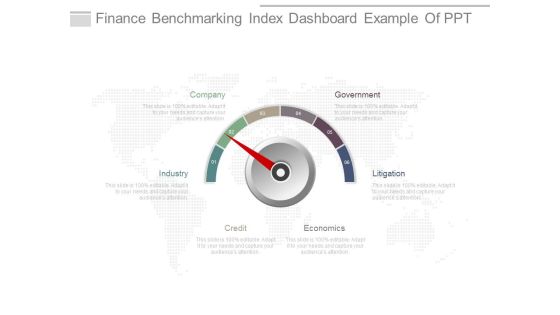
Finance Benchmarking Index Dashboard Example Of Ppt
This is a finance benchmarking index dashboard example of ppt. This is a six stage process. The stages in this process are industry, company, government, litigation, economics, credit.

Kpi Dashboard Ppt Presentation Background Images
This is a kpi dashboard ppt presentation background images. This is a three stage process. The stages in this process are revenue, labor cost, customer satisfaction.

Performance Indicators Dashboard Example Powerpoint Layout
This is a performance indicators dashboard example powerpoint layout. This is a four stage process. The stages in this process are management, resources, processes, analyze solution.
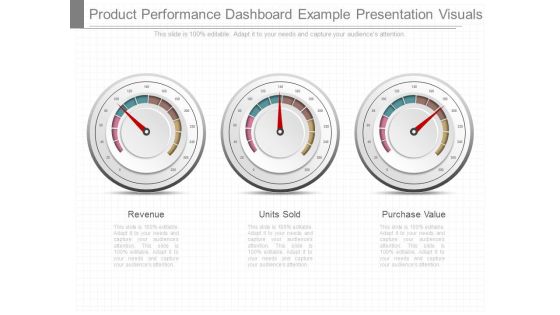
Product Performance Dashboard Example Presentation Visuals
This is a product performance dashboard example presentation visuals. This is a three stage process. The stages in this process are revenue, units sold, purchase value.

Business Dashboard Diagram Ppt Powerpoint Slides
This is a business dashboard diagram ppt powerpoint slides. This is a three stage process. The stages in this process are low, medium, high.

Business Kpi Dashboard Example Powerpoint Presentation
This is a business kpi dashboard example powerpoint presentation. This is a four stage process. The stages in this process are marketing, sales, operations, customer.

Dashboard Design Tools Ppt Presentation Slides
This is a dashboard design tools ppt presentation slides. This is a three stage process. The stages in this process are performance, speed, energy.

Dashboard Performance Indicators Ppt Powerpoint Images
This is a dashboard performance indicators ppt powerpoint images. This is a four stage process. The stages in this process are daily activities, average consumption, covered distance, clock.
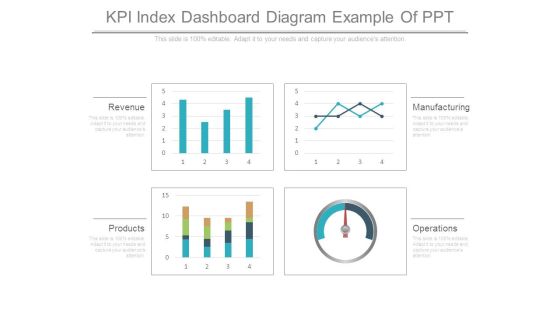
Kpi Index Dashboard Diagram Example Of Ppt
This is a kpi index dashboard diagram example of ppt. This is a four stage process. The stages in this process are revenue, products, operations, manufacturing.
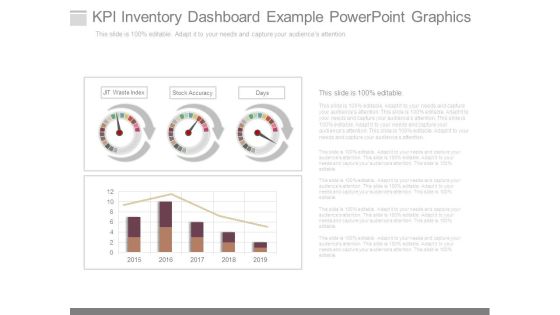
Kpi Inventory Dashboard Example Powerpoint Graphics
This is a kpi inventory dashboard example powerpoint graphics. This is a three stage process. The stages in this process are jit waste index, stock accuracy, days.
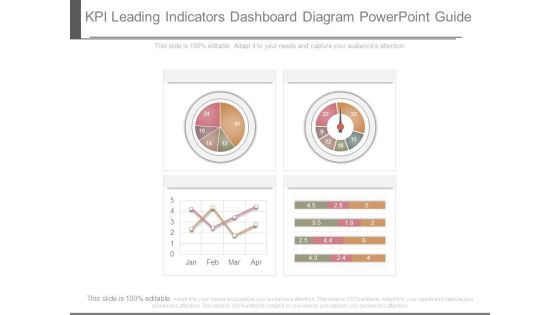
Kpi Leading Indicators Dashboard Diagram Powerpoint Guide
This is a kpi leading indicators dashboard diagram powerpoint guide. This is a four stage process. The stages in this process are business, success, process.
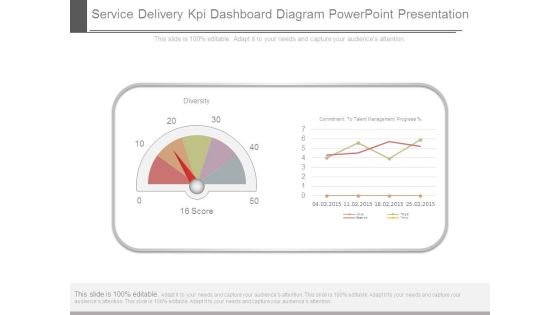
Service Delivery Kpi Dashboard Diagram Powerpoint Presentation
This is a service delivery kpi dashboard diagram powerpoint presentation. This is a two stage process. The stages in this process are diversity, commitment to talent management progress.

Dashboard Business Intelligence Diagram Powerpoint Slides
This is a dashboard business intelligence diagram powerpoint slides. This is a four stage process. The stages in this process are quickbase, flexible, simple, organized.
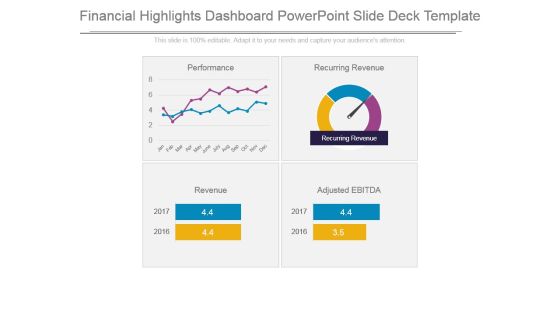
Financial Highlights Dashboard Powerpoint Slide Deck Template
This is a financial highlights dashboard powerpoint slide deck template. This is a four stage process. The stages in this process are recurring revenue, performance, revenue, adjusted ebitda.

Performance Dashboard Ppt PowerPoint Presentation Background Designs
This is a performance dashboard ppt powerpoint presentation background designs. This is a one stage process. The stages in this process are performance, management, marketing, strategy, business.

Dashboard Ppt PowerPoint Presentation Inspiration Introduction
This is a dashboard ppt powerpoint presentation inspiration introduction. This is a three stage process. The stages in this process are low, medium, high.

Dashboard Ppt PowerPoint Presentation Gallery Graphics Template
This is a dashboard ppt powerpoint presentation gallery graphics template. This is a three stage process. The stages in this process are low, medium, high, measurement.

Dashboard Ppt PowerPoint Presentation File Designs Download
This is a dashboard ppt powerpoint presentation file designs download. This is a three stage process. The stages in this process are business, management, planning, strategy, marketing.

Financial Highlights Growth Analysis Dashboard Powerpoint Slide
This is a financial highlights growth analysis dashboard powerpoint slide. This is a four stage process. The stages in this process are profit and loss, sales, operating expenses, operating income, net income, profitability.

Manufacturing Dashboard Examples Ppt Slide Show
This is a manufacturing dashboard examples ppt slide show. This is a five stage process. The stages in this process are units per hour, effective rate, units until, time unit, status information.

Key Performance Indicators Dashboard Powerpoint Slide Show
This is a key performance indicators dashboard powerpoint slide show. This is a four stage process. The stages in this process are focus, objective, measures, targets, invites, vision and strategy, area of focus, metrics, objectives.

Key Performance Indicators Dashboard Powerpoint Themes
This is a key performance indicators dashboard powerpoint themes. This is a four stage process. The stages in this process are focus, objective, measures, targets, invites, vision and strategy, area of focus.
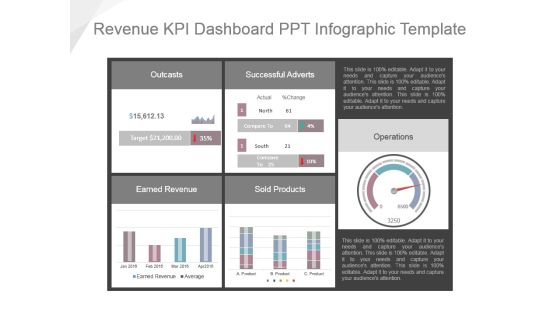
Revenue Kpi Dashboard Ppt Infographic Template
This is a revenue kpi dashboard ppt infographic template. This is a five stage process. The stages in this process are outcasts, successful adverts, earned revenue, sold products, operations.
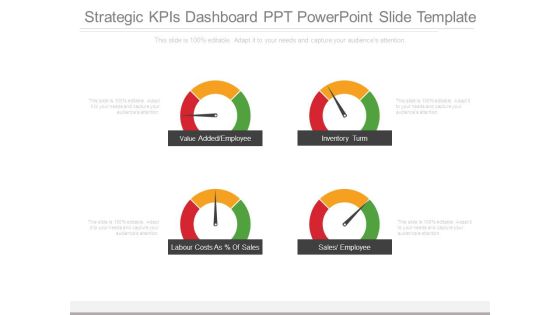
Strategic Kpis Dashboard Ppt Powerpoint Slide Template
This is a strategic kpis dashboard ppt powerpoint slide template. This is a four stage process. The stages in this process are value added employee, inventory turn, labour costs as of sales, sales employee.

Capital Markets Dashboard Ppt Powerpoint Slide Background
This is a capital markets dashboard ppt powerpoint slide background. This is a three stage process. The stages in this process are weekly sales, product inventory, key performance indicators.

Project Management Status Dashboard Diagram Powerpoint Ideas
This is a project management status dashboard diagram powerpoint ideas. This is a six stage process. The stages in this process are tabular reports, project s status, task status, visual reports, completed tasks, task in progress.
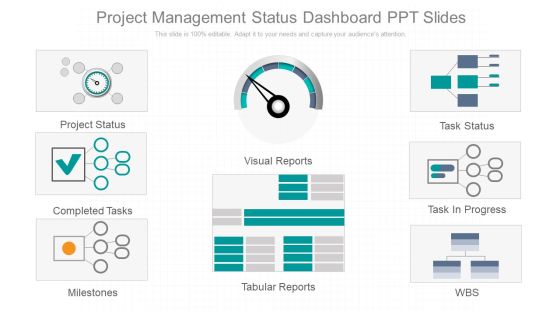
Project Management Status Dashboard Ppt Slides
This is a project management status dashboard ppt slides. This is a eight stage process. The stages in this process are project status, completed tasks, milestones, visual reports, tabular reports, task status, task in progress, wbs.

Software Dashboard Manager Test Diagram Presentation Examples
This is a software dashboard manager test diagram presentation examples. This is a four stage process. The stages in this process are issues by risk level, reported issues, location on map, top contributing factors.

Clear Point Strategy Dashboard Ppt Presentation
This is a clear point strategy dashboard ppt presentation. This is a four stage process. The stages in this process are financial perspective, internal processes perspective, learning and growth perspective, customer perspective.

Balanced Scorecard Dashboard Framework Ppt Sample
This is a balanced scorecard dashboard framework ppt sample. This is a four stage process. The stages in this process are learning and growth, financial, internal business processes, customer.
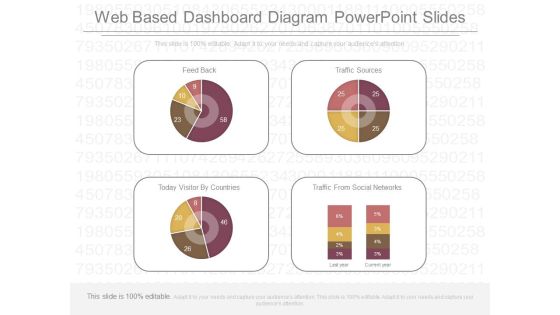
Web Based Dashboard Diagram Powerpoint Slides
This is a web based dashboard diagram powerpoint slides. This is a four stage process. The stages in this process are feed back, traffic sources, today visitor by countries, traffic from social networks.
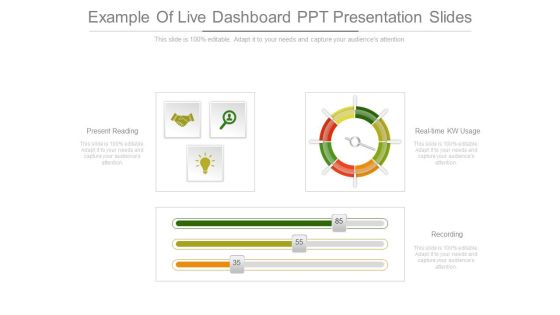
Example Of Live Dashboard Ppt Presentation Slides
This is a example of live dashboard ppt presentation slides. This is a three stage process. The stages in this process are present reading, real time kw usage, recording.
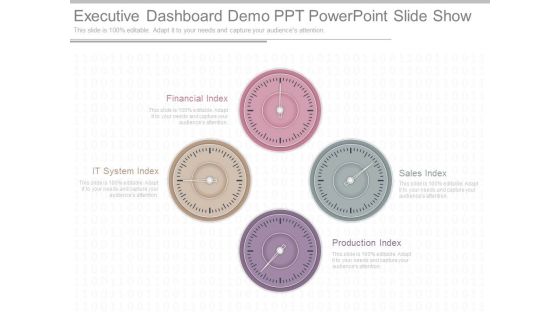
Executive Dashboard Demo Ppt Powerpoint Slide Show
This is a executive dashboard demo ppt powerpoint slide show. This is a four stage process. The stages in this process are financial index, it system index, production index, sales index.
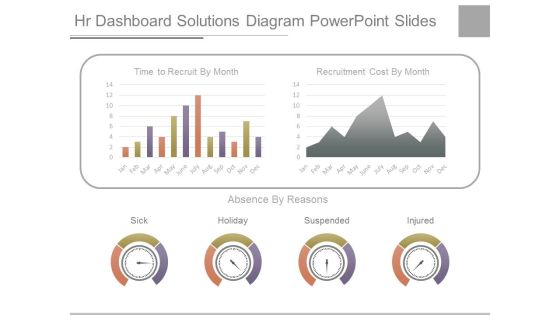
Hr Dashboard Solutions Diagram Powerpoint Slides
This is a hr dashboard solutions diagram powerpoint slides. This is a two stage process. The stages in this process are time to recruit by month, recruitment cost by month, sick, holiday, suspended, injured.
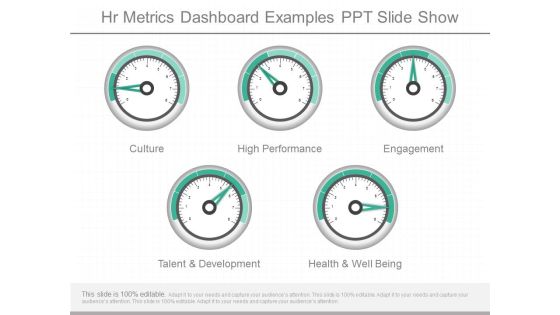
Hr Metrics Dashboard Examples Ppt Slide Show
This is a hr metrics dashboard examples ppt slide show. This is a five stage process. The stages in this process are culture, high performance, engagement, talent and development, health and well being.

Project Management Kpi Dashboard Diagram Powerpoint Images
This is a project management kpi dashboard diagram powerpoint images. This is a four stage process. The stages in this process are project budget, project goals, project task management, project schedule.

Build Dashboard For Business Diagram Powerpoint Show
This is a build dashboard for business diagram powerpoint show. This is a four stage process. The stages in this process are average internal pv examination lead time, average entry variance, average internal audit lead time, amount contribution.

Business Management Dashboard Design Ppt Slides Show
This is a business management dashboard design ppt slides show. This is a four stage process. The stages in this process are crm system, property system, asset system, finance system.

Competitive Intelligence Dashboard Diagram Ppt Slides
This is a competitive intelligence dashboard diagram ppt slides. This is a four stage process. The stages in this process are monthly sales, inventory turns, customer complaints, company, subject area.
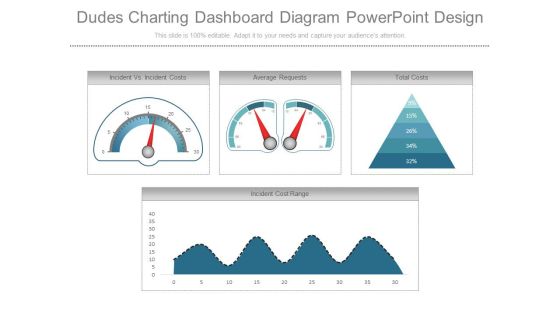
Dudes Charting Dashboard Diagram Powerpoint Design
This is a dudes charting dashboard diagram powerpoint design. This is a four stage process. The stages in this process are incident vs incident costs, average requests, total costs, incident cost range.
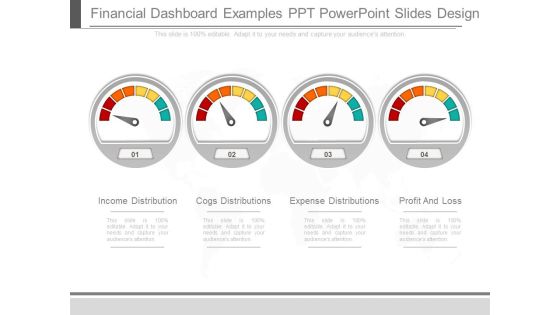
Financial Dashboard Examples Ppt Powerpoint Slides Design
This is a financial dashboard examples ppt powerpoint slides design. This is a four stage process. The stages in this process are income distribution, cogs distributions, expense distributions, profit and loss.

Sales Management Dashboard Sample Diagram Powerpoint Templates
This is a sales management dashboard sample diagram powerpoint templates. This is a four stage process. The stages in this process are performance vs quota, weekly sales, product inventory, purchases by region, step.

Business Intelligence Performance Dashboard Ppt Powerpoint Slides
This is a business intelligence performance dashboard ppt powerpoint slides. This is a six stage process. The stages in this process are total revenue, detailed profit of top product line, part capacity allocation, market share, customer satisfaction, quality notification.
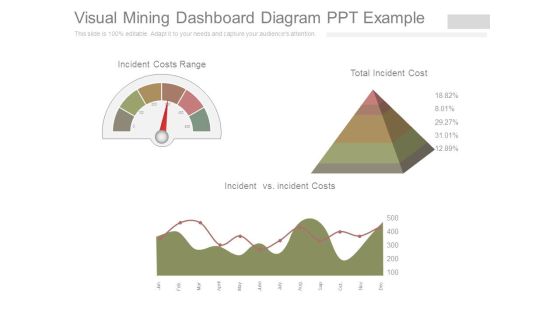
Visual Mining Dashboard Diagram Ppt Example
This is a visual mining dashboard diagram ppt example. This is a three stage process. The stages in this process are incident costs range, incident vs incident costs, total incident cost.

Business Metrics Dashboard Slide Powerpoint Templates
This is a business metrics dashboard slide powerpoint templates. This is a five stage process. The stages in this process are cash flow, turnover, productivity, customer satisfaction, net income.

Business Object Dashboard Slide Good Ppt Example
This is a business object dashboard slide good ppt example. This is a seven stage process. The stages in this process are engineering, construction, finance, environment, safety, operations, maintenance.
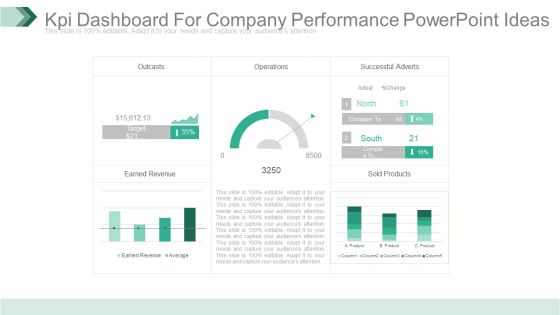
Kpi Dashboard For Company Performance Powerpoint Ideas
This is a kpi dashboard for company performance powerpoint ideas. This is a five stage process. The stages in this process are outcasts, operations, successful adverts, earned revenue, sold products.

Kpi Dashboard For Operations Powerpoint Slide Images
This is a kpi dashboard for operations powerpoint slide images. This is a four stage process. The stages in this process are outcasts, earned revenue, operations, successful adverts, sold products.
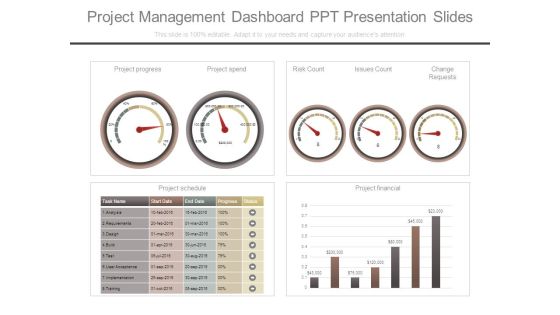
Project Management Dashboard Ppt Presentation Slides
This is a project management dashboard ppt presentation slides. This is a four stage process. The stages in this process are project progress, project spend, risk count, issues count, change requests, project schedule, project financial, task name, start date, end date, progress, status, analysis, requirements, design, build, test, user acceptance, implementation, training.

Sales Kpi Dashboard Graphics Example Of Ppt
This is a sales kpi dashboard graphics example of ppt. This is a five stage process. The stages in this process are cost per lead, revenue per lead, new customers, customer satisfaction, revenue per sale, cost per sale, profit per sale.
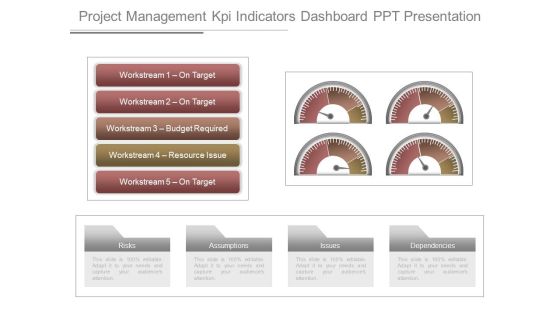
Project Management Kpi Indicators Dashboard Ppt Presentation
This is a project management kpi indicators dashboard ppt presentation. This is a three stage process. The stages in this process are workstream 1 on target, workstream 2 on target, workstream 3 budget required, workstream 4 resource issue, workstream 5 on target.
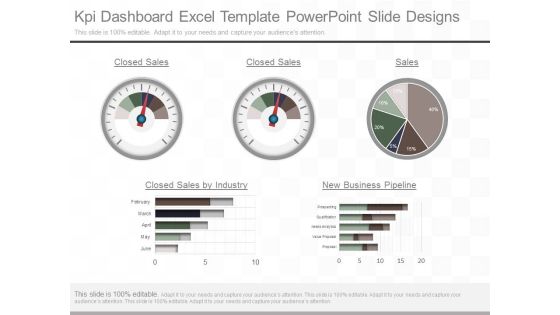
Kpi Dashboard Excel Template Powerpoint Slide Designs
This is a kpi dashboard excel template powerpoint slide designs. This is a five stage process. The stages in this process are closed sales, closed sales, sales, closed sales by industry, new business pipeline, february, march april, may, june, prospecting, qualification, needs analytics, value proposal, proposal.

Kpi Service Dashboard Ppt Powerpoint Slide Designs
This is a kpi service dashboard ppt powerpoint slide designs. This is a four stage process. The stages in this process are service requests resolved within target, service requests by priority, service requests by category, calls offered, jan, feb, mar, apr, may, june, july, aug, sep, oct, nov, dec.

Dashboard Percentage Ppt PowerPoint Presentation Professional Rules
Presenting this set of slides with name dashboard percentage ppt powerpoint presentation professional rules. The topics discussed in these slides are finance, marketing, management, investment, analysis. This is a completely editable PowerPoint presentation and is available for immediate download. Download now and impress your audience.

Project Dashboard Ppt PowerPoint Presentation Show Samples
This is a project dashboard ppt powerpoint presentation show samples. The topics discussed in this diagram are business, management, marketing, dashboard. This is a completely editable PowerPoint presentation, and is available for immediate download.
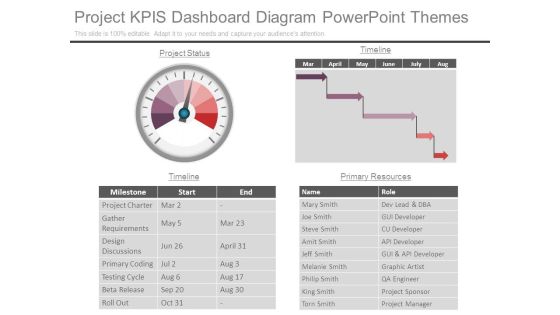
Project Kpis Dashboard Diagram Powerpoint Themes
This is a project kpis dashboard diagram powerpoint themes. This is a one stage process. The stages in this process are project status, timeline, name, role, milestone, start, end, primary resources, project charter, gather requirements, design discussions, primary coding, testing cycle, beta release, roll out, mary smith, joe smith, steve smith, amit smith, jeff smith, melanie smith, philip smith, king smith, torn smith, dev lead and dba, gui developer, cu developer, api developer, gui and api developer, graphic artist, qa engineer, project sponsor, project manager.

Dashboard Ppt PowerPoint Presentation Infographic Template Mockup
This is a dashboard ppt powerpoint presentation infographic template mockup. This is a three stage process. The stages in this process are dashboard, business, finance, marketing, management.

Dashboard Ppt PowerPoint Presentation Show Themes
This is a dashboard ppt powerpoint presentation show themes. This is a three stage process. The stages in this process are dashboard, management, planning, marketing, business, strategy.
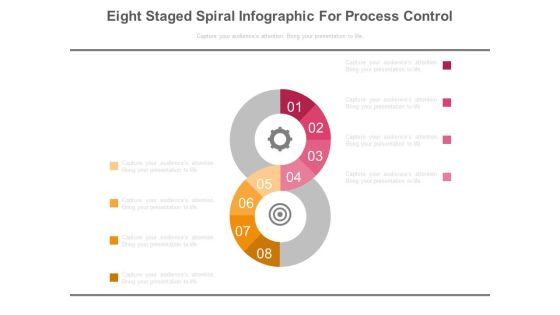
Eight Steps Dashboard Matrics Powerpoint Slides
This PowerPoint template eight number infographic chart. Download this PPT chart to depict target planning. This PowerPoint slide is of great help in the business sector to make realistic presentations and provides effective way of presenting your newer thoughts.

Finance Dashboard Ppt PowerPoint Presentation Diagrams
This is a finance dashboard ppt powerpoint presentation diagrams. This is a four stage process. The stages in this process are increased efficiency, better business decision making, improved customer experience and engagement, achieved financial savings.

 Home
Home