Data Cleansing
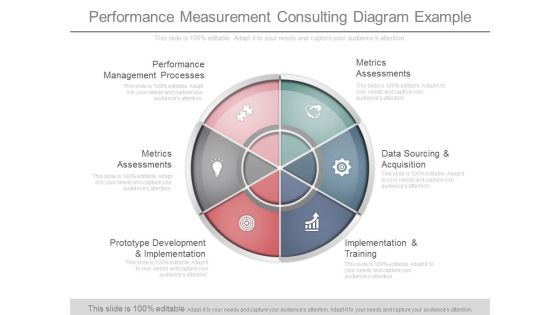
Performance Measurement Consulting Diagram Example
This is a performance measurement consulting diagram example. This is a six stage process. The stages in this process are performance management processes, metrics assessments, prototype development and implementation, metrics assessments, data sourcing and acquisition, implementation and training.
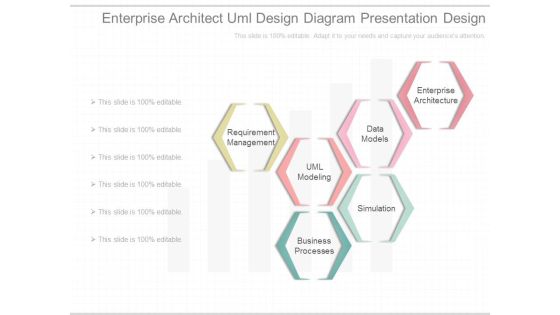
Enterprise Architect Uml Design Diagram Presentation Design
This is a enterprise architect uml design diagram presentation design. This is a six stage process. The stages in this process are requirement management, uml modeling, data models, business processes, simulation, enterprise architecture.

Research Proposal Steps Ppt PowerPoint Presentation Complete Deck With Slides
This is a research proposal steps ppt powerpoint presentation complete deck with slides. This is a one stage process. The stages in this process are planning, table, data management, teamwork, process.

Cost Optimization Techniques Ppt PowerPoint Presentation Portfolio Professional
This is a cost optimization techniques ppt powerpoint presentation portfolio professional. This is a four stage process. The stages in this process are cost optimization techniques, improving data management, supply chain optimization, process automation, customer self service.

Possible Iot Solutions To Integrate In Logistics Portrait PDF
The following slide depicts possible internet of things IoT solutions to integrate in logistics. It provides details about data streaming, predictive, analytics, fleet management, telematics, platform, mobile app, shared vehicle, etc. Deliver and pitch your topic in the best possible manner with this Possible Iot Solutions To Integrate In Logistics Portrait PDF. Use them to share invaluable insights on Management, Data Streaming, Services and impress your audience. This template can be altered and modified as per your expectations. So, grab it now.

Eight Tags For Business Process Indication Powerpoint Template
Our above PPT slide contains graphics of eight text tags with icons. This PowerPoint template may be used to display business process steps. Use this diagram to impart more clarity to data and to create more sound impact on viewers.

Audit System Process Ppt PowerPoint Presentation File Shapes
This is a audit system process ppt powerpoint presentation file shapes. This is a five stage process. The stages in this process are data analysis, implement change, objectives standards.
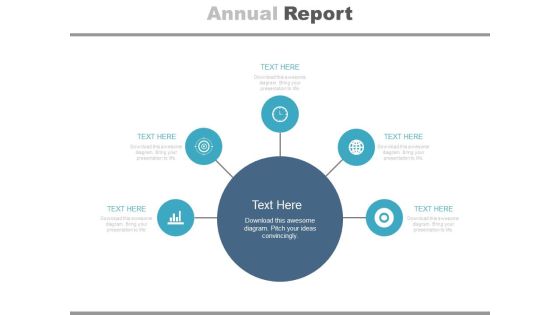
Diagram For Market Research Analysis Powerpoint Slides
This PowerPoint template has been designed with circular infographic diagram. It can be used to display steps for market research and also for financial data analysis. You can download finance PowerPoint template to prepare awesome presentations.
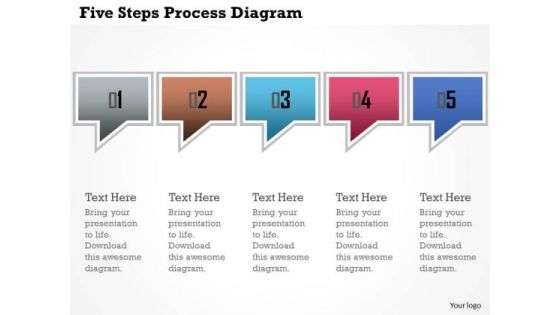
Business Diagram Five Steps Process Diagram Presentation Template
This power point template has been crafted with graphic of five dialogue boxes. This PPT contains the concept of text and data representation. Use this PPT for your business and marketing related presentations.

1 Printed Circuit Board Pcb With Chip Cpu Microprocessor With Connections For Eda Ppt Slides
Use this professional diagram to give presentations on data processors, microprocessor and integrated circuits. This diagram has graphics of printed circuit board PCB with chip CPU microprocessor with connections. This diagram is best to give presentations on electronic systems.
1 Printed Circuit Board Pcb With Cpu Chip Icon For Chip Design Eda Ppt Slides
Above diagram is perfect to give presentations on data processors, microprocessor, and integrated circuits. This diagram has graphics of Printed Circuit Board PCB CPU chip icon. This diagram is best to give presentations on electronic systems.

Four Tags For Strategy Planning Process Powerpoint Template
Steps for strategy planning can be explained with this diagram. This PowerPoint template contains diagram of four infographic tags. You can also use this design for data analysis in business presentations

Predictive Analytics Steps Ppt PowerPoint Presentation Portfolio Template
This is a predictive analytics steps ppt powerpoint presentation portfolio template. This is a six stage process. The stages in this process are define project, benefits, stages, statistics, data analysis.

Digital Resilience Biomarker Technologies IT Management Of Digital Biomarkers Information Ideas PDF
This slide represents the digital biomarkers data management architecture, and its components include raw information from assays, data parsing, metadata, biomarker data, metadata cataloguing and harmonization, clinical data pipeline, and so on. Get a simple yet stunning designed Digital Resilience Biomarker Technologies IT Management Of Digital Biomarkers Information Ideas PDF. It is the best one to establish the tone in your meetings. It is an excellent way to make your presentations highly effective. So, download this PPT today from Slidegeeks and see the positive impacts. Our easy to edit Digital Resilience Biomarker Technologies IT Management Of Digital Biomarkers Information Ideas PDF can be your go to option for all upcoming conferences and meetings. So, what are you waiting for Grab this template today.
Business Diagram Two Icons Info Graphic Presentation Template
Two circular innovative icons has been used to decorate this power point diagram template. This diagram is info graphic for data representation. Use this info graphics for business and management related presentations.

Ecommerce Solutions Sample Ppt Powerpoint Images
This is a ecommerce solutions sample ppt powerpoint images. This is a seven stage process. The stages in this process are order management, for the customer, customer support, payments, merchandising, enterprise data sources, marketing.

Voice Of The Customer And Market Communication Ppt Slides
This is a voice of the customer and market communication ppt slides. This is a five stage process. The stages in this process are voice of the customer, product manager, data and budget, market communication, market research.

Cost Accounting Practice Example Ppt Presentation
This is a cost accounting practice example ppt presentation. This is a six stage process. The stages in this process are management system, plant data collection, production standards, hourly cost rates, estimating, cost accounting.

Demand Driven Margin Optimization Ppt Powerpoint Slide Presentation Sample
This is a demand driven margin optimization ppt powerpoint slide presentation sample. This is a four stage process. The stages in this process are data management, demand modeling and segmentation, price optimization, monitoring and recalibration.
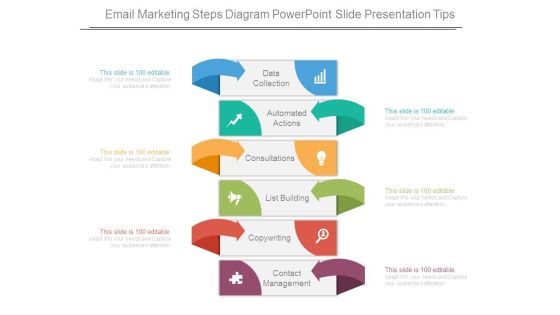
Email Marketing Steps Diagram Powerpoint Slide Presentation Tips
This is a email marketing steps diagram powerpoint slide presentation tips. This is a six stage process. The stages in this process are data collection, automated actions, consultations, list building, copywriting, contact management.
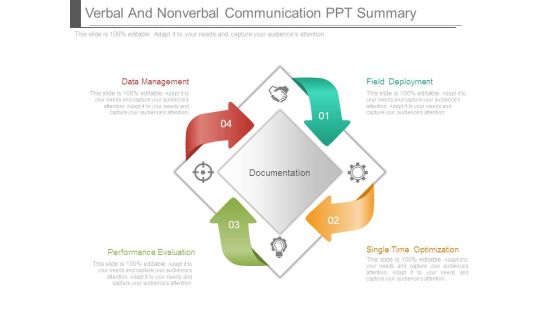
Verbal And Nonverbal Communication Ppt Summary
This is a verbal and nonverbal communication ppt summary. This is a four stage process. The stages in this process are data management, performance evaluation, single time optimization, field deployment, documentation.
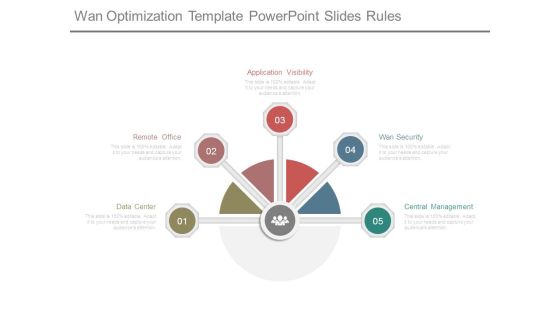
Wan Optimization Template Powerpoint Slides Rules
This is a wan optimization template powerpoint slides rules. This is a five stage process. The stages in this process are data center, remote office, application visibility, wan security, central management.

Business Diagram Five Staged Pencil Style Text Boxes Presentation Template
Our above slide displays five staged pencil style text boxes. Download our above diagram to express information in a visual way. Use this diagram and get good comments for data related presentations.

Business Diagram Four Staged Semicircular Text Box Diagram PowerPoint Template
Four staged semicircular text boxes diagram has been used to design this power point template. This diagram template contains the concept of data and process flow. Use this PPT for your business and marketing related presentations.

Business Diagram Three Colored Text Boxes Representation PowerPoint Template
Three colored text boxes diagram has been used to design this power point template. This PPT contains the concept of process based data representation. This PPT is suitable for business and sales related presentations.
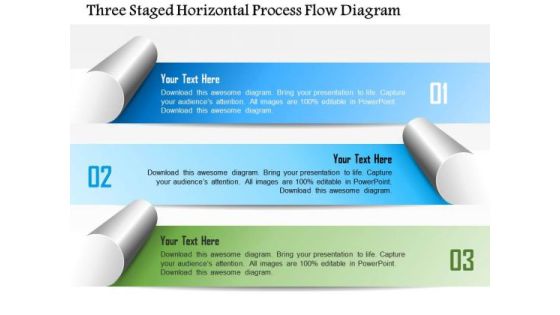
Business Diagram Three Staged Horizontal Process Flow Diagram Presentation Template
This business slide displays three staged horizontal process flow diagram. This diagram is useful for data display. Use this colorful diagram to depict three steps of any business process. It helps in clearly conveying your message to clients and audience.

Business Diagram Four Staged Process Diagram Presentation Template
Graphic of four staged process diagram has been used to craft this power point template diagram. This PPT diagram contains the concept of data and process flow representation. Use this PPT for marketing and business related presentations.

BI Implementation To Enhance Hiring Process Business Intelligence Hybrid Architecture Framework Structure PDF
This slide represents the hybrid architecture including both technologies of data mart and OLAP cubes. It includes key recommendations such as implementation of data marts as part of data security for data aggregation etc.Slidegeeks is here to make your presentations a breeze with BI Implementation To Enhance Hiring Process Business Intelligence Hybrid Architecture Framework Structure PDF With our easy-to-use and customizable templates, you can focus on delivering your ideas rather than worrying about formatting. With a variety of designs to choose from, you are sure to find one that suits your needs. And with animations and unique photos, illustrations, and fonts, you can make your presentation pop. So whether you are giving a sales pitch or presenting to the board, make sure to check out Slidegeeks first.
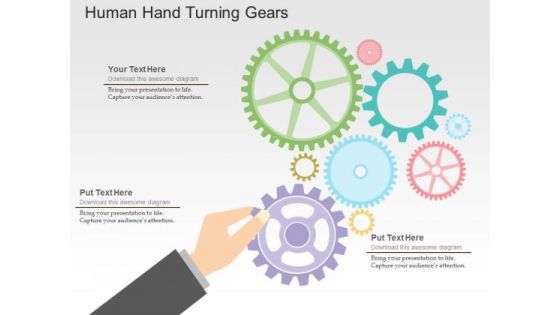
Human Hand Turning Gears PowerPoint Templates
Our above slide contains graphics of human hand turning gears. It helps to display concepts of process control and management. Use this diagram to impart more clarity to data and to create more sound impact on viewers.
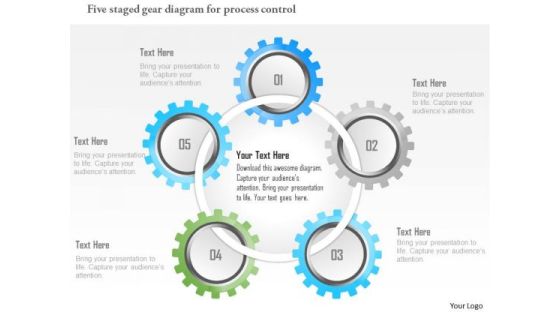
Business Diagram Five Staged Gear Diagram For Process Control Presentation Template
Our above slide displays five staged gear diagram for process control. Download our above diagram to express information in a visual way. Use this diagram and get good comments for data related presentations.

API Integration Software Development API Roadmap With Different Time Intervals Themes PDF
Presenting this set of slides with name api integration software development api roadmap with different time intervals themes pdf. This is a six stage process. The stages in this process are prototype building, data integration, license management, maintain protocols, maintain data structure, customer service support, testing. This is a completely editable PowerPoint presentation and is available for immediate download. Download now and impress your audience.
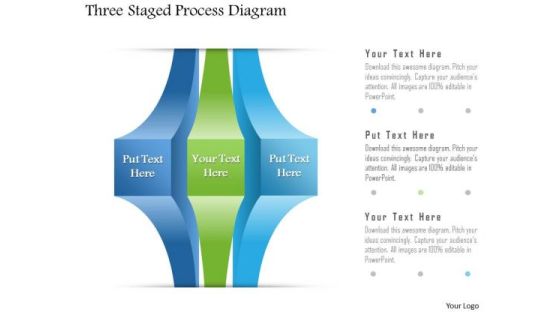
Business Diagram Three Staged Process Diagram PowerPoint Template
Three staged process diagram graphic has been used to design this power point template slide. This PPT contains the concept of data representation for business or marketing. Use this PPT for your business and sales related presentations.
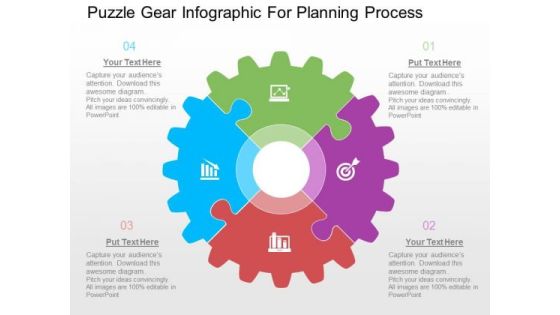
Puzzle Gear Infographic For Planning Process PowerPoint Templates
Our above PPT slide contains circular gear puzzle diagram. This puzzle gear circular diagram helps to exhibit process planning and solutions. Use this diagram to impart more clarity to data and to create more sound impact on viewers.
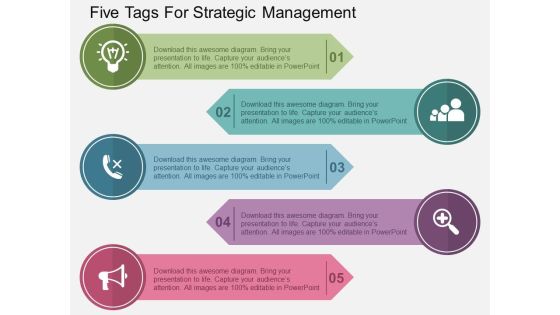
Five Tags For Strategic Management Powerpoint Templates
Our above slide contains diagram of circular infographic. It helps to exhibit six steps of goal planning. Use this diagram to impart more clarity to data and to create more sound impact on viewers.
Linear Arrow Process Diagram With Icons Powerpoint Template
This business slide has been designed with infographic of linear arrow. This arrow infographic can be used for data representation. Use this diagram for your business presentations. Build a quality presentation for your viewers with this unique diagram.
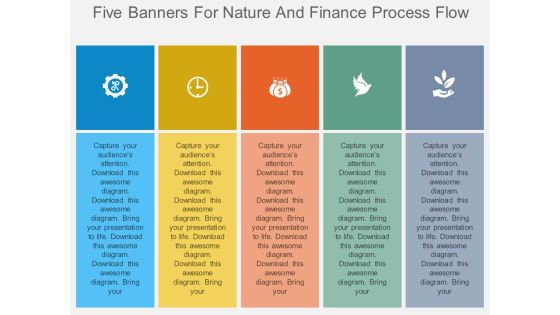
Five Banners For Nature And Finance Process Flow Powerpoint Template
This PowerPoint template has been designed with five banners nature, finance icons. This diagram is excellent visual tools for business presentations. Download this PPT slide to explain complex data immediately and clearly.
Four Arrows For Different Process Representation Powerpoint Template
This PowerPoint template has been designed with graphics of four arrows This diagram is excellent visual tools for business presentations. Download this PPT slide to explain complex data immediately and clearly.

Business Analytics Application Business Intelligence Hybrid Architecture Framework Download PDF
This slide represents the hybrid architecture including both technologies of data mart and OLAP cubes. It includes key recommendations such as implementation of data marts as part of data security for data aggregation etc. Slidegeeks is here to make your presentations a breeze with Business Analytics Application Business Intelligence Hybrid Architecture Framework Download PDF With our easy-to-use and customizable templates, you can focus on delivering your ideas rather than worrying about formatting. With a variety of designs to choose from, youre sure to find one that suits your needs. And with animations and unique photos, illustrations, and fonts, you can make your presentation pop. So whether youre giving a sales pitch or presenting to the board, make sure to check out Slidegeeks first.

Human Resource Analytics Business Intelligence Hybrid Architecture Framework Elements PDF
This slide represents the hybrid architecture including both technologies of data mart and OLAP cubes. It includes key recommendations such as implementation of data marts as part of data security for data aggregation etc. Get a simple yet stunning designed Human Resource Analytics Business Intelligence Hybrid Architecture Framework Elements PDF. It is the best one to establish the tone in your meetings. It is an excellent way to make your presentations highly effective. So, download this PPT today from Slidegeeks and see the positive impacts. Our easy-to-edit Human Resource Analytics Business Intelligence Hybrid Architecture Framework Elements PDF can be your go-to option for all upcoming conferences and meetings. So, what are you waiting for Grab this template today.
Business Diagram Five Staged Business Process Diagram With Icons Presentation Template
Our above slide displays five staged business process diagram. Download our above diagram to express information in a visual way. Use this diagram and get good comments for data related presentations.

Arrows Infographic For Strategic Management Concept Powerpoint Template
Our above PPT slide contains four curved arrows infographic design. This business diagram helps to depict business information for strategic management. Use this diagram to impart more clarity to data and to create more sound impact on viewers.

Human Resource Analytics Key Business Intelligence Trends For 2022 Elements PDF
This slide represents the current trends of the process through which enterprises uses technologies to analyze current and historical data for improving decision making and having competitive advantage. It includes BI trends for 2022 such as AI, data security, data visualization, data quality management etc. Welcome to our selection of the Human Resource Analytics Key Business Intelligence Trends For 2022 Elements PDF. These are designed to help you showcase your creativity and bring your sphere to life. Planning and Innovation are essential for any business that is just starting out. This collection contains the designs that you need for your everyday presentations. All of our PowerPoints are 100 percent editable, so you can customize them to suit your needs. This multi-purpose template can be used in various situations. Grab these presentation templates today.

Introduction Of Services Offered By IT Organization Topics PDF
This slide includes types of services offered by an IT organization. It includes tech support, data security, cloud services etc. Presenting Introduction Of Services Offered By IT Organization Topics PDF to dispense important information. This template comprises four stages. It also presents valuable insights into the topics including Tech Support, Cloud Services, Data Security. This is a completely customizable PowerPoint theme that can be put to use immediately. So, download it and address the topic impactfully.

Business Diagram Four Staged Flag Diagram For Timeline Presentation Template
Graphic of four staged flag diagram has been used to decorate this power point template diagram. This PPT diagram contains the concept of data flow and timeline formation. Use this PPT for marketing and business related presentations.

Current State Gap Analysis Strategy For Process Optimization Diagrams PDF
This slide illustrates gap between current state and desired state of an organization with required action plan. It includes focus areas like data quality, reporting, analysis, process etc. Presenting Current State Gap Analysis Strategy For Process Optimization Diagrams PDF to dispense important information. This template comprises five stages. It also presents valuable insights into the topics including Data Quality, Reporting, Analysis. This is a completely customizable PowerPoint theme that can be put to use immediately. So, download it and address the topic impactfully.
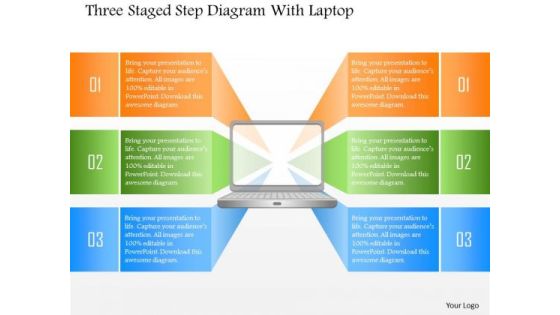
Business Diagram Three Staged Step Diagram With Laptop PowerPoint Template
Three staged step diagram with laptop has been used to craft this power point template slide. This PPT contains the concept of data representation for computer technology related topics. Use this PPt for your technology related presentations.

Market Research And Analysis Diagram Ppt Sample
This is a market research and analysis diagram ppt sample. This is a five stage process. The stages in this process are location analysis, data mining, sowt analysis, market research and analysis, competition analysis, marketing potential.
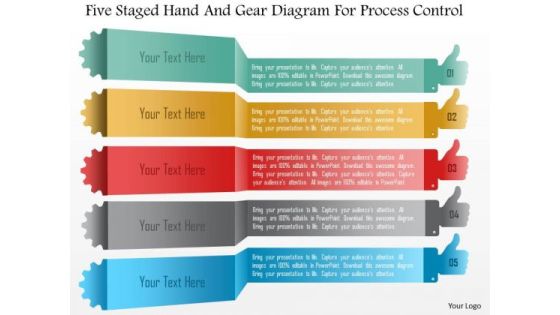
Business Diagram Five Staged Hand And Gear Diagram For Process Control PowerPoint Template
Five staged hand and gear diagram has been used to design this power point template. This PPT contains the concept of data representation and process control. Use this PPT slide for your marketing and business process related presentations.
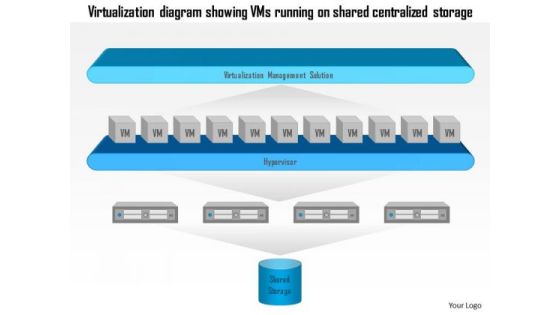
Business Diagram Virtualization Diagram Showing Vms Running On Shared Centralized Storage Ppt Slide
This diagram has been designed with graphic of virtualization diagram. This diagram is representing the VMS running on shared and centralized storage. This diagram may be used for data storage related presentations.

Market Competitive Analysis Powerpoint Slide Deck
This is a market competitive analysis powerpoint slide deck. This is a six stage process. The stages in this process are customer analysis, true capabilities analysis, market competitive analysis, positioning and differentiating, segmenting and targeting, data mining and profiting.
Five Banners With Communication And Technology Icons Powerpoint Template
This PowerPoint template has been designed with five banners and communication technology icons. This diagram is excellent visual tools for business presentations. Download this PPT slide to explain complex data immediately and clearly.
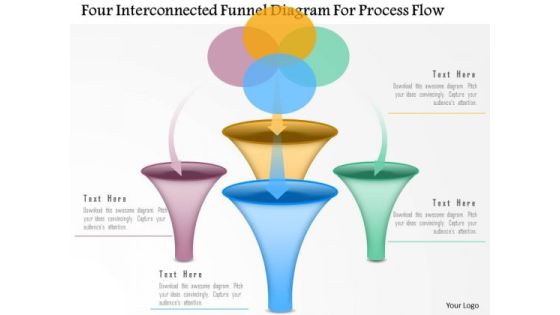
Business Diagram Four Interconnected Funnel Diagram For Process Flow Presentation Template
Graphic of four interconnected funnel diagram has been used to design this power point template diagram. This PPT diagram contains the concept of data and process flow. Use this PPT for marketing and business related presentations.
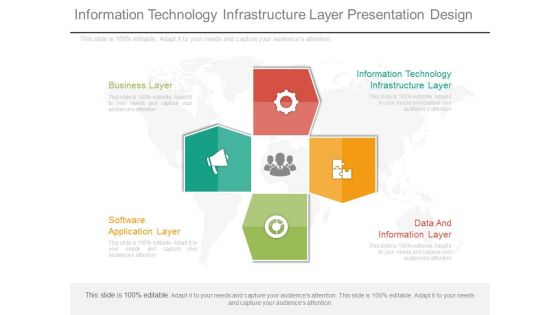
Information Technology Infrastructure Layer Presentation Design
This is an information technology infrastructure layer presentation design. This is a four stage process. The stages in this process are business layer, information technology infrastructure layer, data and information layer, software application layer.
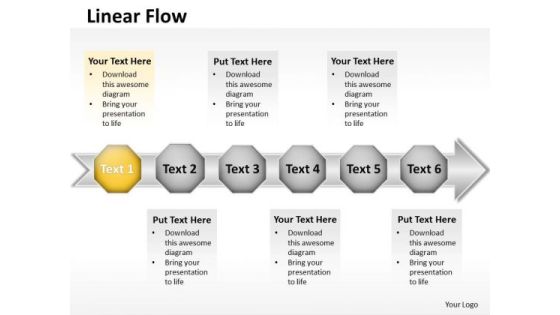
Ppt Linear Flow Movement Writing Process PowerPoint Presentation Templates
PPT linear flow movement writing process powerpoint presentation Templates-This image has been professionally designed to emphasize the paths through which the data moves, and the processes that produce, use, and transform data. Deliver amazing presentations to mesmerize your audience.-PPT linear flow movement writing process powerpoint presentation Templates-3d, Advertisement, Advertising, Arrow, Border, Business, Circles, Collection, Customer, Design, Element, Icon, Idea, Illustration, Info, Information, Isolated, Label, Light, Location, Needle, New, Notification, Notify, Point, Pointer, Promotion, Role, Rounded
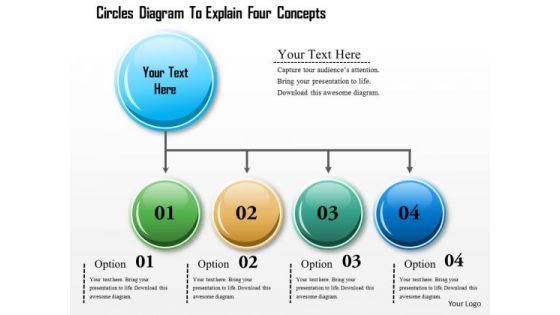
Business Diagram Circles Diagram To Explain Four Concepts Presentation Template
Explain the concept of data flow in any presentation with this unique PPT. This PPT contains the graphic of four staged text boxes. This PPT is suitable for business and sales presentations.
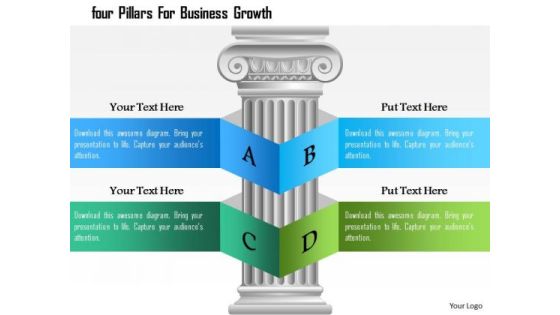
Business Diagram Four Pillars For Business Growth Presentation Template
Concept of text and data representation with business growth has been displayed in this power point template. This PPT contains the graphic of pillar and alphabet ribbons. Use this PPT diagram and get good comments from your viewers.

Business Diagram Highway Signboard With Road And Text Boxes PowerPoint Template
Graphic of highway signboard with road and text has been used to craft this power point template diagram. This PPT contains the concept of transportation and data representation. Use this PPT for your business and management related presentations.

Business Diagram Three Staged Text Representation Diagram Presentation Template
Display the concept of data flow in any presentation with this unique power point template. This PPT contains the graphic of three staged text boxes. Use this PPT for your business and management related presentations.
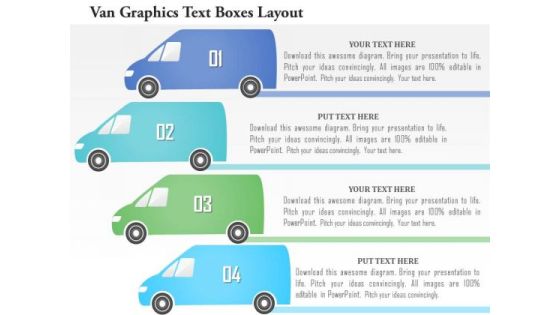
Business Diagram Van Graphics Text Boxes Layout Presentation Template
This business diagram has been designed with graphic of van style four text boxes. These text boxes are used to display data for any process. Download this diagram to build an exclusive presentation for your views.

Business Diagram Three Different Pie Charts For Result Analysis Presentation Template
Three different pie charts are used to designed this power point template slide. This PPT slide contains the concept of result analysis. Use this PPT slide for your data and process related presentations.

Business Diagram Four Design For Concept Coding Presentation Template
Four colorful text boxes has been used to craft this power point template. This PPT diagram contains the concept of coding and data representation. Use this PPT for business and technology related presentations.

API Management For Building Software Applications Monthly API Roadmap With The Development Process Ideas PDF
Presenting this set of slides with name api management for building software applications monthly api roadmap with the development process ideas pdf. This is a twelve stage process. The stages in this process are data structure, prototype building, data integration, license management, customer service support, desktop version launched, 2020. This is a completely editable PowerPoint presentation and is available for immediate download. Download now and impress your audience.
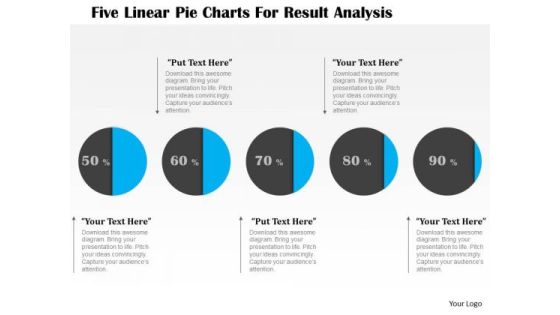
Business Diagram Five Linear Pie Charts For Result Analysis Presentation Template
This business diagram displays graphic of five staged process flow diagram. This PPT slide contains the concept of business data representation. Use this diagram to build professional presentation for your viewers.

Customer Satisfaction Index Strategy To Increase Telecom Industry Experience Template PDF
Following slide illustrates customer satisfaction index approaches utilized by telecom organizations to improve user experience and generate more profit. This slide provides data regarding various CSI techniques, action steps and overall impact.
Business Diagram Innovative Icons Infographic Presentation Template
Three circular innovative icons has been used to decorate this power point diagram template. This diagram is info graphic for data representation. Use this info graphics for business and management related presentations.
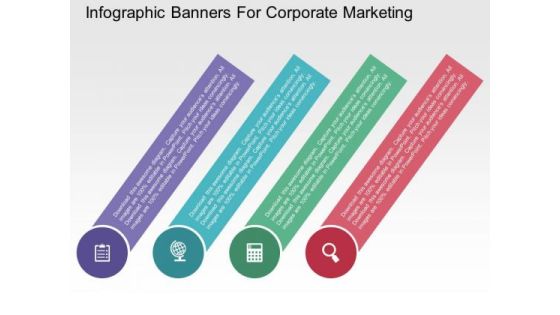
Infographic Banners For Corporate Marketing PowerPoint Templates
Our above PPT slide contains diagram of infographic banners. It helps to display steps of corporate marketing. Use this diagram to impart more clarity to data and to create more sound impact on viewers.

Blockchain Platform For Industries For Manufacturing Plants Information PDF
This slide showcases manufacturing industry blockchain process flow. It provides information about shipment, production, order, delivery, inventory, logistics, quality check, data matching, etc. Showcasing this set of slides titled Blockchain Platform For Industries For Manufacturing Plants Information PDF. The topics addressed in these templates are Blockchain Record, Origination, Data Matching. All the content presented in this PPT design is completely editable. Download it and make adjustments in color, background, font etc. as per your unique business setting.
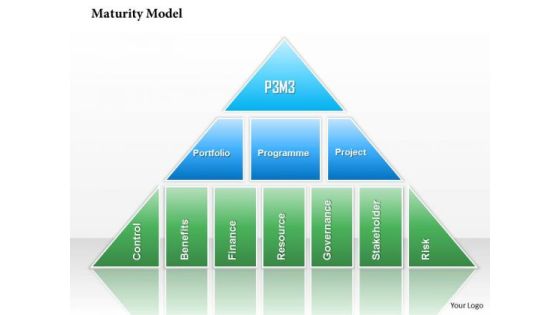
Business Framework Maturity Model PowerPoint Presentation
Graphic of CMM is used to design this business framework power point template. This PPT contains the maturity model for analysis based on the data collected from organization. Use this PPT and create a curve for analysis.
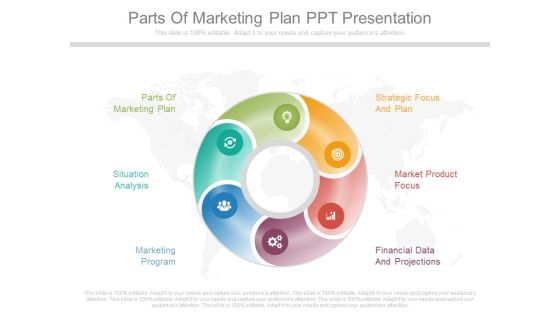
Parts Of Marketing Plan Ppt Presentation
This is a parts of marketing plan ppt presentation. This is a six stage process. The stages in this process are parts of marketing plan, strategic focus and plan, situation analysis, market product focus, marketing program, financial data and projections.

Email Survey Service Diagram Ppt Slide Design
This is a email survey service diagram ppt slide design. This is a four stage process. The stages in this process are design, administration, data collection, report and analysis.

Strategic Sourcing Implementation Ppt Presentation Pictures
This is a strategic sourcing implementation ppt presentation pictures. This is a seven stage process. The stages in this process are data collection and analysis, sensor supplier, resister supplier, connectors supplier, switches supplier, cable supplier, costumer.

Business Diagram Colorful Boxes For Business Options Presentation Template
Graphics of colorful text boxes have been used to design this power point template. This diagram contains the concept of data representation. Illustrate your ideas and imprint them in the minds of your team with this template.
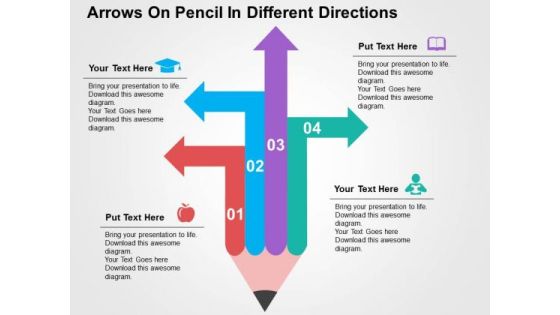
Arrows On Pencil In Different Directions PowerPoint Template
Create dynamic presentations with our professional template containing graphics of pencils with arrows and icons. This diagram is useful for data representation. Download this template to leave permanent impression on your audience.

Business Diagram Four Staged Torn Paper For Text Display PowerPoint Template
Four staged torn paper style text boxes has been used to design this power point template. This PPT contains the concept of text representation for business process. Use this PPT and build quality presentation for data and process related topics.

System Workflow With User Interface Validation Ppt PowerPoint Presentation Styles Clipart Images PDF
Presenting system workflow with user interface validation ppt powerpoint presentation styles clipart images pdf. to dispense important information. This template comprises six stages. It also presents valuable insights into the topics including transformation, physical access, data transformation, analyze data, validation, service specification, current configuration. This is a completely customizable PowerPoint theme that can be put to use immediately. So, download it and address the topic impactfully.
Six Staged Infographics Square With Business Icons Powerpoint Templates
This business diagram displays circular puzzle infographic. This editable slide is suitable to present global communication. Use this diagram for business and finance related topics and display complete data analysis in your presentation.
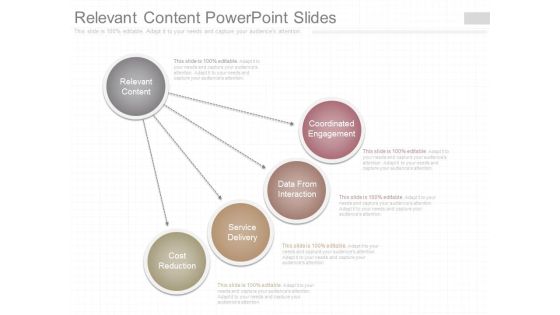
Relevant Content Powerpoint Slides
This is a relevant content powerpoint slides. This is a four stage process. The stages in this process are relevant content, coordinated engagement, data from interaction, service delivery, cost reduction.

Introduction Of Information System Diagram Powerpoint Guide
This is a introduction of information system diagram powerpoint guide. This is a six stage process. The stages in this process are executive information systems, purpose, transaction processing systems, information processes, participants, data information.

1G To 5G Wireless Communication System IT Overview Of 2 5 Generation And 2 75 Generation Systems Clipart PDF
This slide represents the overview of 2.5G and 2.75G communication systems, including the technologies deployed in these systems, such as GPRS, enhanced data GSM evolution, EDGE, and CDMA2000 for faster data rates and can deliver a data rate up to 384 kbps. Presenting 1G To 5G Wireless Communication System IT Overview Of 2 5 Generation And 2 75 Generation Systems Clipart PDF to provide visual cues and insights. Share and navigate important information on one stages that need your due attention. This template can be used to pitch topics like Data Rate, Popular Technology, Evolution. In addtion, this PPT design contains high resolution images, graphics, etc, that are easily editable and available for immediate download.
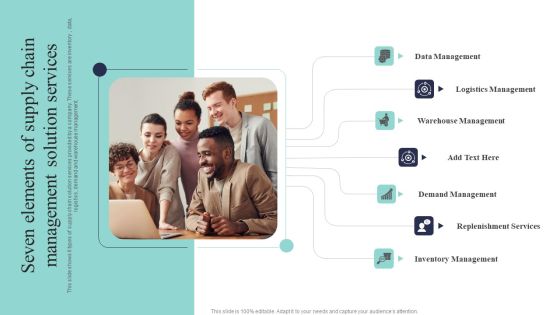
Seven Elements Of Supply Chain Management Solution Services Clipart PDF
This slide shows 6 types of supply chain solution services provided by a company. These services are inventory , data, logistics, demand and warehouse management. Presenting Seven Elements Of Supply Chain Management Solution Services Clipart PDF to dispense important information. This template comprises seven stages. It also presents valuable insights into the topics including Data Management, Logistics Management, Warehouse Management. This is a completely customizable PowerPoint theme that can be put to use immediately. So, download it and address the topic impactfully.

Content Ppt PowerPoint Presentation File Display
This is a content ppt powerpoint presentation file display. This is a six stage process. The stages in this process are introduction, data analysis, cost of quality, quality control.
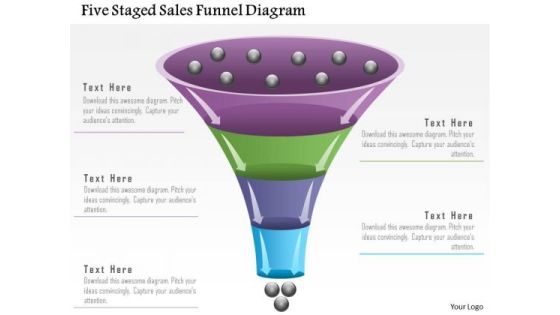
Business Diagram Five Staged Sales Funnel Diagram Presentation Template
Our above slide displays five staged sales funnel diagram. Download our above diagram to express information in a visual way. Use this diagram and get good comments for data related presentations.

Cylinder With Four Corporate Marketing Steps Powerpoint Template
Our above slide contains graphics of cylinder with four text tags. It may be used to display marketing steps. Use this diagram to impart more clarity to data and to create more sound impact on viewers.
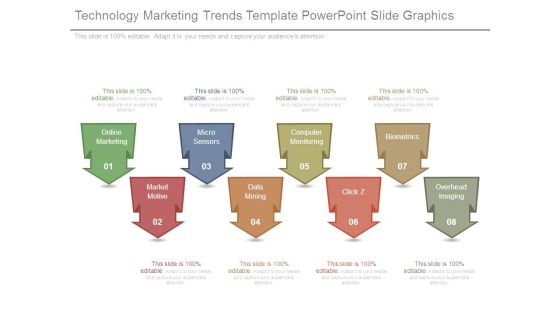
Technology Marketing Trends Template Powerpoint Slide Graphics
This is a technology marketing trends template powerpoint slide graphics. This is a eight stage process. The stages in this process are online marketing, market motive, micro sensors, data mining, computer monitoring, click z, biometrics, overhead imaging.
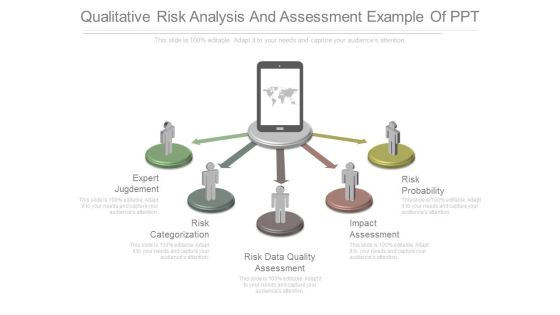
Qualitative Risk Analysis And Assessment Example Of Ppt
This is a qualitative risk analysis and assessment example of ppt. This is a five stage process. The stages in this process are expert jugdement, risk categorization, risk data quality assessment, impact assessment, risk probability.

Consumer Insights Outline Ppt PowerPoint Presentation Icon Example File
This is a consumer insights outline ppt powerpoint presentation icon example file. This is a six stage process. The stages in this process are research methodology, key statistics, data collection, need for consumer insights.
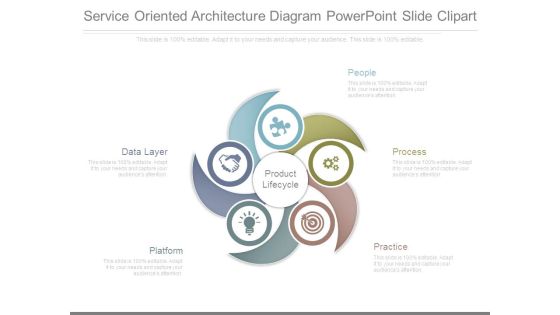
Service Oriented Architecture Diagram Powerpoint Slide Clipart
This is a service oriented architecture diagram powerpoint slide clipart. This is a five stage process. The stages in this process are product lifecycle, data layer, platform, people, process, practice.
Value Added By Channel Partnership Ppt PowerPoint Presentation Icon Ideas
This is a value added by channel partnership ppt powerpoint presentation icon ideas. This is a seven stage process. The stages in this process are catalog services, accounting services, advertising planning assistance, data processing programs and systems, employee training.

Representation To Other Executives Ppt Presentation
This is a representation to other executives ppt presentation. This is a four stage process. The stages in this process are data collection clerks, strong people skills, clear understand of overall change initiative, representation to other executives.

Technical Specifications Powerpoint Slide Presentation Tips
This is a technical specifications powerpoint slide presentation tips. This is a seven stage process. The stages in this process are discovery planning and development, project brief, user profiles, assets inventory, technical specifications, data entry.
Compressed Air Powerpoint Templates Microsoft
This is a compressed air powerpoint templates microsoft. This is a six stage process. The stages in this process are data flow diagram, compressed air, coalescer section, fresh caustic prewash, jet fuel feed, spent caustic drain.

Web Acceleration Security Software Example Of Ppt
This is a web acceleration security software example of ppt. This is a four stage process. The stages in this process are web acceleration, security software, shopping carts, data services.

Database Layout Tool Diagram Presentation Visuals
This is a database layout tool diagram presentation visuals. This is a three stage process. The stages in this process are database concepts, data modeling, database layout tool, database design.\n\n\n\n

Outputs And Methodology Ppt Background
This is a outputs and methodology ppt background. This is a six stage process. The stages in this process are jump start, preliminary insights, cautions and anomalies, learning moments, outputs and methodology, data checks and suggestions.
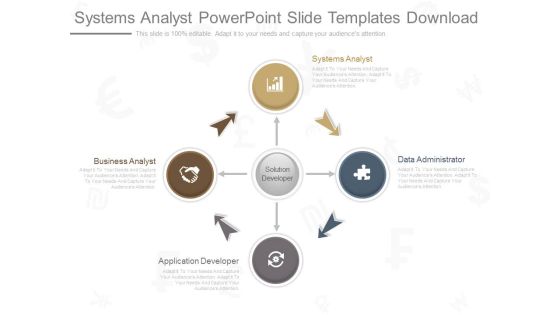
Systems Analyst Powerpoint Slide Templates Download
This is a systems analyst powerpoint slide templates download. This is a four stage process. The stages in this process are solution developer, business analyst, application developer, data administrator, systems analyst.

Sample Of Three Types Of Internet Of Things Diagram Ppt Slides
This is a sample of three types of internet of things diagram ppt slides. This is a three stage process. The stages in this process are things with networked sensors, analytic engines, data storage.

Sop Strategic Plan Ppt Diagram Powerpoint Templates Microsoft
This is a sop strategic plan ppt diagram powerpoint templates microsoft. This is a six stage process. The stages in this process are production, construction, supplier, gather data and analyze, demand and supply, demand planning.

Capital Market Operations Template Powerpoint Slide Backgrounds
This is a capital market operations template powerpoint slide backgrounds. This is a four stage process. The stages in this process are operation, legal, data science engineering, capital markets operation.

Benefits Of Six Sigma Powerpoint Slide Background
This is a benefits of six sigma powerpoint slide background. This is a six stage process. The stages in this process are benefits of six sigma, bottom line, trained individuals, customer focused, engagement, project by project, data driven approach.

Business Diagram Three Interconnected Funnel Diagram Presentation Template
Graphic of three interconnected funnel diagram has been used to design this power point template diagram. This PPT diagram contains the concept of data and process flow. Use this PPT for marketing and business related presentations.
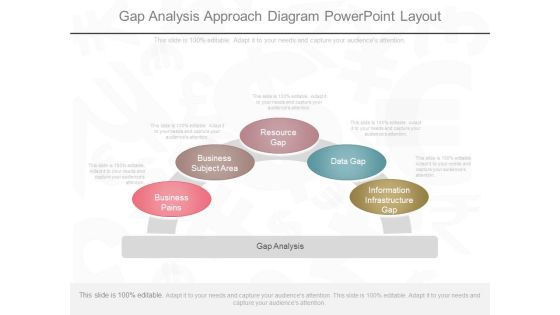
Gap Analysis Approach Diagram Powerpoint Layout
This is a gap analysis approach diagram powerpoint layout. This is a five stage process. The stages in this process are information infrastructure gap, data gap, resource gap, business subject area, business pains.

Marketing Information System Example Ppt Slide Themes
This is a marketing information system example ppt slide themes. This is a six stage process. The stages in this process are government resources, customers, sales force, marketing research, data analytics, interactive marketing.
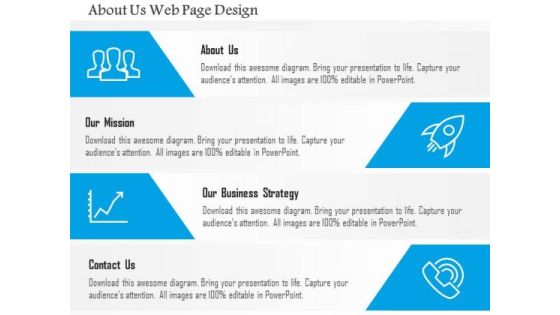
Business Diagram About Us Web Page Design Presentation Template
This power point template diagram has been designed with graphic of four icons. This PPT can represent the concept of building about us. This PPT is suitable for business and data related presentations.

Business Diagram Three Circular Financial Pie Chart PowerPoint Template
This power point template has been designed with graphic of three circular pie chart. This pie chart is suitable for financial data representation. Use this PPt for your business and finance related presentations.
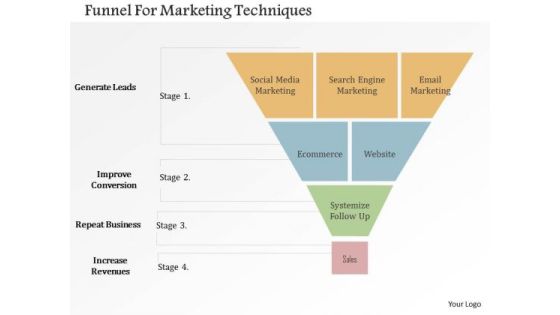
Business Diagram Funnel For Marketing Techniques Presentation Template
Our above slide contains graphics of funnel diagram. It helps to exhibit marketing techniques. Use this diagram to impart more clarity to data and to create more sound impact on viewers.
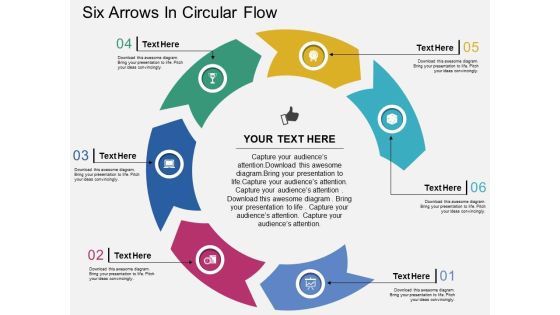
Six Arrows In Circular Flow Powerpoint Templates
Our above PPT slide contains graphics of circular diagram. This business diagram helps to display outline of business plan. Use this template to impart more clarity to data and to create more sound impact on viewers.

Seed Funding Ppt PowerPoint Presentation Complete Deck With Slides
This is a seed funding ppt powerpoint presentation complete deck with slides. This is a one stage process. The stages in this process are tables, teamwork, technology, data analysis, marketing.
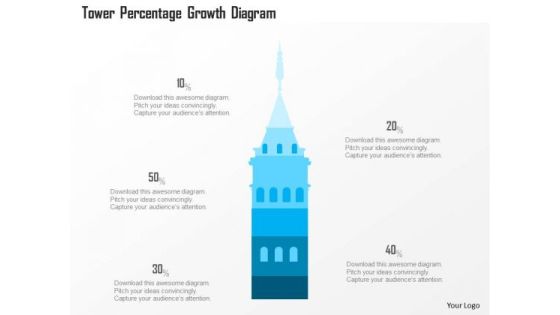
Business Diagram Tower Percentage Growth Diagram Presentation Template
This power point diagram slide has been crafted with graphic of 3d blue tower and text boxes. This PPT slide contains the concept of data and text representations. Use this PPT slide for your business and management related presentations.

Cloud Technology Ecosystem And Tools Ppt Images Gallery
This is a cloud technology ecosystem and tools ppt images gallery. This is a nine stage process. The stages in this process are databases, storage, big four, specialized, infrastructure, data center, large analytic, service.

Customer Analysis Powerpoint Slide Presentation Examples
This is a customer analysis powerpoint slide presentation examples. This is a six stage process. The stages in this process are customer analysis, true capabilities analysis, market competitive analysis, data mining and profiting, segmenting and targeting, positioning and differentiating.

Competitor Analysis Strategic Applications Powerpoint Show
This is a competitor analysis strategic applications powerpoint show. This is a five stage process. The stages in this process are competitor analysis, implementation & monitoring, data acquisition, knowledge development tools, strategic applications.

Oracle Analytics Cloud Application Roles Background PDF
This slide represents the oracle analytics aloud application roles. It includes BI service administrator, BI data model author, BI content writer, BI data load, DV content writer, and DV consumer. Deliver an awe inspiring pitch with this creative oracle analytics cloud application roles background pdf bundle. Topics like administrator, content, communicate, dashboards, visualizations can be discussed with this completely editable template. It is available for immediate download depending on the needs and requirements of the user.

Architecture Of Google Cloud Google Cloud Computing System Topics PDF
This slide describes the architecture of the Google cloud, how data is stored, and covers regions, zones, and load balancers that help store data. Deliver an awe inspiring pitch with this creative Architecture Of Google Cloud Google Cloud Computing System Topics PDF bundle. Topics like Examines Instance, Various Regions, Clients Distribute can be discussed with this completely editable template. It is available for immediate download depending on the needs and requirements of the user.
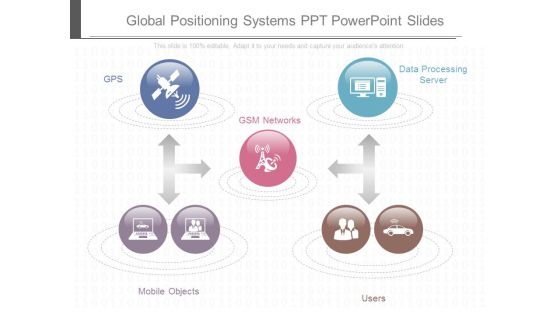
Global Positioning Systems Ppt Powerpoint Slides
This is a global positioning systems ppt powerpoint slides. This is a five stage process. The stages in this process are gps, data processing server, gsm networks, mobile objects, users.

Measurement Of Portfolio Analysis Ppt PowerPoint Presentation Clipart
This is a measurement of portfolio analysis ppt powerpoint presentation clipart. This is a two stage process. The stages in this process are your current portfolio, holding, current weight, current value, data analysis.

Competitive Analysis Scatter Chart Template 2 Ppt PowerPoint Presentation Files
This is a competitive analysis scatter chart template 2 ppt powerpoint presentation files. This is a nine stage process. The stages in this process are users interface, data import, example, pricing, support, update.
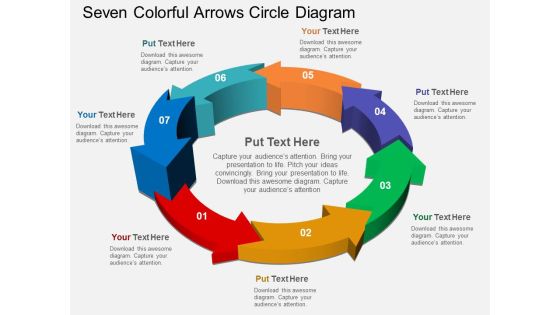
Seven Colorful Arrows Circle Diagram Powerpoint Templates
Our above PPT slide contains arrows infographic. It helps to display outline of business plan. Use this diagram to impart more clarity to data and to create more sound impact on viewers.
Hexagonal Chart With Finance And Communication Icons Powerpoint Template
Our above slide contains hexagonal chart with finance and communication icons. This PowerPoint template helps to display communication steps. Use this diagram to impart more clarity to data and to create more sound impact on viewers.
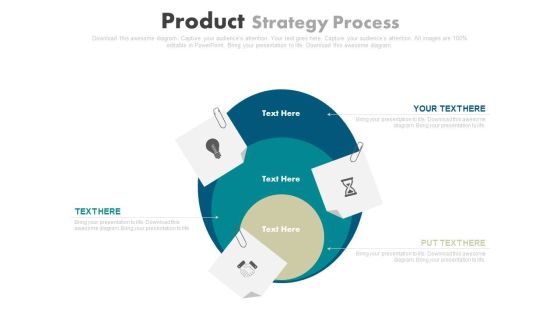
Three Steps Business Strategy Chart Powerpoint Template
This PowerPoint slide contains three steps infographic hart. It helps to exhibit business strategy steps. Use this diagram to impart more clarity to data and to create more sound impact on viewers.
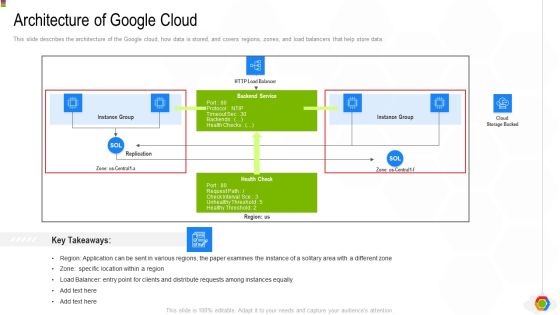
Google Cloud Console IT Architecture Of Google Cloud Ppt Professional Example PDF
This slide describes the architecture of the Google cloud, how data is stored, and covers regions, zones, and load balancers that help store data. Deliver and pitch your topic in the best possible manner with this google cloud console it architecture of google cloud ppt professional example pdf. Use them to share invaluable insights on architecture of google cloud and impress your audience. This template can be altered and modified as per your expectations. So, grab it now.
 Home
Home