Data Challenges/icons/appstore.png

7 Piece Wheel For Organization Market Research Ppt Infographic Template Design Templates PDF
Presenting 7 Piece Wheel For Organization Market Research Ppt Infographic Template Design Templates PDF to dispense important information. This template comprises seven stages. It also presents valuable insights into the topics including Analyze Your Data, Interpretation Your Result, Visualize Your Data. This is a completely customizable PowerPoint theme that can be put to use immediately. So, download it and address the topic impactfully.

8 Piece Wheel For Organization Market Research Ppt Ideas Shapes PDF
Presenting 8 Piece Wheel For Organization Market Research Ppt Ideas Shapes PDF to dispense important information. This template comprises eight stages. It also presents valuable insights into the topics including Analyze Your Data, Interpretation Your Result, Visualize Your Data. This is a completely customizable PowerPoint theme that can be put to use immediately. So, download it and address the topic impactfully.

9 Piece Wheel For Organization Market Research Ppt Portfolio Layouts PDF
Presenting 9 Piece Wheel For Organization Market Research Ppt Portfolio Layouts PDF to dispense important information. This template comprises nine stages. It also presents valuable insights into the topics including Analyze Your Data, Interpretation Your Result, Visualize Your Data. This is a completely customizable PowerPoint theme that can be put to use immediately. So, download it and address the topic impactfully.

10 Piece Wheel For Organization Market Research Ppt File Samples PDF
Presenting 10 Piece Wheel For Organization Market Research Ppt File Samples PDF to dispense important information. This template comprises ten stages. It also presents valuable insights into the topics including Analyze Your Data, Interpretation Your Result, Visualize Your Data. This is a completely customizable PowerPoint theme that can be put to use immediately. So, download it and address the topic impactfully.

11 Piece Wheel For Organization Market Research Ppt Styles Graphics Example PDF
Presenting 11 Piece Wheel For Organization Market Research Ppt Styles Graphics Example PDF to dispense important information. This template comprises eleven stages. It also presents valuable insights into the topics including Analyze Your Data, Interpretation Your Result, Visualize Your Data. This is a completely customizable PowerPoint theme that can be put to use immediately. So, download it and address the topic impactfully.

12 Piece Wheel For Organization Market Research Ppt Layouts Layout PDF
Presenting 12 Piece Wheel For Organization Market Research Ppt Layouts Layout PDF to dispense important information. This template comprises tweleve stages. It also presents valuable insights into the topics including Analyze Your Data, Interpretation Your Result, Visualize Your Data. This is a completely customizable PowerPoint theme that can be put to use immediately. So, download it and address the topic impactfully.

Ppt Arrow Illustration Of 4 Concepts PowerPoint Templates
PPT arrow illustration of 4 concepts PowerPoint Templates-Use this Diagram to display the data. It make easier for the analysts to visualize and interpret the data-PPT arrow illustration of 4 concepts PowerPoint Templates-3d, Abstract, Around, Arrows, Blue, Border, Business, Center, Circle, Circular, Concept, Connections, Copy, Curve, Cycle, Directions, Distribution, Illustration, Management, Middle, Objects, Pieces, Plan, Pointing, Process, Recycle, Rounded, Shadows, Space, System
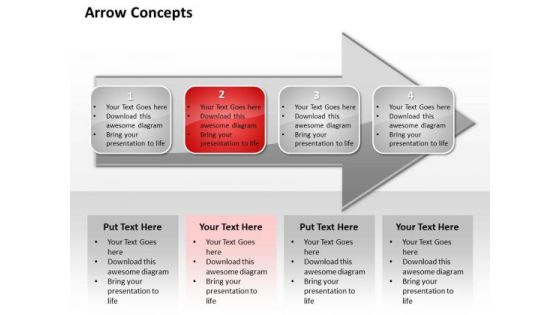
Ppt Illustration Of Concept Free Download Concepts PowerPoint Templates
PPT illustration of concept free download concepts PowerPoint Templates-Use this Diagram to display the data. It makes easier for the analysts to visualize and interpret the data-PPT illustration of concept free download concepts PowerPoint Templates-3d, Abstract, Around, Arrows, Blue, Border, Business, Center, Circle, Circular, Concept, Connections, Copy, Curve, Cycle, Directions, Distribution, Illustration, Management, Middle, Objects, Pieces, Plan, Pointing, Process, Recycle, Rounded, Shadows, Space, System

Business And Marketing Planning Solutions Presentation Ideas
This is a business and marketing planning solutions presentation ideas. This is a five stage process. The stages in this process are adjust budget expectations or goals, monitor outcomes analyze variances, define goals and gather data, from expectations reconcile goals and data, create budget.

Continuous Learning Example Powerpoint Templates
This is a continuous learning example powerpoint templates. This is a eight stage process. The stages in this process are implement and test, monitoring evaluating and adjusting, generate solutions, analyse data, selecting a strategy, gather data, developing options, continue to improve.

Assessing Stocks In Financial Market Relative Valuation Approach For Equity Research Ppt PowerPoint Presentation Ideas Graphics Tutorials PDF
Presenting this set of slides with name assessing stocks in financial market relative valuation approach for equity research ppt powerpoint presentation ideas graphics tutorials pdf. This is a three stage process. The stages in this process are market data, financial data, valuation. This is a completely editable PowerPoint presentation and is available for immediate download. Download now and impress your audience.
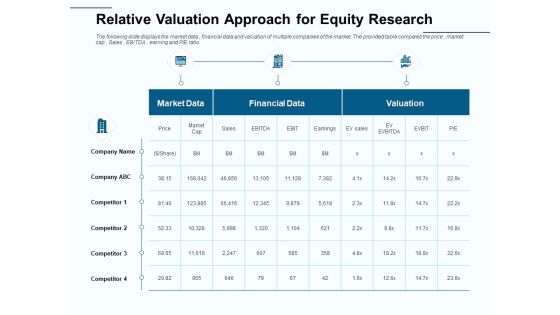
Fund Investment Advisory Statement Relative Valuation Approach For Equity Research Elements PDF
Presenting this set of slides with name fund investment advisory statement relative valuation approach for equity research elements pdf. The topics discussed in these slides are market data, financial data, valuation. This is a completely editable PowerPoint presentation and is available for immediate download. Download now and impress your audience.

AI Machine Learning Presentations 10 AI Trend In 2020 Ppt Slides Example PDF
Presenting this set of slides with name ai machine learning presentations 10 ai trend in 2020 ppt slides example pdf. This is a seven stage process. The stages in this process are preparing that data, choosing a model, training, evaluation, prediction, gathering data, hyperparameter tuning. This is a completely editable PowerPoint presentation and is available for immediate download. Download now and impress your audience.

Boosting Machine Learning Machine Learning Humans Ppt PowerPoint Presentation Gallery Visuals PDF
Presenting this set of slides with name boosting machine learning machine learning humans ppt powerpoint presentation gallery visuals pdf. This is a two stage process. The stages in this process are traditional programming, machine learning, input data, output data. This is a completely editable PowerPoint presentation and is available for immediate download. Download now and impress your audience.

New Product Introduction In The Market Sales Forecasting Ppt PowerPoint Presentation Visual Aids Pictures PDF
Presenting this set of slides with name new product introduction in the market sales forecasting ppt powerpoint presentation visual aids pictures pdf. The topics discussed in these slides are historical data, projected data. This is a completely editable PowerPoint presentation and is available for immediate download. Download now and impress your audience.
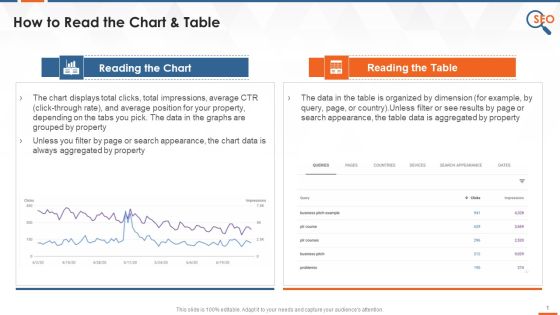
Reading Charts And Tables In Google Search Console Training Ppt
This slide covers how a user can read charts and tables in the google search console. It also depicts that Unless users filter by page or search appearance, the chart data, as well as table data, will always be aggregated by property.
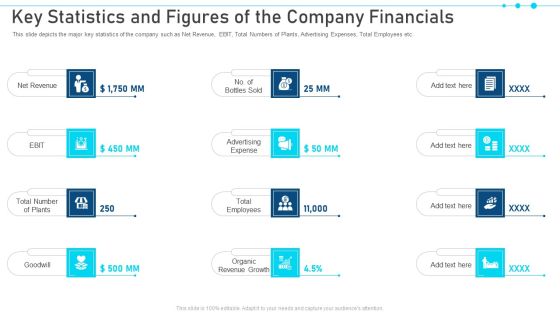
Key Statistics And Figures Of The Company Financials Information PDF
This slide depicts the major key statistics of the company such as Net Revenue, EBIT, Total Numbers of Plants, Advertising Expenses, Total Employees etc. This is a key statistics and figures of the company financials information pdf. template with various stages. Focus and dispense information on tweleve stages using this creative set, that comes with editable features. It contains large content boxes to add your information on topics like net revenue, ebit, total number of plants, goodwill, organic revenue growth. You can also showcase facts, figures, and other relevant content using this PPT layout. Grab it now.

Identifying Optimum Pricing Methods For Business Steps To Be Followed To Optimize Your Pricing Designs PDF
This template covers the steps which must be considered by the company to optimize the prices of the products through understand the companys quantitative data, quantify value, analyze the data, adjust pricing and monitor. This is a Identifying Optimum Pricing Methods For Business Steps To Be Followed To Optimize Your Pricing Designs PDF template with various stages. Focus and dispense information on four stages using this creative set, that comes with editable features. It contains large content boxes to add your information on topics like Quantify Value, Analyze The Data, Adjust Pricing And Monitor. You can also showcase facts, figures, and other relevant content using this PPT layout. Grab it now.

Instagram Company Details Key Stats And Figures Graphics PDF
This slide covers the key statistics associated with Instagram which represents active users in United States, average engagement rate, most visited website, platform usage time, etc. Presenting Instagram Company Details Key Stats And Figures Graphics PDF to provide visual cues and insights. Share and navigate important information on six stages that need your due attention. This template can be used to pitch topics like Average, Business Accounts, Application. In addtion, this PPT design contains high resolution images, graphics, etc, that are easily editable and available for immediate download.

Tactical Measures And Strategic Analysis Framework For Competitors Elements PDF
This slide defines the template for planning and analyzing the strategies to be implemented. It includes information related to the data, analysis, reviews, strategic matrix and implement. Persuade your audience using this Tactical Measures And Strategic Analysis Framework For Competitors Elements PDF. This PPT design covers five stages, thus making it a great tool to use. It also caters to a variety of topics including Gather Data, Conduct Analysis, Review Data. Download this PPT design now to present a convincing pitch that not only emphasizes the topic but also showcases your presentation skills.

Change Management Process Steps To Conduct Impacted Employee Analysis Professional PDF
This slide covers the steps to conduct impacted employee analysis which includes collecting data, identifying impacted groups, job roles and duties, authenticating employee analysis data, etc. The Change Management Process Steps To Conduct Impacted Employee Analysis Professional PDF is a compilation of the most recent design trends as a series of slides. It is suitable for any subject or industry presentation, containing attractive visuals and photo spots for businesses to clearly express their messages. This template contains a variety of slides for the user to input data, such as structures to contrast two elements, bullet points, and slides for written information. Slidegeeks is prepared to create an impression.

Feature Development Workflow Model For Machine Learning Pictures PDF
Following slide represents predictive workflow model of feature engineering. Purpose of this slide is to understand working mechanism and structure of feature engineering process that helps in simplifying complex data. It includes elements such as sources, raw data, features etc. Showcasing this set of slides titled Feature Development Workflow Model For Machine Learning Pictures PDF. The topics addressed in these templates are Raw Data, Features, Modeling. All the content presented in this PPT design is completely editable. Download it and make adjustments in color, background, font etc. as per your unique business setting.

Approach For Undertaking Commercial Verification System Projects Guidelines PDF
This slide covers hypothesis approach for undertaking commercial due diligence projects which focuses on framing problem, developing working hypothesis, identifying key assumptions, collecting data, analyzing data, drawing conclusions, refining hypothesis, etc. Presenting Approach For Undertaking Commerc Approach For Undertaking Commercial Verification System Projects Guidelines PDF to dispense important information. This template comprises one stages. It also presents valuable insights into the topics including Collecting Information, Analyzing Data, Required. This is a completely customizable PowerPoint theme that can be put to use immediately. So, download it and address the topic impactfully

Three Ways To Manage Trader Risk In Enrollment Summary PDF
This slide contains the information related to the ways of managing merchant risk that he may face during onboarding as well as for the monitoring purpose. It includes gathering actionable data, leverage analytics and rules and ensure comprehensive monitoring approach. Presenting Three Ways To Manage Trader Risk In Enrollment Summary PDF to dispense important information. This template comprises three stages. It also presents valuable insights into the topics including Leverage Analytics, Application Data, External Data. This is a completely customizable PowerPoint theme that can be put to use immediately. So, download it and address the topic impactfully.

Planned Statistics Assessment Template Powerpoint Themes
This is a planned statistics assessment template powerpoint themes. This is a eight stage process. The stages in this process are cleanse, group, stakeholder and users, technology and infrastructure, process and data, analyze, validate, collect.

Dashboard For Real Time Telemarketing Process Management Themes PDF
The following slide highlights the dashboard for real time telesales process management illustrating real time data, employee data, performance, daily data, average handled call vs average answered call, employee ranking, AHT, AvgACW, ASA and hold percentage Showcasing this set of slides titled dashboard for real time telemarketing process management themes pdf The topics addressed in these templates are dashboard for real time telemarketing process management All the content presented in this PPT design is completely editable. Download it and make adjustments in color, background, font etc. as per your unique business setting.

Acquisition Analytics For Category Management Program Download PDF
This slide depicts the impact of using procurement analytics for managing category plan and sourcing strategies. It lists down visibility areas with corresponding actions involved and how it impacts the business in general. Showcasing this set of slides titled Acquisition Analytics For Category Management Program Download PDF. The topics addressed in these templates are Supplier Data, Spend Data, Performance Data. All the content presented in this PPT design is completely editable. Download it and make adjustments in color, background, font etc. as per your unique business setting.

Comprehensive Guide For Launch Sales By Lead Source Performance Indicator Inspiration PDF
This graph or chart is linked to excel, and changes automatically based on data. Just left click on it and select Edit Data. The Comprehensive Guide For Launch Sales By Lead Source Performance Indicator Inspiration PDF is a compilation of the most recent design trends as a series of slides. It is suitable for any subject or industry presentation, containing attractive visuals and photo spots for businesses to clearly express their messages. This template contains a variety of slides for the user to input data, such as structures to contrast two elements, bullet points, and slides for written information. Slidegeeks is prepared to create an impression.

Best Practices For Permission Advertising Campaign Mockup PDF
This slide exhibits permission marketing practices to increase customer engagement and conversion rates. It includes four points clearly state privacy policy, prioritize customer data, understand target audience and secure consumer data. Presenting Best Practices For Permission Advertising Campaign Mockup PDF to dispense important information. This template comprises four stages. It also presents valuable insights into the topics including Understand Target Audience, Secure Consumer Data, Prioritize Customer Choice. This is a completely customizable PowerPoint theme that can be put to use immediately. So, download it and address the topic impactfully.

NIST Cybersecurity Framework Compliance Checklist For Organizations Inspiration PDF
The slide showcases a compliance checklist for adhering to standards and regulation. It includes identify relevant data, classify data, develop baseline control, test baseline control, assess for risk control, develop a plan, roll out plan and monitor. Presenting NIST Cybersecurity Framework Compliance Checklist For Organizations Inspiration PDF to dispense important information. This template comprises eight stages. It also presents valuable insights into the topics including Develop Baseline Control, Monitor, Classify Data. This is a completely customizable PowerPoint theme that can be put to use immediately. So, download it and address the topic impactfully.

Business Corporate Ecommerce Statistics Powerpoint Slides
This PowerPoint template contains three tags with numeric data. You may download this slide to display business, corporate and ecommerce statistics. You can easily customize this template to make it more unique as per your need.

Planned Statistics Assessment Template Ppt Diagrams
This is a planned statistics assessment template ppt diagrams. This is a eight stage process. The stages in this process are quality context, competitors, stakeholders and users, processes and data, resources, evaluation, tools and techniques, structure.
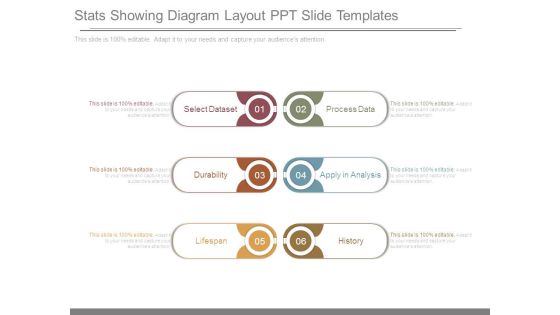
Stats Showing Diagram Layout Ppt Slide Templates
This is a stats showing diagram layout ppt slide templates. This is a six stage process. The stages in this process are select dataset, durability, lifespan, process data, apply in analysis, history.
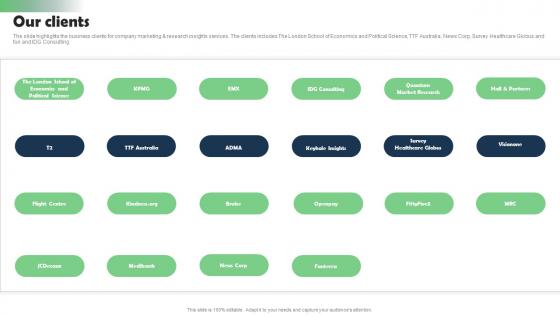
Our Clients Marketing Research Services Management Business Information Pdf
The slide highlights the business clients for company marketing and research insights services. The clients includes The London School of Economics and Political Science, TTF Australia, News Corp, Survey Healthcare Globus and fun and IDG Consulting. Retrieve professionally designed Our Clients Marketing Research Services Management Business Information Pdf to effectively convey your message and captivate your listeners. Save time by selecting pre-made slideshows that are appropriate for various topics, from business to educational purposes. These themes come in many different styles, from creative to corporate, and all of them are easily adjustable and can be edited quickly. Access them as PowerPoint templates or as Google Slides themes. You do not have to go on a hunt for the perfect presentation because Slidegeeks got you covered from everywhere.
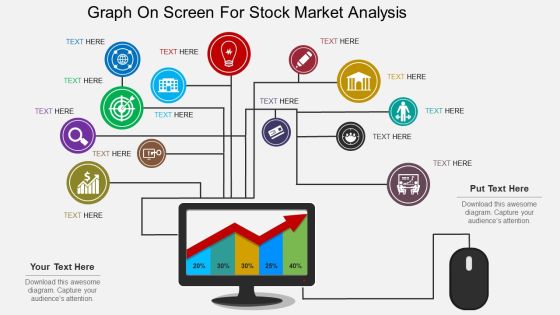
Graph On Screen For Stock Market Analysis Powerpoint Template
This PowerPoint slide contains computer screen with business graph. This professional slide may be used for visual explanation of data. Adjust the above diagram in your business presentations to give professional impact.
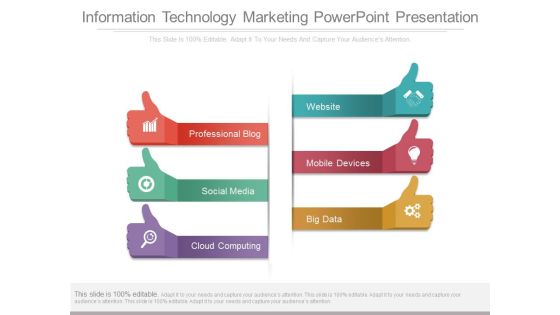
Information Technology Marketing Powerpoint Presentation
This is an information technology marketing powerpoint presentation. This is a six stage process. The stages in this process are website, mobile devices, big data, cloud computing, social media, professional blog.
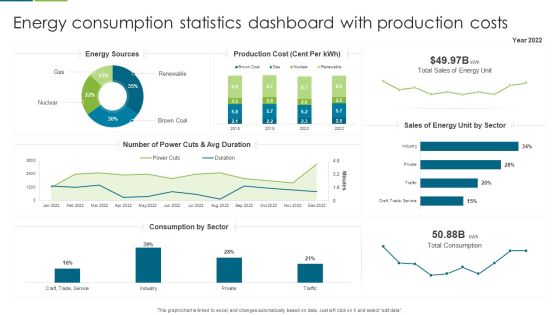
Energy Consumption Statistics Dashboard With Production Costs Slides PDF
This graph or chart is linked to excel, and changes automatically based on data. Just left click on it and select edit data. Showcasing this set of slides titled Energy Consumption Statistics Dashboard With Production Costs Slides PDF. The topics addressed in these templates are Production Cost, Sales Energy, Number Power. All the content presented in this PPT design is completely editable. Download it and make adjustments in color, background, font etc. as per your unique business setting.

Energy Consumption Statistics Dashboard With Yearly Savings Guidelines PDF
This graph or chart is linked to excel, and changes automatically based on data. Just left click on it and select edit data. Showcasing this set of slides titled Energy Consumption Statistics Dashboard With Yearly Savings Guidelines PDF. The topics addressed in these templates are Production Consumption, Energy Savings, Performance Ratio. All the content presented in this PPT design is completely editable. Download it and make adjustments in color, background, font etc. as per your unique business setting.
Key Statistics And Figures Of Referral Promotional Program Icons PDF
This slide provides an overview of the referral advertising stats. Major stats covered are generate the best leads, ensure high conversion, referrals from family and friends are more trusted, influences buying decisions, etc. Want to ace your presentation in front of a live audience Our Key Statistics And Figures Of Referral Promotional Program Icons PDF can help you do that by engaging all the users towards you.. Slidegeeks experts have put their efforts and expertise into creating these impeccable powerpoint presentations so that you can communicate your ideas clearly. Moreover, all the templates are customizable, and easy-to-edit and downloadable. Use these for both personal and commercial use.

Appliances Energy And Cost Consumption Statistics Dashboard Download PDF
This graph or chart is linked to excel, and changes automatically based on data. Just left click on it and select edit data. Presenting Appliances Energy And Cost Consumption Statistics Dashboard Download PDF to dispense important information. This template comprises ten stages. It also presents valuable insights into the topics including Water Heater, Electric Vehicle, Pool Pump. This is a completely customizable PowerPoint theme that can be put to use immediately. So, download it and address the topic impactfully.

Chart Illustrating Manufacturing Plant Energy Consumption Statistics Slides PDF
This graph or chart is linked to excel, and changes automatically based on data. Just left click on it and select edit data. Pitch your topic with ease and precision using this Chart Illustrating Manufacturing Plant Energy Consumption Statistics Slides PDF. This layout presents information on Equipment Inefficiency, Process Heating, Energy Export. It is also available for immediate download and adjustment. So, changes can be made in the color, design, graphics or any other component to create a unique layout.
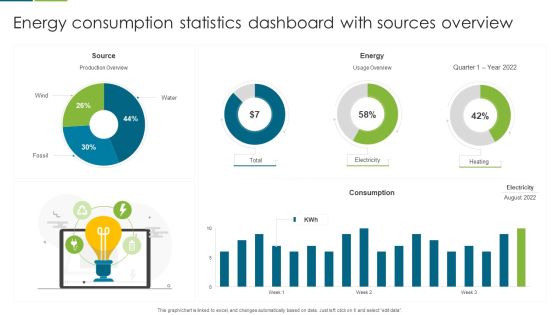
Energy Consumption Statistics Dashboard With Sources Overview Template PDF
This graph or chart is linked to excel, and changes automatically based on data. Just left click on it and select edit data. Pitch your topic with ease and precision using this Energy Consumption Statistics Dashboard With Sources Overview Template PDF. This layout presents information on Source, Energy, Consumption. It is also available for immediate download and adjustment. So, changes can be made in the color, design, graphics or any other component to create a unique layout.
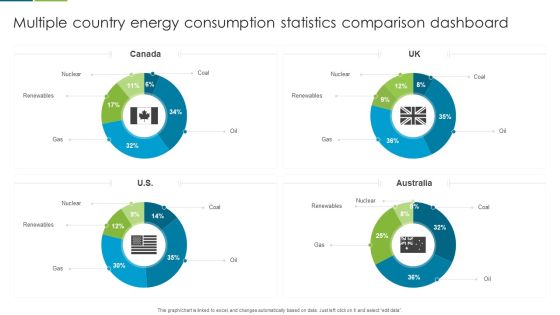
Multiple Country Energy Consumption Statistics Comparison Dashboard Formats PDF
This graph or chart is linked to excel, and changes automatically based on data. Just left click on it and select edit data. Pitch your topic with ease and precision using this Multiple Country Energy Consumption Statistics Comparison Dashboard Formats PDF. This layout presents information on Nuclear, Renewables, Gas. It is also available for immediate download and adjustment. So, changes can be made in the color, design, graphics or any other component to create a unique layout.

Prevention Of Information Major Statistics Of Cyber Security Awareness Pictures PDF
This graph or chart is linked to excel, and changes automatically based on data. Just left click on it and select Edit Data. There are so many reasons you need a Prevention Of Information Major Statistics Of Cyber Security Awareness Pictures PDF. The first reason is you cant spend time making everything from scratch, Thus, Slidegeeks has made presentation templates for you too. You can easily download these templates from our website easily.
Four Text Boxes With Icons Powerpoint Templates
This Business diagram can be used to display data, business information etc. You can easily customize this PowerPoint template as per your need. Capture the attention of your audience.

Integrated Business Analysis Powerpoint Slides Design
This is a integrated business analysis powerpoint slides design. This is a five stage process. The stages in this process are approach data, investigation, statistics, practice methods, solution optimization.

Business Diagram Five Staged Business Points Display Text Box Diagram Presentation Template
This Power Point template slide has been designed with graphic of five staged text box diagrams. This PPT slide can be used for displaying business data. Use this PPT slide for your business presentations and get good remarks.
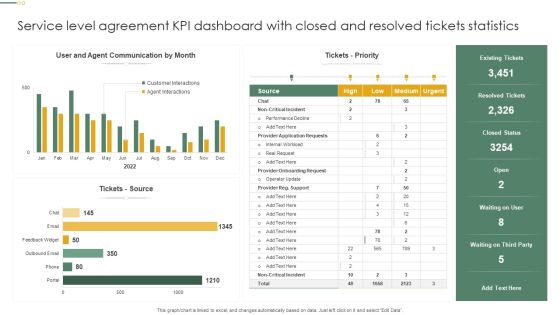
Service Level Agreement KPI Dashboard With Closed And Resolved Tickets Statistics Inspiration PDF
This graph or chart is linked to excel, and changes automatically based on data. Just left click on it and select Edit Data. Showcasing this set of slides titled Service Level Agreement KPI Dashboard With Closed And Resolved Tickets Statistics Inspiration PDF. The topics addressed in these templates are Tickets Priority, Tickets Source, Resolved Tickets. All the content presented in this PPT design is completely editable. Download it and make adjustments in color, background, font etc. as per your unique business setting.
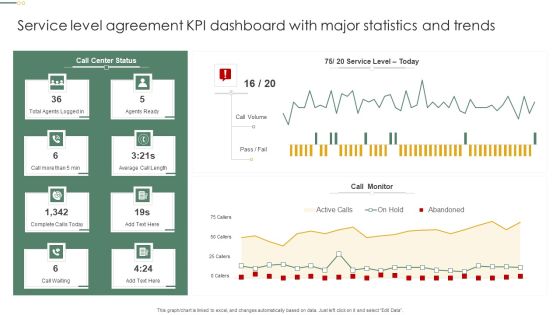
Service Level Agreement KPI Dashboard With Major Statistics And Trends Pictures PDF
This graph or chart is linked to excel, and changes automatically based on data. Just left click on it and select Edit Data. Pitch your topic with ease and precision using this Service Level Agreement KPI Dashboard With Major Statistics And Trends Pictures PDF. This layout presents information on Call Monitor, Call Volume, Agents Ready. It is also available for immediate download and adjustment. So, changes can be made in the color, design, graphics or any other component to create a unique layout.

Automobile Sales Scorecard With Unit Sold And Average Price Statistics Formats PDF
This graph or chart is linked to excel, and changes automatically based on data. Just left click on it and select Edit Data. Deliver an awe inspiring pitch with this creative Automobile Sales Scorecard With Unit Sold And Average Price Statistics Formats PDF bundle. Topics like Automobile Sales Scorecard, Unit Sold Revenue, Average Price Statistics can be discussed with this completely editable template. It is available for immediate download depending on the needs and requirements of the user.

Security Monitoring Dashboard With Application Control And Operating System Statistics Template PDF
This graph or chart is linked to excel, and changes automatically based on data. Just left click on it and select Edit Data. Deliver and pitch your topic in the best possible manner with this security monitoring dashboard with application control and operating system statistics template pdf. Use them to share invaluable insights on application control, restrict office macros, application patching, application hardening and impress your audience. This template can be altered and modified as per your expectations. So, grab it now.

Netflix Company Outline Key Stats And Figures Formats PDF
This slide showcases the key statistics related to Netflix which includes paid subscribers, platform usage, average user age, average compound annual growth rate, video content production and awards.This is a Netflix Company Outline Key Stats And Figures Formats PDF template with various stages. Focus and dispense information on six stages using this creative set, that comes with editable features. It contains large content boxes to add your information on topics like Streaming Platforms, Content Production, Average Compound. You can also showcase facts, figures, and other relevant content using this PPT layout. Grab it now.
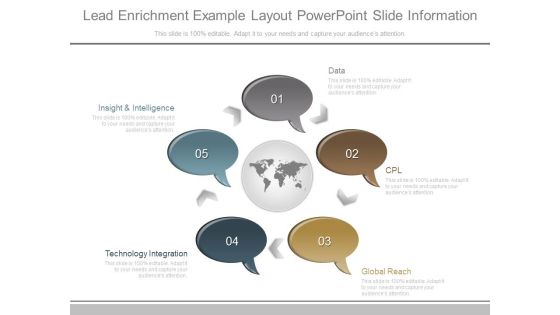
Lead Enrichment Example Layout Powerpoint Slide Information
This is a lead enrichment example layout powerpoint slide information. This is a five stage process. The stages in this process are data, cpl, global reach, technology integration, insight and intelligence.

Business Marketing Websites Example Powerpoint Slide Information
This is a business marketing websites example powerpoint slide information. This is a five stage process. The stages in this process are define goals, analyze data, content, navigation, design.
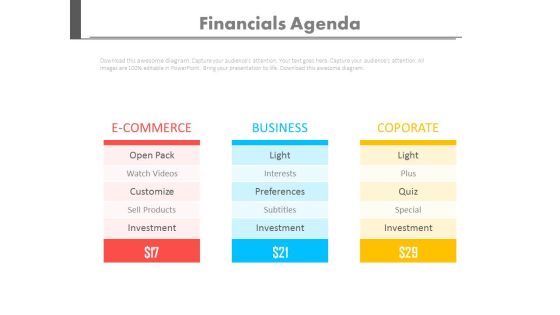
Three Tags For Ecommerce Business And Corporate Concepts Powerpoint Slides
This PowerPoint template contains three tags with numeric data. You may download this slide to display business, corporate and ecommerce statistics. You can easily customize this template to make it more unique as per your need.

Professional Services Support Diagram Presentation Visual Aids
This is a professional services support diagram presentation visual aids. This is a five stage process. The stages in this process are statistical models, gather data, enrollment, capacity, boundaries.
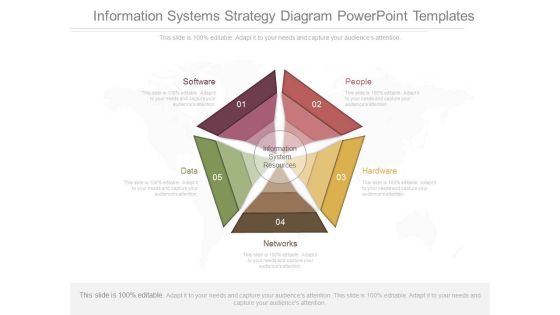
Information Systems Strategy Diagram Powerpoint Templates
This is a information systems strategy diagram powerpoint templates. This is a five stage process. The stages in this process are software, people, hardware, data, networks, information system resources.

Key Facts And Figures Of Display Advertising Statistics Brochure PDF
Mentioned slide provides overview of major facts and figures of affiliate marketing. It incorporate annual change in advertising spendings, average CPC of google and facebook, annual earning by google via display advertising. Slidegeeks has constructed Key Facts And Figures Of Display Advertising Statistics Brochure PDF after conducting extensive research and examination. These presentation templates are constantly being generated and modified based on user preferences and critiques from editors. Here, you will find the most attractive templates for a range of purposes while taking into account ratings and remarks from users regarding the content. This is an excellent jumping off point to explore our content and will give new users an insight into our top notch PowerPoint Templates.
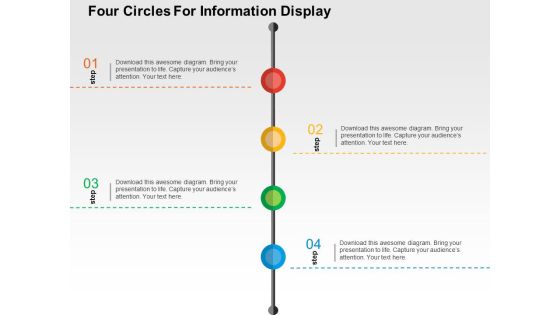
Four Circles For Information Display Powerpoint Templates
This PowerPoint slide contains graphics of four circles. This professional slide may be used for visual explanation of data. Adjust the above diagram in your business presentations to give professional impact.

Machine Learning Main Points Ppt PowerPoint Presentation Diagram Graph Charts
This is a machine learning main points ppt powerpoint presentation diagram graph charts. This is a four stages process. The stages in this process are learning, pattern detection, programming, data, machine learning main points.


 Continue with Email

 Home
Home


